Effect of Compaction on Physical and Micromorphological
Properties of Forest Soils
Iraj Bagheri1, Samira Bahram Kalhori2, Mehdi Akef2, Farhad Khormali3
1Department of Agricultural Mechanization Engineering, Faculty of Agricultural Sciences, University of Guilan, Rasht, Iran; 2De-
partment of Soil Science, Faculty of Agriculture Sciences, University of Guilan, Rasht, Iran; 3Department of Soil Science, Faculty of
Agriculture, Gorgan University of Agricultural Sciences and Natural Resources, Gorgan, Iran. Email: [email protected]
Received August 15th, 2011; revised September 20th, 2011; accepted October 9th, 2011
ABSTRACT
The objective of this research was to assess the effect of skidding machinery on soil physical and micromorphological properties. The different positions (control or non-traffic areas, left wheel track, right wheel track and log track) and two soil depths (0 - 10 and 10 - 20 cm) in three repetitions were investigated. The results showed that average soil dry bulk density in four positions and two soil depths were significantly different. Comparison of average total porosity percent-age and soil saturated hydraulic conductivity revealed that there were significant differences in four positions and two soil depths. Soil thin section studies using Image Tool software showed that in compacted samples there was an in-crease in the number of vughs voids and channels voids were in low occurrence. Micromorphological studies showed that soil compaction caused void size to decrease. In compacted samples voids bigger than 10 μm were very rare and dominant voids size was 2 μm. In compacted samples soil structure were damaged and aggregates were compressed. Also soil matrix was compressed and microstructure was massive. Results from this study confirmed that skidding ma-chinery had a significant effect on soil physical and morphological properties. These changes causes soil and environ-mental degradation due to reduction in water infiltration increasing soil erosion risk.
Keywords: Soil Compaction; Forest Soils; Soil Physical; Micromorphological Properties
1. Introduction
Forest harvesting is an important, ongoing disturbance that affects the composition, structure, and ecological function of the majority of the world’s forests [1]. The skidder’s travel on skid trails causes damage to forest soil. The level of damages depends on the weight of the vehi-cles and loads as well as forest soil characteristics. Direct damages to forest soil are caused by compaction of soil particles attributable to vehicle traffic [2].
Logging always leads to a wide range of disturbing effects on the forest ecosystem. Soil compaction is the first consequence arising from skidder traffic and due to the weight of the machine with load, engine vibrations and wheel slip the soil in skid trails will be compacted. Therefore water and air infiltration decreases and run off increases [3].
Williamson and, Neilsen [4] in their study of soil compaction in skid trails during harvesting chose a plot of 20 × 5 m2 for sampling. In each plot they randomly
took two samples with cylinder from the left and right wheel tracks at 0 - 10, 10 - 20 and 20 - 30 cm depths. The rate and extent of soil compaction on skid trails was
measured at six field locations covering a range of dry and wet forests and data was collected for up to 21 passes of a laden logging machine. Their results showed that a similar extent of compaction, averaging 0.17 g/m3
in-crease in total soil bulk density, was recorded for all field sites despite substantial site and soil differences.
Naghdi et al. [5] in their research for two soil types
(clay soil with high and low liquid limits) using 450 C Timber Jack wheel skidder showed that the effect of skidder traffic on an increase in soil bulk density at sam-ple locations was significant. The range of soil bulk den-sity increases in sample pits due to a different number of machinery passes was from 15.8% to 62.6% compared to the control area. Najafi et al. [6] showed that during
skidding total porosity decreased significantly and the lowest total porosity was identified with slope > 20% and 14 passes by soil compaction. McNabb et al. [7] studied
Results showed that compaction, both in agricultural and forestry soils, not only reduce total soil porosity but also modifies the pore system. In fact, the proportion of elongated pores, useful for water movement and root growth is strongly reduced in compacted soil. The modi-fications to the pore system also change the type of soil structure: the massive and platy structures are common feature in compacted soil. Results also showed that the reduction of porosity and of elongated pores following compaction is strictly related to the increase of penetra-tion resistance and to the decrease of hydraulic conduc-tivity and root growth [8].
Micromorphology can be used to analyze undisturbed soils (qualitative and quantitative analysis) and other consolidated materials, usually in thin sections, using microscopic and submicroscopic techniques. The classi-fication of soil porosity by micromorphological approach is largely used to evaluate the changes of soil structure [9]. Soil thin sections can also be used to study soil com-paction due to forest harvesting. Comcom-paction causes a reduction in total porosity, this reduction not only may associate with altered pore morphology but also the pore size distribution may be changed [10]. Pagliai et al. [11]
in their study confirmed that changes in porosity, pore shape and size distribution following compaction by tractor traffic were reflected in the resulting type of soil microstructure.
The aim of this study was to evaluate the effects of skidding machinery on physical and micromorphological properties of forest soils in northern Iran. Therefore the parameters measured were soil dry bulk density, porosity, soil saturated hydraulic conductivity, type and size of voids and soil aggregates and microstructure at four dif-ferent positions (control or non traffic areas, left wheel track, right wheel track and log track) and two soil depths (0 - 10 and 10 - 20 cm) in three repetitions.
2. Materials and Methods
This research was conducted in summer 2007 in parcel 31 of third district of Nav-Asalem forest, Guilan prov-ince, northern Iran, at the latitude ranging from 1200 to 1300 m above sea level and with average annual precipi-tation of 1024 mm. The area is located between 48˚39'30'' and 48˚44'30'' of longitude, and 37˚37'20'' and 37˚61'12'' of latitude.
The area of the compartment was 68 ha. The wood ex-traction was carried out from stump area to road side landing by a ground-based skidding system in short and long logs. The skidding direction along the skid trail was downslope. The soil classification was Coarse-loamy,
mixed, mesic superactive, Typic Udorthents according to
the USDA Soil Taxonomy classification system [12]. The skidder type used in this study was 450 C Timber
Jack cable skidder, with 130 kW and 10257 kg mass. A skid trail of 869 m length with downslope skidding direction was chosen for the experiments. The samples were collected on slope of 13% with heavy traffic from 4 different positions (control or non traffic areas, left wheel track, right wheel track and log track) and two soil depths (0 - 10 and 10 - 20 cm) in three repetitions, therefore 24 plots with 20 m long by 5 m wide were used for soil physical and micromorphological properties in this study.
Soil physical properties were determined using the standard methods. For micromorphological studies, soil samples were taken by kubiena boxes and were trans-ferred to pedology laboratory. Samples were dried in open air and impregnated with resin. Once the resin was hardened, the blocks were cut to reveal a section through the structure. Soil thin sections were prepared and soil micromorphological properties (type and percentage of voids, soil aggregate and microstructure) were studied with the use of polarizan microscope [13].
Image Tool UTHSCSA 3.0 software was used to de-termine total porosity and pore size distribution [14]. In this case, 10 pictures from each soil thin section at paral-lel light were taken by polarizan microscope. Pictures were transferred to software original screen. From avail-able menus, black and white picture was prepared in which white points are equal to voids and black points are equal to other parts of soil (except voids). Percentage of black and white points was determined by software. Porosity percentage from 10 pictures related to each soil thin section was averaged and introduced as total poros-ity percentage of soil in this sample. It should be men-tioned that measurement of porosity percentage was re-lated to quality of soil thin sections and the picture taken. With respect to microscopic observations that showed high percent of quartz in soil, quartz percentage was computed and was decreased from total porosity, because quartz minerals in parallel light have a picture similar to picture of soil voids.
SAS 9.0 software was used for data analysis and the mean comparisons were determined using Duncan’s mul-tiple range tests.
3. Results and Discussion
Variance analysis showed that soil depths and sample positions and their interaction effects significantly af-fected soil dry bulk density. Average soil dry bulk den-sity in control, right wheel track, left wheel track and log track were 1.28, 1.70, 1.80 and 1.85 g/cm3,respectively.
Comparison of average bulk density showed that there were significant differences between four positions ( Ta-ble 1). Ares et al. [15] showed that bulk density in wheel
Table 1. Average soil dry bulk density, total porosity per-centage and saturated hydraulic conductivity in different positions.
Soil saturated hydraulic conductivity (cm/hr) Total
porosity (%) Soil bulk
density (gr/cm3) Positions
5.08a 48.07a
1.28d Control
2.53b 30.69b
1.70c Right wheel
2.33b 26.68c
1.80b Left wheel
2.12c 24.63d
1.85a Log track
Average soil dry bulk density in log track was more than other positions because of heavy weight of logs ex-erting pressure over soil surface. The results showed that bulk density in left wheel track was higher than right wheel track this can be attributed to lateral slope in skid trail (skid trail had a lateral slope of 2% to the left side). Therefore machinery weight is transferred to left wheel and consequently more pressure is exerted.
Average soil dry bulk density in the first and second depth (0 - 10 and 10 - 20 cm) were 1.69 and 1.63 g/cm3,
respectively. Comparison of average bulk density showed that there was a significant difference between two soil depths (Table 2). Demir et al. [16] in their studies showed
that bulk density at 0 - 5 cm and 5 - 10 cm increased from 0.76 to 0.908 g/cm3 and 0.866 to 0.983 g/cm3,
re-spectively. Kuht et al. [17] and McNabb et al. [7] showed
similar results. Pranagal et al. [18] also showed that bulk
density was greater in the 0 - 10 cm layer than 10 - 20 cm depth for different tillage systems.
Average soil total porosity in control, right wheel track, left wheel track and log track positions were 48.07%, 30.69%, 26.68% and 24.63%, respectively. Comparison of average total porosity percentage revealed that there was a significant variation in 4 positions (Table 1). Total
porosity in the first and second depth (0 - 10 cm, 10 - 20 cm) was 29.98% and 35.06%, respectively. Comparison of average of total porosity showed that there was a sig-nificant difference between the two depths (Table 2).
Demir et al. [16] showed that in forest soil that was
compacted by skidder, porosity at 0 - 5 and 5 - 10 cm depths decreased from 59.09% to 47.42% and 55.71% to 51.12%, respectively. McNabb et al. [7] and Kuht et al.
[17] also showed that porosity due to compaction de-creased significantly.
[image:3.595.359.488.554.701.2]Soil saturated hydraulic conductivity in control, right
Table 2. Average soil dry bulk density, total porosity per-centage and saturated hydraulic conductivity in different depths.
soil saturated hydraulic conductivity (cm/hr) Total
porosity (%) Soil bulk density
(gr/cm3) Depth (cm)
2.79b 29.98b
1.69a 0 - 10
3.24a 35.06a
1.63b 10 - 20
wheel track, left wheel track and log track positions were 5.08, 2.53, 2.33 and 2.12 cm/hr, respectively. Compari-son of average saturated hydraulic conductivity showed that right wheel track and left wheel track positions were not significantly different, but were significantly differ-ent from other two positions (control and log track). Saturated hydraulic conductivity in log track was more than right and left wheel track positions, because highest bulk density and lowest total porosity belong to log track (Table 1). Soil saturated hydraulic conductivity in the
first and second depth is 2.79 and 3.24 cm/hr, respec-tively (Table 2). Soil compaction in forest soil due to
machinery traffic causes total porosity and saturated hy-draulic conductivity to decrease [7,19]. Pagliai et al. [11]
also confirmed that compaction causes hydraulic conduc-tivity to decrease.
The results of total pores percentage of soil samples in thin sections which were determined by Image Tool software, showed that samples compacted by skidder traffic had lower pores compared to control. Total poros-ity in control, right wheel track, left wheel track and log track position were 51.86%, 29.10%, 25.66% and 23.48%, respectively. Comparisons of average test showed that total porosity in different positions were significantly different. Total porosity percentages in first and second depths were 30.21% and 34.84%, respectively Compari-son of average total porosity showed that there was a significant difference between two soil depths. These results are very similar to total porosity results calculated by the use of soil dry bulk density and particle density in this study.
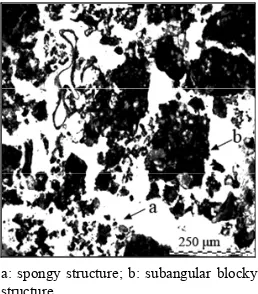
The microscopic study of soil thin sections of control position demonstrated that soil voids occupied majority of the space and aggregates were developed and distin-guishable from each other (Figure 1). The results of
compacted samples showed that total soil porosity sig-nificantly decreased. Pressure of skidder traffic applied to soil caused soil particle to pack closer together and
[image:3.595.56.287.679.729.2]a: spongy structure; b: subangular blocky structure.
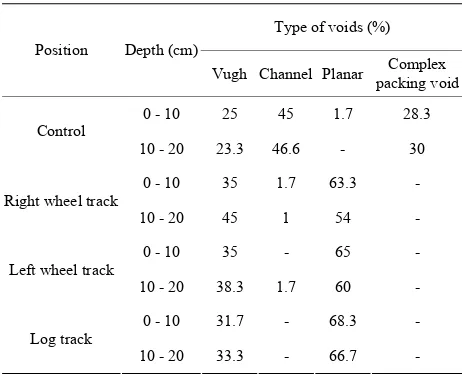
also resulted in breaking of larger aggregates to smaller ones filling voids space. The results showed that voids in control samples were vugh, channel, planar and complex packing void. In compacted samples, there was an in-crease in the number of vughs and channels were in low occurrence (Table 3). Decreased channel voids in
com-pacted samples were due to decrease in soil air and water content which reduced soil porosity, therefore biological activities of soil decreases [20].
Void size was measured by micrometer under polar-ized microscope. Voids size varied from less than 2 μm to more than 10 μm in control samples. In compacted samples, large voids (>10 μm) were low except for sec-ondary planar voids. However in compacted samples percentage of vughs was less than control samples but number of vughs was more than control samples. Pres-sure on soil exerted by heavy weight of machinery com-pressed soil particles and consequently large voids were divided into small voids. Compaction caused a decrease in voids size, so voids size was larger in control samples than compacted samples.
In soil thin section equivalent diameter of nearly spherical voids were divided in to 3 classes; <2, 2 - 10 and >10 μm. In each picture equivalent diameter was determined with Image Tool software and percentage of each class of diameter was computed. In compacted sam-ples, voids having an equivalent diameter of >10 μm were very rare or even not present, voids with <2 μm were very common and voids with 2 - 10 μm were rare.
In compacted samples, voids with equivalent diameter of <2 μm were more than control samples. All the 3 classes were present in control samples. In other words equivalent diameter variety of voids in control samples was more than compacted samples (Table 4). Pagliai et al. [11] showed that after four passes the traffic caused
[image:4.595.309.541.111.278.2]damage to soil structure causing large pores to disappear.
Table 3. Types of voids percentage in different positions.
Type of voids (%) Position Depth (cm)
Vugh Channel Planar packing voidComplex
0 - 10 25 45 1.7 28.3
Control
10 - 20 23.3 46.6 - 30
0 - 10 35 1.7 63.3 -
Right wheel track
10 - 20 45 1 54 -
0 - 10 35 - 65 -
Left wheel track
10 - 20 38.3 1.7 60 -
0 - 10 31.7 - 68.3 -
Log track
10 - 20 33.3 - 66.7 -
Table 4. Equivalent diameter of voids percentage in differ-ent positions.
Equivalent diameter of void (%) Position Depth (cm)
2< (μm) 2 - 10 (μm) 10> (μm)
0 - 10 52.3 32.7 15
Control
10 - 20 54.3 31.7 14
0 - 10 83 16 1
Right wheel track
10 - 20 84.3 15 0.7
0 - 10 84.7 14.7 0.6
Left wheel track
10 - 20 84.7 15.3 -
0 - 10 85.7 14.3 -
Log track
10 - 20 83.3 16.7 -
Presence of aggregate types was studied in soil thin sections. The aggregates in control samples were granu-lar, spongy and sub angular blocky but in compacted samples soil structure were damaged and aggregates were compressed. In control samples aggregates were strongly developed, because of biological activities. In compacted samples there were no aggregates because skidder traffic destroyed the aggregates.
In soil thin sections of control samples microstructure was channel, vugh, granular, spongy and sub angular blocky, but in compacted samples soil matrix was com-pressed and aggregate was not distinguishable, therefore microstructure was massive. Pagliai et al. [11]
demon-strated that compaction transformed the initial subangu-lar blocky microstructure into a massive structure.
4. Conclusions
Average soil dry bulk density in four positions and two soil depths were significantly different. Average soil dry bulk was higher in log track than other positions and left wheel track was higher than right wheel track and also it was higher in the first depth than second depth. Conse-quently this has affected total porosity and saturated hy-draulic conductivity to decrease, this trend of decrease in total porosity and hydraulic conductivity for different positions and soil depth were similar to that of bulk den-sity results.
[image:4.595.56.287.545.732.2]increased and channel voids decreased and also number of small vughs increased. Heavy weight of machinery destroyed granular, spongy and sub angular blocky ag-gregates, so soil structure changed into massive micro-structure.
Results of this research confirmed that skidding ma-chinery had a significant effect on soil physical and morphological properties. These changes causes soil and environmental degradation due to reduction in water in-filtration increasing soil erosion risk. Therefore it is sug-gested that after harvesting operations, ruts created by pulling trees logs, should be filled by herbaceous remains that prevents from deeper and wider ruts which may re-sult in erosion. Also compaction in the left wheel track was higher than right wheel track and this can be attrib-uted to lateral slope in skid trail. Thus machinery weight is transferred to left wheel and consequently more pres-sure is exerted. Therefore in constructing forest roads care should be taken to prevent high lateral slope and in addition roads with high lateral slope should be avoided in harvesting operations
REFERENCES
[1] R. I. McDonald, G. Motzkin, M. S. Bank, D. B. Kittredge, J. Burk and D. R. Foster, “Forest Harvesting and Land- Use Conversion over Two Decades in Massachusetts,” Forest Ecology and Management, Vol. 227, No. 1-2, 2006, pp. 31-41. doi:10.1016/j.foreco.2006.02.006
[2] M. Susnjar, D. Horvat and J. Seselj, “Soil Compaction in Timber Skidding in Winter Conditions,” Croation Jour-nal of Forest Engineering, Vol. 27, No. 1, 2006, pp. 3-15. [3] R. Naghdi, I. Bagheri, M. Lotfalian and B. Setodeh, “Rut-ting and Soil Displacement Caused by 450C Timber Jack Wheeled Skidder (Asalem Forest Northern Iran),” Jour-nal of Forest Science, Vol. 55, No. 4, 2009, pp. 177-183. [4] J. R. Williamson and W. A. Neilsen, “The Influence of
Forest Site on Rate and Extent of Soil Compaction and Profile Disturbance of Skid Trail during Ground-Based Harvesting,” Canadian Journal of Forest Research, Vol. 30, No. 8, 2000, pp. 1196-1205. doi:10.1139/x00-041 [5] R. Naghdi, I. Bagheri and M. Akef, “Soil Compaction
Caused by 450C Timber Jack Wheeled Skidder (She-farood Forest, Northern Iran),” Journal of Forest Science, Vol. 53, No. 7, 2007, pp. 314-319.
[6] A. Najafi, A. Solgi and S. H. Sadeghi, “Soil Disturbance Following Four Wheel Rubber Skidder Logging on the Steep Trail in the North Mountainous Forest of Iran,” Soil and Tillage Research, Vol. 103, No. 1, 2009, pp. 165-169.
doi:10.1016/j.still.2008.10.003
[7] D. H. McNabb, A. D. Startsev and H. Nguyen, “Soil Wet-ness and Traffic Effects on Bulk Density and Air-Filled Porosity of Compacted Boreal Forest Soils,” Soil Science Society of America Journal, Vol. 65, No. 4, 2001, pp. 1238-1247. doi:10.2136/sssaj2001.6541238x
[8] M. Pagliai, S. Pellegrini, N. Vignozzi, S. Rousseva and O. Grasselli, “The Quantification of the Effect of Subsoil Compaction on Soil Porosity and Related Physical Prop-erties under Conventional to Reduced Management Prac-tices,” Advances in GeoEcology, Vol. 32, 2000, pp. 305- 313.
[9] S. Kapur, A. Mermut and G. Stoops, “New Trends in Soil Micromorphology,” Springer, Berlin, 2008.
doi:10.1007/978-3-540-79134-8
[10] P. Boivin, B. Schaffer, E. Temgoua, M. Gratier and G. Steinman, “Assessment of Soil Compaction Using Soil Shrinkage Modeling: Experimental Data and Perspec-tives,” Soil and Tillage Research, Vol. 88, No. 1-2, 2006, pp. 65-79. doi:10.1016/j.still.2005.04.008
[11] M. Pagliai, A. Marsili, P. Servadio, N. Vignozzi and S. Pellegrini, “Changes in Some Physical Properties of a Clay Soil in Central Italy Following the Passage of Rub-ber Tracked and Wheeled Tractors of Medium Power,” Soil and Tillage Research, Vol. 73, No. 1-2, 2003, pp. 119-129. doi:10.1016/S0167-1987(03)00105-3
[12] Soil Survey Staff, “Keys to Soil Taxonomy,” 10th Edition, United States Department of Agriculture, Washington, 2006.
[13] G. Stoops, “Guidelines for Analysis and Description of Soil and Regolith Thin Sections,” SSSA, Madison, 2003. [14] D. Wilcox, B. Dove, D. McDavid and D. Greer, “UTH-
SCSA Image Tool for Windows Version 3.0,” The Uni-versity of Texas Health Science Center, San Antonio, 2002.
[15] A. Ares, T. A. Terry, R. E. Miller, H. W. Anderson and B. L. Flaming, “Ground-Based Forest Harvesting Effects on Soil Physical Properties and Douglas-Fir Growth,” Soil Science Society of America Journal, Vol. 69, No. 6, 2005, pp. 1822-1832. doi:10.2136/sssaj2004.0331
[16] M. Demir, E. Makineci and E. Yilmaz, “Investigation of Timber Harvesting Impacts on Herbaceous Forest and Surface Soil Properties on Skid Road in an Oak (Quercus Petrea L.) Stand,” Building and Environment, Vol. 42, No. 3, 2007, pp. 1194-1199.
doi:10.1016/j.buildenv.2005.11.008
[17] J. Kuht and E. Reintam, “Soil Compaction Effect on Soil Physical Properties and the Content of Nutrients in Spring Barley (Hordeum Vulgare L.) and Spring Wheat (Triti-cum Aestivum L.O.),” Agronomy Research, Vol. 35, 2004, pp. 3149-3158.
[18] J. Pranagal, J. Lipiec and H. Domzal, “Changes in Pore Distribution and Stability of Two Soils under Long Term Tillage Systems,” International Agrophysics, Vol. 19, 2005, pp. 165-174.
[19] S. Zhang, H. Grip and L. Lovdahl, “Effect of Soil Com-paction on Hydraulic Properties of Two Loess Soils in China,” Soil and Tillage Research, Vol. 90, No. 1-2, 2006, pp. 117-125. doi:10.1016/j.still.2005.08.012