7,8-Dihydroneopterin and its effect
on the formation of foam cells.
A thesis submitted in partial fulfilment of the
requirements for the degree of Master of Science in
Biochemistry at the University of Canterbury, New
Zealand.
School of Biological Sciences
University of Canterbury
ii
Contents
Figures.………..………..…iii
Abbreviations………..………..………..………v
Abstract……….……….vii
1 Introduction……….………..…1
1.1 Overview……….………..……1
1.2 Atherosclerosis………..………...2
1.3 CD36………….……….…………...………...…7
1.4 Antioxidants………..………..…………...………10
1.5 Action of 7,8-Dihydroneopterin………..………...………11
1.6 Aim of Research……….………13
2 Materials and Methods……….…..………...……14
2.1 Materials………….………14
2.1.1 Reagents………..………..14
2.1.2 Antibodies……….………...………..…15
2.1.3 Media, Buffers and General Solutions………...…………15
2.2 Methods………….………17
2.2.1 Preparation of Human monocyte derived macrophages (HMDMs)…...17
2.2.2 U937 culturing………...………17
2.2.3 Human Serum...……….………18
2.2.4 HPLC analysis of Cholesterol, Cholesteryl esters and 7-ketocholesterol...18
2.2.5 Plasma and LDL preparation……….…20
2.2.6 MTT cell viability assay………21
2.2.7 Protein determination assay, BCA. ……...………...………21
2.2.8 Flow cytometer analysis of CD36 cell surface expression…...…….………22
2.2.9 Statistical Analysis………...…….……23
3 Results…….………….………24
3.1 Standardisation of the cholesteryl ester analysis method..……… ………24
3.2 Determining amount of cells required for analysis…...………….………29
3.3 Effect of the human serum on cholesteryl ester uptake………..………31
3.4 Cholesteryl ester accumulation………...…………32
3.5 Measurement of cellular sterols………..………34
3.6 Foam cell formation………....………41
3.7 CD36 cell surface expression method development………...……50
iii
4 Discussion…....………71
4.1 The role of cholesterol and cholesteryl ester accumulation in foam cell formation……….………71
4.2 Cholesteryl ester method development………..……….72
4.3 7-Ketocholesterol method development for sterol measurement…………....…73
4.4 Foam cell formation measured by cholesteryl ester and 7-KC methods…… …74
4.5 Accutase effect on CD36 cell surface expression……….. …………75
4.6 7,8-Dihydroneopterin effect on CD36 cell surface expression………...………78
4.7 7,8-Dihydroneopterin effect on foam cell formation…...…………...…………79
4.8 Future Research and Summary………...………81
5 Bibliography…..………...………83
6 Acknowledgments………...………89
Figures
………..……….Page Image 1. Macrophage and LDL migration to the site of the inflammation………... 3Image 2. Free radical peroxidation of lipids……….. 4
Image 3. Macrophage cell morphology before being treated……… 6
Image 4. The main structural features of human CD36………. 7
Figure 1. Chromatogram of commercial standards of cholesterol and cholesteryl esters….. 25
Figure 2. Chromatogram of extracted LDL with cholesterol and cholesteryl esters identified………... 26
Figure 3. Chromatogram of copper oxidised LDL with cholesterol and cholesteryl esters identified………. 27
Figure 4. Chromatogram of RPMI 1640 and 10% human serum with cholesterol and cholesteryl esters identified……… 28
Figure 5. Changes in sterol content during LDL oxidation……… 29
Figure 6. Pooling wells of cells to obtain HPLC signal. 1 well vs. 2 wells vs. 3 wells…… 31
Figure 7. Cholesterol and ester uptake in cells treated with different concentrations of human serum……….. 32
Figure 8. MTT assay of cells treated with oxLDL for 48 hours………. 33
Figure 9. Cholesterol and cholesteryl ester accumulation in cells treated with 1.0mg/ml oxLDL for 48 hours……… 34
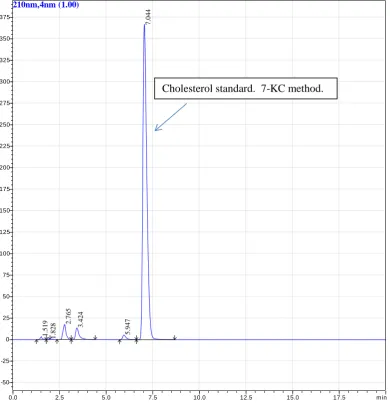
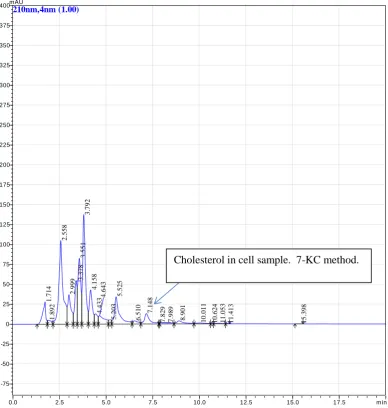
iv Figure 11. Commercial cholesterol standard processed using 7KC method……….. 37 Figure 12. Cell sample analysed using 7KC method………. 38 Figure 13. Commercial 7-ketocholesterol standards analysed by HPLC using 7KC
method……… 39
Figure 14. Cell sample from 0 hour control extracted and prepared using the 7KC
hydrolysis method……….. 40
Figure 15. Comparison of cholesterol concentration measured by HPLC using the
cholesteryl ester method vs. the 7KC method……… 41 Figure 16. Morphological differences between foam cells and macrophages after 48 hour
incubation………... 42
Figure 17. Cholesterol accumulation in macrophages treated with 1mg/ml oxLDL for 48
hours………... 44
Figure 18. Cholesteryl arachidonate accumulation in macrophages incubated with 1.0
mg/ml oxLDL for 48 hours……… 45
Figure 19. Cholesteryl linoleate accumulation in macrophages treated with 1.0mg/ml
oxLDL for 48 hours……… 46
Figure 20. Cholesteryl oleate accumulation in macrophages incubated with 1.0mg/ml
oxLDL for 48 hours……… 47
Figure 21. Cholesteryl palmitate accumulation in macrophages incubated with 1.0mg/ml
oxLDL for 48 hours……… 48
Figure 22. 7-Ketocholesterol accumulation in macrophages incubated with 1.0mg/ml
oxLDL for 48 hours……… 49
Figure 23. Macrophages treated with the antibody CD16, a macrophage phenotypic
marker………. 50
Figure 24. Flow cytometer traces for titration of CD36 antibody concentrations on U937
cells………. 52
Figure 25. CD36 primary antibody concentration titration using the U937 cell line………. 53 Figure 26. Flow cytometer traces for anti-CD36 concentration titration on macrophages… 54 Figure 27. Titration of anti CD36 primary antibody concentrations on macrophages……... 55 Figure 28. CD36 expression on monocytes treated with accutase™ vs. no accutase™…… 56 Figure 29. CD36 expression on U937 cells treated with accutase™ vs. RPMI 1640……… 57 Figure 30. Incubation of macrophages with accutase™ or RPMI 1640 and p/s for 3, 5, 10
or 15 minutes……….. 58
Figure 31. Flow cytometer traces for treatment of macrophages with cold PBS washes
before accutase™ for differing time periods……….. 59
v treatment with accutase™………..
Figure 33. Suspension macrophages and adherent macrophages treated with oxLDL for
48 hours……….. 62
Figure 34. CD36 expression on suspension macrophages’ cell surface when treated with
7,8-NP for 48 hours………... 63
Figure 35. Flow cytometer traces of suspension macrophages treated with 7,8-NP or
oxLDL for 48 hours……… 64
Figure 36. CD36 expression of suspension macrophage cells treated with 7,8-NP or
oxLDL for 48 hours……….... 66
Figure 37. 7-Ketocholesterol uptake in macrophages treated with 1.0mg/ml oxLDL for 48
hours………... 68
Figure 38. Time course of macrophages treated with oxLDL or oxLDL + 7,8-NP……….. 70
Abbreviations
7,8-NP 7,8-Dihydroneopterin
7KC 7-ketocholesterol
ɣ-IFN Gamma interferon
ABC-A1/G1 ATP-binding cassette
AGE Advanced glycated products
Apo-A1 Apolipoprotein-A1
BCA Bicinchoninic acid
BHT Butylated hydroxytoluene
c-DNA Complementary deoxyribose nucleic acid
CuCl2 Copper chloride
EDTA Ethylene diamine tetracetic acid
FAK Focal Adhesion Kinase
FFA Free fatty acids
GMSCF Granulocyte and monocyte colony-stimulating factor
GSH Glutathione
GSSG Glutathione disulphide
H2O2 Hydrogen peroxide
vi
HMDM Human monocyte derived macrophage
HOCl Hypochlorous acid
HPLC High pressure liquid chromatography
KOH Potassium hydroxide
LDL Low density lipoprotein
MAP kinase Mitogen-activated protein kinase
MCP-1 Monocyte chemotactic protein-1
MeOH Methanol
MFI Mean fluorescence intensity
MIF Migration Inhibitory Factor
MPO Myeloperoxidase
NADPH Nicotinamide adenine dinucleotide phosphate
NaOH Sodium hydroxide
NOX NADPH oxidase
O2-. Superoxide radical
oxLDL Oxidised low density lipoprotein
PBS Phosphate buffer saline
PMA Phorbol 12-myristate 13-acetate
PPAR-ɣ Peroxisome proliferator-activated receptor-ɣ
p/s Penicillin/streptomycin
ROS Reactive oxygen species
RPMI Roswell Park Memorial Institute
SDS Sodium Dodecyl sulfate
TAG Triacylglycerides
vii
Abstract
Atherosclerosis (Heart Disease) is an inflammatory disease caused by the formation of
plaque within the arterial wall. In response to inflammation, monocytes enter the artery
wall, differentiate into macrophages and take up altered low-density-lipoprotein (such
as oxidised-LDL). This oxLDL is taken up into the phagocytotic macrophages via the
action of the scavenger receptors. If more oxLDL is engulfed than the cell can process,
they further differentiate into lipid-loaded foam cells. These are the main cell type
found in atherosclerotic plaques. The scavenger receptor CD36 is responsible for 70%
of oxLDL uptake by macrophages. Previous studies show that CD36 expression can be
down regulated by the antioxidant, 7,8-dihydroneopterin. This research focuses on the
effect of CD36 down regulation by 7,8-dihydroneopterin on foam cell formation.
Human macrophages prepared from monocytes purified from human blood were
incubated with copper oxidised LDL for up to 48 hours. Macrophage accumulation of
the sterols was measured using a high performance chromatograph (HPLC) method
developed as part of this project. The HPLC analysis measured: cholesterol,
cholesteryl-oleate and -palmitate and 7-ketocholesterol accumulation within human
macrophages. A flow cytometry procedure was developed where the strongly adherent
macrophages could be lifted from the tissue culture plates before immuno staining for
CD36. Effect of incubating macrophages with 7,8-dihydroneopterin on the formation of
foam cells was studied by measuring the lipid content by HPLC and flow cytometry
measurement of CD36.
HPLC analysis showed non-cytotoxic levels of oxLDL produced a large accumulation
of cholesterol and cholesteryl esters in the macrophages. Cholesterol, 7-ketocholesterol
and cholesteryl-oleate and -palmitate concentrations in the cells rose significantly over
the first 24 hours and stayed at a steady level for the following 24 hours. CD36 levels
was further analysed on human macrophages. This study shows that foam cell
formation can be measured using human macrophages. 7,8-Dihydroneopterin treatment
resulted in a reduction of cholesterol and oxysterol uptake back to basal levels. It also
reduced CD36 cell surface expression by a third. These results suggest that even a
small reduction in CD36 cell surface expression may have a large effect on foam cell
formation. This is another mechanism by which 7,8-dihydroneopterin protects against
1
Introduction
1.1
Overview
Though a huge amount of international effort has gone into researching the mechanism
of atherosclerosis and general vascular disease, the actual mechanism driving the
collection and growth within the artery wall proven to be difficult to define.
Atherosclerosis is characterised by the collection of immune cells, mainly macrophages
between the layers of the artery wall. With time this atherosclerotic plaque becomes a
distinct growth which pushes the artery wall out into the flow of blood. This occlusion
of the artery restricts the flow of blood generating many of the symptoms of vascular
disease. Rupture of the plaque causes blood clots to enter the blood stream resulting in
a heart attack or stroke. As atherosclerotic plaques take decades to develop, unravelling
the underlying cause of the disease is analogous to turning up late at a brawl, tasked
with investigating the reason for the disturbance. The order of events leading up to the
first punch being thrown is crucial but just like in a street fight, the nuances of the initial
interactions are complicated, subtle and difficult to determine.
The early stages of the disease cause changes in the cells which have been difficult to
detect in vivo. These stages involve monocytes accumulating at the site of
inflammation and differentiating into macrophages. Macrophages take up oxidised low
density lipoprotein (oxLDL) via the CD36 scavenger receptor. Binding of oxLDL to
CD36 results in interactions which allow the cell to uncontrollably accumulate
cholesterol esters. This accumulation transforms the macrophages into foam cells.
Foam cells amass between the intima and media of the artery wall and start to degrade
via apoptosis and necrosis, forming a necrotic core. This necrotic core that develops
between these sections of artery wall is the beginning of the atherosclerotic plaque that
results in heart disease which is common in a third of the western world (Roger et al.
2012).
The research presented in this thesis examines the possibility of blocking the
macrophage uptake of oxLDL with a specific macrophage antioxidant to prevent foam
cell formation. The aim is by studying the interactions of the protein expression of
scavenger receptor CD36 and its relation to ester uptake, a more complete
2
produce an antioxidant to protect themselves from the inflammatory environment that
leads to foam cell formation. 7,8-Dihydroneopterin (7,8-NP) is a pterin found to
scavenge free radicals (Baird et al. 2005; Oettl et al. 1997; Gieseg et al. 2001; Gieseg et al.
1995). Previous studies in this laboratory showed 7,8-dihydroneopterin down regulates
the expression of CD36 in monocyte derived macrophages (HMDM) (Shchepetkina
2013). This was shown to decrease oxLDL uptake using 7-ketocholesterol as a marker
of oxLDL uptake. It did not demonstrate whether the down regulation prevented foam
cell formation as defined by Kritharides (L. Kritharides et al. 1993). This thesis
specifically investigates the effects of 7,8-dihydroneopterin on CD36 cell surface
expression and the effect CD36 down regulation has on cholesterol accumulation within
macrophages. The addition of 7,8-dihydroneopterin to macrophages is postulated to
prevent foam cell formation. It is hypothesised that this mechanism occurs in vivo and
it is the failure of this mechanism that may lead to the development of atherosclerosis.
1.2
Atherosclerosis
Atherosclerosis is an inflammatory disease of the artery wall (Libby 2002). It involves
chronic inflammatory responses without the benefit of the system fully returning to
homeostasis. At bifurcations of the artery and other areas of turbulent blood movement,
the wall of the artery is susceptible to inflammatory damage. This results in the tissue
sending out chemo-attractants. These chemokines result in the recruitment of
monocytes and other inflammatory cells (T-lymphocytes) to the area.
When monocytes are present a range of chemicals such as GMCSF (Granulocyte and
Monocyte colony-stimulating factor) induce differentiation into Macrophages (Libby
2002). Macrophages are crucial in the healing of the artery intima as they are involved
both in the reparation and remodelling of the tissue after the inflammatory episode
(Gordon and Taylor 2005), as well as clearing debris from the area. Macrophages have
been identified in atherosclerotic plaques in all stages of plaque development.
Monocyte differentiated macrophages are therefore involved in atherosclerosis from the
initiation of the disease (Saha et al. 2009; Fenyo and Gafencu 2013). Clearing debris from
an area of infection or inflammation is a necessary and healthy process however
exposure of the cell to oxidised low density lipoprotein (oxLDL) alters the normal
cellular response.
During the inflammatory process, the scavenger receptor CD36 recognises and binds
3
particles that have been oxidised. It is not conclusively known where the oxidants
come from that oxidise LDL. Oxidation of LDL at the site of inflammation (inside the
artery wall) can occur via any of the cell types found in the artery wall, as well as
through reactions involving free radicals and Reactive Oxygen Species (ROS).
Image 1. Macrophage and LDL migration to the site of the inflammation. Once in the
intima of the artery wall, the LDL is oxidised. OxLDL is internalised by the macrophage and the cell is transformed into a foam cell. Scavenger Receptor A is also depicted as SR and the Endothelial cells (EC) that are the barrier between the intima and artery interior are also present. Image adapted from Febbraio. (Febbraio, Hajjar, and Silverstein 2001)
Cells can oxidise LDL primarily through the over activation of NADPH oxidase
(NOX). NOX is found in every cell type and is an enzyme that catalyses the electron
transfer from NADPH to oxygen to form superoxide (O2-.) (Lugrin et al. 2014).
Superoxide either then reacts with superoxide dismutase or spontaneously forms H2O2
(Maxwell and Lip 2003). The reaction to hydrogen peroxide is very fast (Kerr, Bender, and
Monti 1996). Hydrogen peroxide is turned into HOCl in order to break down foreign
materials such as bacteria (Aviram 1992; Podrez et al. 1999).
Another source of LDL oxidation is free radicals. Free radicals are molecules with
unpaired electrons, such as superoxide (O2-.), which is also a ROS. It stabilises itself by
removing electrons from surrounding molecules such as the proteins and lipids that
4
from electron transport chains (Dean et al. 1997). Another source of free radical
formation is when free copper or iron ions react with hydrogen peroxide to form
hydroxyl radicals (OH.).
Lipids and proteins then react with the hydroxyl radical (image 2, equation1), via a
carbon centred radical. Carbon centred radicals then rearrange to form conjugated
dienes which react with oxygen to form peroxyl radicals, producing a lipid or protein
hydroperoxyl radical through electron transfer (image 2, equation 2) (Kerr, Bender, and
Monti 1996; Maxwell and Lip 2003). Lipid hydroperoxyls are unstable and degrade to
secondary products such as cytotoxic alkanes and aldehydes.
Image 2 Free radical peroxidation of lipids. The process by which lipids and proteins can be
altered into species such as oxLDL. Adapted from Dotan. (Dotan, Lichtenberg, and Pinchuk 2004)
Lipids are chemically structured in a manner that makes them vulnerable to
peroxidation via their bis-allylic methylene groups (Maxwell and Lip 2003). Branching
reactions then occur which result in other radical species being formed. Radicals
interfere with normal cellular processes which result in the breakdown of cellular
membranes, DNA and enzymatic processes. When radicals damage proteins, the result
is often aggregation or degradation of the protein and loss of function. If LDL in the
artery’s intima is oxidised, the oxLDL binds to scavenger receptors on human
monocyte derived macrophages (HMDMs).
Scavenger receptors are receptors that recognise altered LDL such as Scavenger
Receptor A (SR-A) and CD36. SR-A is asserted to be responsible for the majority of
5
oxLDL uptake, but they are not specific. Recognition of lipid moieties on the oxLDL
has been attributed to the reaction between oxLDL and CD36 (Nicholson and Hajjar
2004). Recognition induces a rapid and uncontrolled uptake of cholesterol esters in
concert with an up-regulation of cell surface CD36 receptor (Viana et al. 2005). Under
other circumstances, the contents of an LDL particle are endocytosed through clatherin
pits.
Cholesterol esters, free cholesterol, free fatty acids or triacylglycerides are transported
into the cell as part of the LDL particle. LDL receptors are found on the surface of all
cells but in highest quantities on the liver indicating that its main purpose is to deliver to
the liver cholesterol and free fatty acids. When the peripheral cells’ needs are met, the
cholesterol gets returned to the liver. ABC-A1/G1 receptors work in concert with pre
β-HDL (nascent) and lipid rich HDL to export cholesterol (Tiwari, Singh, and Barthwal
2008).
Failure of this process results in the cell developing an enlarged and foamy-looking
morphology (Greig, Kennedy, and Spickett 2012)(Kruth, H.S. (2001). Such foam cells lose
their motility as there is an increase in the expression of the cytokine: Migration
Inhibitory Factor (MIF). Grieg et al discovered that the absence of this gene in mice
models results in a reduction in atherosclerosis. Conclusions drawn from this data
suggest lack of motility exacerbates the condition. Macrophages in the
pro-inflammatory M1 state also produce increased levels of monocyte chemotactic
protein-1 (MCP-protein-1). MCP-protein-1 attracts monocytes to the area which ultimately leads to further
formation of foam cells (Greig, Kennedy, and Spickett 2012). These cells eventually
become apoptotic or necrotic.
As part of the cellular cascade to the area, cytokines summon T-cells which in turn
cause smooth muscle cells to migrate towards the site of inflammation. The influx of
cells and retardation of normal function combined with the increase in cell mortality
results in a necrotic lipid core. The lipid core develops into plaque which is always
6
Image 3 Macrophage cell morphology before being treated. As can be seen there is a puffy,
annulus morphology. The cells are healthy and in a cobblestone formation with no blebbing. Cells prepared by S. Davies 2014.
The formation of foam cells is commonly known as one of the crucial preliminary steps
of heart disease (Cookson 1971; Yu et al. 2013). Foam cells develop as an overstimulated
response to abnormal physiological actions (Image 3). It was postulated by several
scientists such as F. Cookson and M. Mitchinson in the 70s and early 80s that this was a
morphological change that the macrophage cells went through. Morphological changes
take place which affects the cell’s responses to altered LDL. During an inflammatory
response, the monocyte differentiated macrophage cell is exposed to oxLDL.
Phagocytotic macrophages take up cholesteryl esters, cholesterol, FFA, TAGs and
oxysterols from the oxLDL particle.
Within the intima of the artery wall, the monocytes express lipoprotein-binding
proteoglycans which increases the accumulation of altered LDL such as oxLDL (Legein
et al. 2013). Transformation into foams cells is complete when uptake exceeds the
cholesterol efflux. This results in a release of cytokines that conscript other monocytes
in a continuous cycle. Despite scavenger receptors such as CD36 being responsible for
60% of oxLDL binding and cholesteryl ester uptake (Febbraio, Hajjar, and Silverstein
2001), some macrophages become foam cells without the presence of scavenger
7
scavenger receptor activity or pinocytosis as being a part of this disease process (Legein
et al. 2013).
1.3
CD36
CD36 is a Class B scavenger receptor. It was originally discovered as binding to
thrombospondin-1, a critical factor in clotting development (Febbraio, Hajjar, and
Silverstein 2001). It has since been implicated in recognition of anionic phospholipids,
apoptotic cells, fatty acid binding, collagen, Plasmodium falciparum malaria-parasitized
erythrocytes, as well as altered LDL. During the differentiation from monocytes to
macrophages, the CD36 cell surface expression increases (Alessio et al. 1996) and unlike
LDL receptors, CD36 is up-regulated when exposed to oxLDL. Isolation of the protein
is complicated as it is a transmembrane glycoprotein found on macrophages, microglia,
microvascular endothelium, cardiac and skeletal muscle, adipocytes and platelets
(Zamora et al. 2012).
Image 4. The main structural features of human CD36. Identified are the intracellular, short
8
It is a hairpin shaped protein with two intramembrane domains that anchor on the
cytosolic side and a long extracellular loop where the active site for CD36 is found
(Image 4).
The gene for CD36 is found on chromosome 7 (Collot-Teixeira et al. 2007) and results in
an 88 kDa, ditopically configured protein with multiple N-linked glycosylation sites.
There are approximately 10 sites, as estimated from cDNA, along with multiple
functional domains (image 4). Its ditopic nature allows polar and non-polar aspects of
ligands to be accommodated within a single binding site. Due to the multiple N-linked
glycosylation products, the receptor exhibits different molecular masses which
correspond to different glycoforms in different cell types.
Alessio identified the THP-1 and U937 cells’ ability to intracellularly process CD36
resulting in diverse differentiation. When treated with PMA, two monocyte-like cell
lines were induced into morphological changes that mimicked differentiation into
macrophages. During differentiation, western blotting revealed the appearance of a 74
kDa band that differed to the mature CD36 band at 94 kDa. Corresponding with the 74
kDa band decreasing after 6 hours, the intensity of the 94 kDa band increased,
becoming a broad band of 90-105 kDa. The width of this band could be attributed to
the different levels of glycosylation (Libby 2002; Gieseg et al. 2010). This concurs with
work done by Huh and Yesner in 1996 who found that a moderate two times increase in
surface expression of CD36 during differentiation resulted in a marked uptake of
neutral lipid (Huh et al. 1996).
The intracellular N-terminal domain of the receptor is short and thought to be functional
as an anchor, however the C-terminal domain is longer and has a CXCX5K motif
known to be involved in signalling. The discovery of this motif prompted signalling
studies which revealed that CD36-oxLDL interaction induced a signalling cascade
crucial in the reduction of cell motility and oxLDL uptake (Silverstein et al. 2010). The
oxLDL binding site is found in the domain between amino acids 155 to 183 and shares
its binding domain with advanced glycated products (AGEs), apoptotic cells,
thrombospondin, long chain fatty acids, Plasmodium falciparum, and collagen
(Collot-Teixeira et al. 2007; Febbraio, Hajjar, and Silverstein 2001).
The reduction in cellular motility is not only attributed to cytokine release, but also
CD36. CD36 signalling results in the increase in actin polymerisation and the oxidation
of the tyrosine phosphatase responsible for stopping the polymerisation through Focal
9
activity and the loss of cell motility. In addition when CD36 is exposed to oxLDL, the
protrusive lamellipodia that normally extend for motility retract by activating the kinase
Vav. Vav activates Rac which inhibits phosphorylation of non-muscle myosin II.
Therefore there is no tension on lamellipodia. This inhibits both random migration and
chemotaxis through loss of cell polarity (Park et al. 2012).
The existence of this signalling pathway is beneficial when considering the other
binding site ligands. As well as apoptotic cells the amino acid 155-183 binding site
binds Plasmodium falciparum, AGEs and oxLDL (Martin et al. 2011). Plasmodium
falciparum is the most lethal of the species of parasites that cause malaria (Gardner et al.
2002). AGEs are glycated proteins or lipids that form links between the extracellular
matrix molecules which result in complications in the micro- and macro-vasculature.
Therefore it is beneficial to remove them from a biological system. They also may
form reactive oxygen species (ROS) and induce scavenger receptor A and CD36
expression through gene expression (Goldin et al. 2006). The apparent purpose of this
receptor is removal of harmful products from the system. Consequently, it is deduced
that the signalling cascade that prevents motility is due to the need for internalisation
and degradation, either within the cell or of the cell that has engulfed the harmful
ligand.
A complication arises when a ligand is oxLDL. OxLDL is taken up through CD36
which causes uncontrollable cholesteryl ester accumulation. When oxLDL attempts to
bind to CD36, unusually HDL and oxHDL are sometimes already bound. HDL usually
selectively binds to SRBI in the process of delivering cholesterol and free fatty acids to
the liver during Reverse Cholesterol Transport. The role of SRB1 is to uptake
cholesterol esters and free cholesterol from HDL and LDL particles. It then binds to
receptors on the liver and its contents are recycled (Rhainds and Brissette 2004). SRBI,
like CD36, is a scavenger receptor in Class B and this may contribute some idea as to
why HDL would bind to CD36. HDL binding to CD36 does not contribute to
atherosclerotic plaque development. Despite CD36 binding HDL, it is not taken up into
the cell and consequently is poor at eliciting cholesterol esters. Plaque formation is
prevented because this HDL binding limits the amount of CD36 receptors available for
oxLDL binding without increasing the ester uptake (Thorne et al. 2007). In parallel, there
is a decrease in the ability of HDL to stimulate the efflux of cholesterol (Nagano, Arai,
and Kita 1991). Nagano et al attribute the degradation of ApoA1 due to oxidation. This
10
fatty acids from the foam cells in the environment in which the LDL was oxidised
(Nagano, Arai, and Kita 1991).
A further complication is that free radicals are not specific about what they oxidise thus
HDL will become oxidised to oxHDL. CD36 can also bind oxHDL. This is sufficient
to enable cholesterol ester uptake to occur in the cell (Thorne et al. 2007). Despite the
conflicting and sometimes negative outcomes of HDL in the system, Nicholson and
Hajjar have shown that by stimulating MAP kinase and PPARɣ, HDL down-regulates
CD36 expression in a dose-dependent manner. HDL increased the translocation of the
PPARɣ from the cytoplasm to the nucleus as well as the PPARɣ phosphorylation by
MAP kinase which inhibited CD36 gene expression (Nicholson and Hajjar 2004). HDL
has many ways of decreasing foam cell formation, but currently the uncontrolled uptake
of cholesteryl esters from oxLDL are overwhelming and results in a pro-atherogenic
cell system. The normally efficient process of LDL uptake and HDL efflux is distorted
due to exposure to free radicals.
1.4
Antioxidants
Antioxidants are compounds whose rate of reaction with free radicals is higher than a
biological compounds rate of reaction with a free radical. It effectively neutralises the
free radical because the resulting species isn’t as reactive as a free radical, and so the
damage is slowed. In this way antioxidants ameliorate the effect that is had on the
macrophages by interfering with the free radical reaction and preventing peroxidation
(Dotan, Lichtenberg, and Pinchuk 2004). The antioxidants of main interest are those that
are commonly found in the diet or that are produced by cells, such as ascorbic acid
(Vitamin C), alpha tocopherol (Vitamin E), 7,8-dihydroneopterin (7,8-NP) and
glutathione (GSH). These compounds can be oxidised instead of the lipids or proteins
that make up the LDL particle and often maintain their reduced form by reacting with
glutathione.
When glutathione is oxidised to glutathione disulphide (GSSG), it has donated an H+ or
an e- to an unstable compound such as a free radical or an oxidised antioxidant. GSSG
then reacts with NADPH and glutathione reductase to re-protonate the GSSG and
reform GSH. An antioxidant system can be overwhelmed by free radicals (Morris et al.
2013). This occurs when the cell binds oxLDL and superoxide is generated (Gieseg et al.
2010). As a previous student in this lab has shown, the oxidative stress caused by
11
other antioxidants in the system can relieve the oxidation burden for GSH and allow the
protein levels to recover by affecting different pathways in the cell as well as mopping
up the free radicals.
Though antioxidant activity is normally associated with radical scavenging, some have
direct effects on specific gene expression. Alpha-tocopherol down regulates
macrophage CD36 levels when it has been first upregulated by oxLDL via inhibition of
tyrosine kinase phosphorylation so foam cell formation is diminished (Özer et al. 2006;
Venugopal 2004). Ascorbic acid reduces the binding and uptake of when it is oxidised in
the presence of ascorbic acid. This has been attributed to the antioxidant’s ability to
protect against protein oxidation (Aldred and Griffiths 2004). The macrophage
antioxidant 7,8-dihydroneopterin not only prevents oxLDL formation but also decreases
its uptake in macrophages by CD36 down regulation.
1.5
Action of 7,8-Dihydroneopterin
Human monocytes and macrophages produce the pterin, 7,8-dihydroneopterin, when
stimulated by interferon-ɣ (IFN-ɣ). IFN-ɣ is released by activated T lymphocytes.
GTP cyclohydrolase I is stimulated by IFN-ɣ which results in the production of
7,8-dihydroneopterin in monocytes and macrophages from guanosine triphosphate (GTP)
(Sugioka et al. 2010). 7,8-NP is secreted out of the cell and scavenges free radicals
which have been released by the cell (Berdowska and Zwirska-Korczala 2001). 7,8-NP is
oxidised to neopterin when reacting with free radicals thus neopterin levels can be an
indication of oxidants in the environment. Though 7,8-NP is a measure of
inflammation currently there is no way to tell from which part of the body the 7,8-NP to
neopterin release is occurring.
Because neopterin is an oxidative product of 7,8-dihydroneopterin and highly
fluorescent it is a good marker of inflammation. This is true of all types of
inflammatory diseases however in the case of atherosclerosis, studies have been done
that correlate neopterin rise in plasma to atherosclerosis development. While neopterin
levels are raised in patients with unstable angina pectoris, there is also a correlation
between enhanced neopterin levels and the plaque instability that leads to unstable
angina pectoris (Adachi et al. 2007). As the atherosclerotic burden develops towards
plaque rupture, the plasma neopterin levels rise (Schumacher et al. 1997). Research done
by this laboratory analysed plasma from patients with cardio heart disease undergoing
12
showed that the average 7,8-dihydroneopterin concentration was 55.59nM and the
neopterin concentration was 14.37nM. This was significantly higher than the healthy
donors whose plasma revealed neopterin concentrations of 6.83nM and
7,8-dihydroneopterin concentrations of 17.78nM (Genet 2010). This confirmed the ability of
pterins to be used as indicators of high inflammatory stress with in the body, and as
indicators of atherosclerosis.
In patients suffering from acute inflammation, pus samples were taken from the site of
inflammation and total neopterin was measured as an indicator for inflammation
directly from the source, rather than diluted in the serum. This produced an average of
0.54µM neopterin concentration for females and 0.45µM for males (Firth, Laing, et al.
2008). This is much higher than the nM concentrations seen in serum. The presence of
neopterin due to inflammatory diseases other than atherosclerosis causes pause when
stating that pterins can be used as an atherosclerosis marker. 7,8-dihydroneopterin is a
potent inhibitor of oxLDL formation at low uM concentration through the scavenging
of the lipid peroxyl radical (Gieseg et al. 1995). 7,8-dihydroneopterin also scavenges
hydroxyl and water soluble peroxyl radicals generated with azo compound AAPH
(Firth, Laing, et al. 2008; Gieseg et al. 1995). This scavenging has been shown to protect
monocyte like and macrophage cells from a range of oxidants. This protection occurs
by 7,8-NP not only reacting with the chain propagating lipid peroxyl radical on the
oxLDL but also by interfering with cell mediated oxidation (Firth, Crone, et al. 2008;
Gieseg et al. 2010). Oxidative loss of 7,8-NP occurs when macrophages and LDL (with
protein hydroperoxides) are both present or due to reaction with hypochlorous acid
released during the MPO reaction (Firth, Crone, et al. 2008; Widner et al. 2000). This
protection is observed by a loss of 7,NP as it is oxidised to neopterin and 7,
8-dihydroxanthopterin (Gieseg et al. 2010; Firth, Crone, et al. 2008).
Surprisingly, 7,8-dihydroneopterin was found to reduced oxLDL uptake via the down
regulation of CD36 (Gieseg et al. 2010). The decrease in oxLDL uptake was initially
measured via DiI staining but was later confirmed to be occurring by measuring
7-ketocholesterol uptake. The CD36 down regulation by 7,8-NP was specifically of the
100kDa, cell membrane glycoform of CD36 where there was a 40% reduction after 24
hours (Shchepetkina 2013). RT-PCR studies showed that the down regulation was
occurring at the mRNA expression of CD36. 200mM 7,8-NP caused a 40% decrease in
CD36’s mRNA expression. The CD36 down regulation failed to protect the cells from
13
examine the effect on foam cell formation at a non-toxic level of oxLDL (Shchepetkina
2013).
1.6
Aims of Research
As CD36 is thought to be the main scavenger receptor for oxidised low density
lipoprotein uptake, and as 7,8-dihydroneopterin is able to reduce CD36 receptor levels,
then the uptake of oxLDL lipids may be retarded by the action of 7,8-dihydroneopterin.
This information was central to answering the question “Does 7,8-dihydroneopterin
down-regulate foam cell formation?”
This thesis therefore aimed to study the formation of foam cells and to try to more
accurately define their formation. However, the assay commonly used to determine the
success of foam cell formation was flawed as the human cells recorded false positives
due to their natural high triacylglyceride levels in tissue culture. Lipid dyes, such as Oil
red O when used in conjunction with light microscopy, were used to determine foam
cell formation but fluorescence is observed when the vacuoles contained TAGS and
lipids. An increase in fluorescence was assumed to correspond to an increase in
intracellular lipids. However the dyes are not actually cholesterol specific. DiI stains
triacylglycerides in human macrophage primary cells. High Performance Liquid
Chromatography (HPLC) provides a rigorous and informative technique for identifying
foam cells compared to lipid dyes. Kritharides published an HPLC method for
analysing lipids (L. Kritharides et al. 1993) and after adaption, this method was used to
measure cholesterol, cholesteryl esters and 7-ketocholesterol (7KC) uptake in
macrophages.
CD36 expression had responded to 7,8-dihydroneopterin with a decrease in cell protein
levels measured using immunoblotting and CD36 mRNA levels measured by rtPCR
(Shchepetkina 2013). Both these methods require a large number of cells and a
considerable amount of time. Therefore this thesis also looked at CD36 cell surface
expression using flow cytometry analysis of CD36 labelled macrophages.
Experimentally, foam cell formation was initiated by treating cells with oxLDL and
measuring the uptake at the end of an allocated time. As cells needed to survive in
order to become foam cells, the oxLDL concentration would not be toxic. The HPLC
method quantified the cell’s cholesterol uptake as a marker of foam cell formation.
7,8-14
dihydroneopterin down regulation was responsible for changes in the cells cholesterol
content.
2
Materials and Methods
2.1
Materials
2.1.1
Reagents
All reagents used were of analytical grade or better. All solutions were prepared using
MilliQ (Millipore) water.
7,8-Dihydroneopterin Schircks Laboratory, Switzerland
Acetic acid BDH Laboratory Supplies
Acetonitrile Fisher Scientific
Accutase Millipore.
Argon gas BOC
Bicinchoninic acid (BCA) protein determination kit Thermo Scientific
Bovine Serum Albumin (BSA) Invitrogen Corporation
Butylated hydroxytoluene (BHT) Sigma Chemical Co.
Chelex 100 resin Bio-Rad Laboratories
Cholesterol reagent Roche/Hitachi
Copper Chloride Mallinckrodt Chemical Works
Dialysis tubing Sigma-Aldrich Inc.
Diethyl ether Thermo Fisher Scientific
Ethylenediaminetetraacetic acid (EDTA) Sigma-Aldrich Co.
Ethanol Merck
n-Hexane BDH Laboratory Supplies
Hydrochloric acid (HCl) Merck
Isopropanol (2-Propanol) Fisher Scientific
Lymphoprep Axis-Shield PoC
Nitrogen gas BOC
Methanol Fisher Scientific
3-[4,5-Dimethylthiazol-2-yl]-2,5-diphenyl-tetrazolium bromide (MTT)
15
Potassium Hydroxide Sigma-Aldrich Co.
Sodium Bicarbonate Sigma-Aldrich Co.
Sodium Dihydrogen Phosphate monohydrate Scharlab
Sodium Hydroxide Sharlau Chemie
Trypan Blue Solution (0.4%)
Ultra-membrane tubing
Sigma-Aldrich Co.
Sigma-Aldrich Co.
2.1.2
Antibodies
Purified mouse IgM k isotype control BD Biosciences
Purified Mouse Anti-Human CD36 BD Biosciences
Polyclonal Goat Anti-Mouse Immunoglobulins/
R-phycoerythrin Goat F(ab’)2
DAKO
2.1.3
Media, Buffers and General Solutions
Foetal Calf serum (FCS) Invitrogen
Penicillin/Streptomycin (10,000U of penicillin G and
10,000µg of streptomycin /ml)
Gibco BRL
Roswell Park Memorial Institute 1640 (RPMI 1640) Gibco BRL
RPMI 1640 without phenol red. Sigma-Aldrich
Cell culture media
RPMI 1640 medium powder was dissolved in MilliQ water, sodium bicarbonate was
added and the pH was adjusted to 7.1. Sterilization was completed using Millipore
0.22µm filter in the Scanlaf Mars Class IIsterility cabinet under vacuum. It was then
transferred to sterile bottles and stored at 4°C. It was warmed to 35°C before use.
16
Each 500ml bottle of RPMI 1640 media had 10,000U of penicillin G and 10,000µg of
streptomycin (p/s) /ml added when opened from storage at 4°C. RPMI 1640 was
further supplemented with 10% human serum (v/v) for human monocyte derived
macrophages or 5% foetal calf serum for U937 cells before addition to cells.
PBS
Phosphate Buffered Saline (3M Sodium Chloride and 250mM Sodium dihydrogen
phosphate, pH 7.4) was vacuum filtered through a 0.45µm filter membrane. When
required for cell culture, the PBS was autoclaved at 121°C for 20 minutes and stored at
room temperature. It was warmed to 35°C before use.
7,8-Dihydroneopterin (7,8-NP) solution
A 100µM stock solution was prepared fresh prior to each treatment by dissolving in
RPMI 1640 no phenol red using a 10 minute sonication. The solution was sterilized by
filtration through a 0.22 µm filter membrane.
Washed Chelex
Chelex 100 resin was stirred with MilliQ water for 30 minutes. After resting for 30
minutes, the chelex was washed three times. The Chelex was then dried under vacuum
using a 0.45 µm filter membrane.
2.2
Methods
2.2.1
Preparation of Human monocyte derived macrophages (HMDMs)
HMDM cells are one of the cell types available for use as a model when studying
atherosclerosis. They are preferred because they offer much of the variability that is
faced when studying the human body. In treating them with GM-CSF, their
differentiation is directed towards becoming a M1, pro-atherogenic macrophage.
470ml of autologous blood is collected from hemochromatosis patients at the NZ blood
bank. This is blood that has had an anticoagulant added. Once back at the Free Radical
17
falcon tubes. The blood is centrifuged at 1000g for 20 minutes with the brake off and
the buffy coat (the layer of cells between the red blood cell layer and the plasma layer)
is transferred into new falcon tubes. An equal amount of warmed PBS is mixed with
the buffy coat and warmed lymphoprep is deposited at the bottom of the tubes. The cell
preparations are centrifuged at 1000g for 20 minutes with the brake on. This results a
monocyte/T- and lymphocyte cell layer which is isolated and washed 3 or 4 times with
45ml PBS. Between each wash is a 10 minute centrifuge at 500g. The cells are
re-suspended in 30mls of warmed RPMI 1640 and 6mls are plated in 6 well suspension
plates and placed in the Sanyo incubator for 40 hours. During this time the T cells die
off and the lymphocytic cells adhere to the plate. This leaves the monocytes in
suspension and they are re-suspended in a new mix of RPMI1640 supplemented with
10% human serum and p/s. The cell concentration is adjusted to 5x10⁶ cells/ml and
2uL of 25ug/ml of Granulocyte and Monocyte Colony Stimulation Factor (GMCSF) is
added per ml of 5 million cells. The cell suspension can then be adjusted to whichever
concentration required, plated in adherent tissue culture plates at 1ml/ well and moved
to the 37°C/ 5% Sanyo CO2 incubator. New RPMI 1640 supplemented with 10%
human serum and p/s was exchanged every 3-4 days, and experiments were executed
when the differentiation process finished at day 11 after seeding. The cells were
recognised as differentiated when the majority of the monocytes had conformationally
changed to macrophages.
2.2.2
U937 culturing
U937 cells were grown and maintained in suspension culture in a 75cm2 tissue culture
flasks. The media used was RPMI 1640 medium with phenol red, supplemented with
5% foetal bovine serum, penicillin (100 U/mL) and streptomycin (100 µg/mL) at 37°C
in a humidified atmosphere containing 5% CO2 (Sanyo incubator). The cell media was
changed every 3 days and cell concentrations were maintained between 0.2 and 1
million cells per ml through passages.
2.2.3
Human Serum
470ml of dry blood is collected from hemochromatosis patients at the NZ blood bank.
This is blood with no anticoagulant added. After sitting overnight at 4°C, the clotting
cascade was complete and the serum had separated from the clot. Under aseptic
18
50ml falcon tubes. The serum underwent centrifugation at 1000g for 10 minutes, with
the brake on. This pelleted the remaining red blood cells and allowed for the serum to
be isolated, combined and aliquoted into new falcon tubes. The serum was frozen at
-20°C on an angle and stored in the Sanyo -80°C freezer.
2.2.4
HPLC analysis of Cholesterol, Cholesteryl esters and
7-ketocholesterol
This method was adapted from Zunika Amit’s thesis (Amit 2008). The original method
was described by Kritharides (L. Kritharides et al. 1993) who elucidated cholesterol and
other compounds on the HPLC. The cholesteryl esters and oxysterols eluted in an
Acetonitrile: Isopropanol mobile phase using a C18 reverse phase column. The
acetonitrile improves the resolution of the peaks (Flavall et al. 2008) measured at 210nm
and 234nm.
Cholesteryl Ester Measurement
Lipids were extracted from 3 wells containing 5x10⁶ cells/ml and pooled before being
injected onto the HPLC. After removal of the RPMI 1640 media, cells were washed
with ice cold PBS. Lipids were harvested by treatment with 0.6ml of ice cold 0.2mol/L
sodium hydroxide at 4°C for 15minutes. Lysate was pooled and 1.2ml was aliquoted
into centrifuge tubes. The remainder of the lysate was set aside for protein
determination. 0.5ml cold nanopure water, 20 µL of 20mg/ml EDTA pH7.4, 20 µL of
100mg/ml BHT in methanol and 1ml of ice cold methanol was added to the lysate. The
tubes were vortexed briefly and 5ml of hexane was added. After a 1 minute vortex, the
tubes were centrifuged for 2 minutes at 1000g in 4°C. 4 ml of the top hexane layer was
removed into drying tubes and dried under nitrogen gas. 100uL of Acetonitrile:
Isopropanol (30:70 v/v) mobile phase is added to the lipid residue and dissolved. The
samples were run through the Shimadzu HPLC on a reverse phase Phenosphere-NEXT
5u C18 column at 20µL. The lipids eluted isocratically at 1ml/min with mobile phase
and detected by absorbance at 210nm. Identification and quantification of sample lipids
was carried out by using known concentrations of cholesteryl ester standards
(Cholesterol, cholesteryl arachidonate, cholesteryl linoleate, cholesteryl oleate and
cholesteryl palmitate made up in mobile phase).
19
Cholesterol and 7-Ketocholesterol determination was modified further from the
cholesterol ester method as cholesterol and 7KC are released by the potassium
hydroxide hydrolysis of the esters. After removal of the RPMI 1640 media, cells were
washed with ice cold PBS. Lipids were harvested by treatment with 0.6ml of ice cold
0.2mol/L sodium hydroxide at 4°C for 15minutes. Lysate from 3 wells were pooled and
1.2ml was aliquoted into centrifuge tubes. The remainder of the lysate was set aside for
protein determination. 0.5ml cold nanopure water, 20 µL of 20mg/ml EDTA pH7.4, 20
µL of 100mg/ml BHT in methanol and 1ml of ice cold methanol was added to the
lysate. The tubes were vortexed briefly and 5ml of hexane was added. After a 1 minute
vortex, the tubes were centrifuged for 2 minutes at 1000g in 4°C. 4 ml of the top
hexane layer was removed into new centrifuge tubes and dried under nitrogen gas.
Hydrolysis occurred by adding 2.5ml diethyl ether and 2ml 20% KOH in MeOH to the
dried lipid residue. Once the samples had been briefly vortexed, argon gas was used to
flush the tubes before a 3 hour incubation on ice during which ester hydrolysis
occurred. This was helped along by a 30 second vortex every half hour of the
incubation. Hydrolysis was stopped with 2ml of 20% acetic acid and a 30 second
vortex. 2.5ml of hexane was added, the samples were vortexed for 1 minute and
centrifuged at 200g for 10 minutes at 4°C. The top 80% (3.6ml) of the hexane layer
was removed into drying tubes and dried under nitrogen gas. The dried lipid residue
was then re-solubilised into Acetonitrile: Isopropanol: MilliQ water (44:54:02 v/v)
mobile phase and run through the Shimadzu HPLC on The samples were run through
the Shimadzu HPLC on a reverse phase Phenosphere-NEXT 5u C18 column at 20µL.
The lipids eluted isocratically at 1ml/min and detected at 210nm for the cholesterol and
234nm for the 7-ketocholesterol. Identification and quantification of sample lipids was
carried out by using known concentrations of cholesterol and oxysterol standards
(Cholesterol and 3β-hydroxy-cholest-5-en-7-one made up in acetonitrile: isopropanol
(9:11v/v) mobile phase).
2.2.5
Plasma and LDL preparation
Plasma collection
With Ethics Approval from the Upper South A Regional Ethics Committee: Ethics
approval number 98/07/069,200ml of blood was collected from 5-7 volunteers. The
blood was collected into 50ml falcon tubes containing 0.5ml of 10% (w/v) EDTA
20
centrifuge tubes and centrifuged using an Eppendorf 5810R fixed angle rotor at 11, 000
rpm for 30 minutes at 4°C. This second centrifugation ensures the plasma has no cell
remnants. The plasma from each donor is pooled and aliquoted into 30 ml portions to
minimise inter-person variation. The aliquots were stored at -80°C for up to six
months.
LDL isolation
LDL was purified by a single step ultracentrifugation using a Beckman NVTi65 rotor
(Gieseg and Esterbauer 1994). To isolate the LDL from the plasma, the thawed plasma
was centrifuged at 4700 rpm for 10 minutes at 4°C to remove precipitation. The plasma
has 0.3816g of Potassium Bromide (KBr)/ml dissolved in it to adjust the LDL’s density
to 1.24. Into 8 ultracentrifuge tubes, 5-6ml of 1mg/ml EDTA ph7.4 was added. A long
needle was used to underlay 3.75ml of the adjusted plasma to the bottom of each tube.
The ultra-centrifuge was run at 60,000 rpm for 2 hours at 10°C with a slow acceleration
and slow deceleration (brakes on) to isolate the LDL. After centrifugation, the upper
yellow layer of VLDL was removed and disposed of. The LDL sample was removed
from the ultracentrifuge tubes using a syringe needle bent to 90°. The cholesterol
content of the LDL layer was measured using the Roche/Hitachi CHOL reagent and the
spectrophotometer UVProbe 2.01 program. The LDL and CHOL reagent was
incubated for 10 minutes before the absorbance was measured at 500nm using a
Shimadzu 1601 spectrophotometer. The remainder of the sample is stored in the dark,
under argon, at 4°C. The LDL concentration was determined using an equation
accounting for the molecular mass of cholesterol, its mass and the estimation that
cholesterol is 31.64% of the LDL particle’s weight (Gieseg and Esterbauer 1994).
2.2.5.1 OxLDL preparation
Once the LDL was isolated, ultra-membrane tubes from Sigma-Aldrich were used to
concentrate the LDL to 8mg/ml. PBS was added to the LDL and it was centrifuged at
3000g for 30 minutes at 10°C. The LDL in the inner membrane had PBS added and a
second centrifugation occurred. Once there was the correct concentration of LDL, the
solution had 50mM CuCl2 stock solution added to it to make a final concentration of
0.5mM CuCl2. The mixture was incubated in dialysis tubing in 37°C PBS also with a
final concentration of 0.5mM CuCl2 for 24 hours. The completion of LDL oxidation
21
by incubating the oxLDL in PBS and washed chelex for 2 hours at 4°C. The chelex and
PBS was replaced for another two hours before being replaced again and incubating
overnight. The oxLDL was filter sterilised under aseptic conditions through a 0.22um
filter membrane and stored at 4°C.
2.2.6
MTT cell viability assay
The MTT assay is a viability assay that measures NADH dehydrogenase activity. This
allows living cells to metabolise the solution of
3-[4,5-Dimethylthiazol-2-yl]-2,5-diphenyl-tetrazolium bromide (MTT) into MTT-formazan. This is an insoluble
compound which is purple in colour, measured on the spectrophotometer at 570nm.
The 5mg/ml MTT reagent is made up in RPMI1640 with no phenol red to prevent false
colour readings. The adherent cells were washed twice with warm PBS. 900uL of
RPMI 1640 with no phenol red was added to the wells and 100uL of yellow MTT
reagent was added. The plates were incubated for one hour at 37°. This allowed the
purple crystals to form. 1ml of 10% SDS (in 0.01M HCl) was added to each well to
dissolve the crystals. After gentle pipetting, the absorbance was measured at 570nm
using the UV-1601PC Shimadzu Spectrophotometer against a MTT and RPMI blank.
The results were calculated as a percent of the control cell value.
2.2.7
Protein determination assay, BCA.
The BCA protein determination measures the reaction between Bicinchoninic acid with
copper ions and peptide bonds. The resultant purple colour is due to the protein
reducing the copper and the reduced copper subsequently being chelated by the
Bicinchoninic acid. This gives a correlation between the Purple colour formed and the
amount of protein. This technique is not influenced by differing protein composition,
as other dyes can be, because it relies not only on the protein residues but also the
peptide backbone. This evens out the variability resultant of protein composition and
which allows comparison to other protein samples.
The cell samples from the NaOH extraction method were diluted 1/10 so their
absorbance fell within the range of the protein standards. A total volume of 50uL of the
diluted sample was transferred to an Eppendorf. The protein analysis was achieved
using a BCA protein determination kit from Thermo Scientific. 50 parts of Reagent A
(Sodium carbonate/bicarbonate buffer, Bicinchoninic acid and Sodium tartrate in 0.1M
22
solution was mixed with the diluted samples for 30minutes at 60°C on a heated shaking
block. The reaction ceased when the samples were placed on ice and their absorbances
were measured on the UV-1601PC Shimadzu spectrophotometer at 562nm. Protein
concentration was determined from the slope and the y-intercept of a standard curve
created from a series of five protein standards: 0ug/ml, 25ug/ml, 50ug/ml, 100ug/ml
and 250ug/ml of 2mg/ml Bovine Serum Albumin standard from Pierce with dd water.
2.2.8
Flow cytometer analysis of CD36 cell surface expression
Flow cytometry is a technique used to measure the fluorescence of a single cell passing
through a laser beam or light source. A fluidics system orders the particles in the
sample into a single stream using hydrodynamic focusing (Rahman et al. 2006). The
light scattering or fluorescent emissions of the particle reveal information about the
particles properties. There are two detectors, one 20° offset from the beams axis called
the Forward Scatter Channel (FSC) and the other at 90° to the excitation line is the Side
Scatter Channel (SSC). The forward scatter and side scatter patterns are unique for
every particle and give information on size, granular content and distinguish between
debris and live cells (Rahman et al. 2006). There is also the ability to detect fluorescence
with silicon photodiodes or photomultiplier tubes which makes this piece of equipment
a very handy tool.
Cell experiments were carried out under aseptic conditions in a Scanlaf Mars Class II
biohazard cabinet. Cells were washed with RPMI1640 supplemented with p/s. The
cells were then incubated with Accutase™ for 15 minutes at 37° following the
Accutase™ protocol from the manufacturer (“Accutase,” n.d.). Accutase™ is a protease
and collagenase enzyme mix that lifts the adherent cells off the plate. The cells were
pipetted to detach and the Accutase™ was neutralised with equal volumes of
RPMI1640 supplemented with 10% FCS and p/s. The cells were washed with 1ml PBS
and 0.5% BSA and re-suspended in RPMI 1640 supplemented with 10% human serum
and p/s. The HMDMs were re-plated in suspension plates and incubated at 37°C for 12
hours. This allowed the CD36 surface protein levels to return to normal (Alessio et al.
1996). At the end of the treatment period, the cells were washed in ice-cold PBS and
0.5% BSA. They were treated on ice with mouse anti-human CD36 for 20 minutes.
They were washed with ice-cold PBS and 0.5% BSA and spun in a pre-cooled (4°)
centrifuge at 2000rpm for 5 minutes. They were re-suspended in GAM-PE (Polyclonal
23
dark, before being centrifuged at 2000 rpm for 5 minutes at 4°C. The samples were
re-suspended in 1ml PBS and 0.5% BSA. A primary antibody control (IgMk BD
Biosciences) was used to ensure that the labelling being seen was only due to antibody
binding. This avoided indirect staining (Shapiro 2003). 10,000 events were then
analysed on the FL2 filter using the BD Biosciences Accuri C6 Flow Cytometer.
2.2.9
Statistical Analysis
Data was graphed and analysed using the GraphPad Prism software program (version
6.0; GraphPad software, Inc. USA). Significance was confirmed by two-way analysis
of variance (ANOVA) and Tukey’s multiple comparisons test to quantitatively indicate
significance.
Results displayed in this thesis were taken from the best experiment, a representative of
at least three successful experiments. The means, standard deviations and standard
24
3
Results
3.1
Standardisation of the cholesteryl ester analysis method.
Commercial standards of cholesterol, cholesteryl arachidonate, cholesteryl palmitate,
cholesteryl oleate and cholesteryl linoleate were used to identify these lipids in LDL
and oxLDL using a modified version of Kritharides method (L. Kritharides et al. 1993).
Figure 1 shows that the commercial standards of cholesterol and the cholesteryl esters
all elute off the column at different times. The cholesteryl palmitate peak was not very
pronounced. However this was common in all the standard runs performed. The
investigation of an LDL sample in figure 2 clearly identified corresponding peaks
which eluted off the column at the same time frames as those of the commercial
standards. Also present in the LDL sample were other peaks but these were not
identified. Figure 3 presents the oxLDL sample which showed a loss of cholesterol and
cholesteryl esters. When figure 2 and 3 are compared, not all the lipids seen in figure 2
(LDL) are present in figure 3 (oxLDL). Cholesterol, cholesteryl oleate and cholesteryl
palmitate are present but the peaks corresponding to cholesteryl arachidonate and
cholesteryl linoleate are not evident in the oxLDL sample. This suggested that the
lipids had been altered during oxidation. Literature suggests that much of the cell now
contains 7-ketocholesterol (Leonard Kritharides et al. 1996). Cholesteryl arachidonate
and -linoleate may also oxidise to hydroperoxides and other oxidation products include
isoprostanes and aldehydes (Jessup, Kritharides, and Stocker 2004). Due to the oxidation
of these lipids, they will elute off the column at different times. Early elution is likely
as the size of the void peak has noticeably increased (figure 3).
25
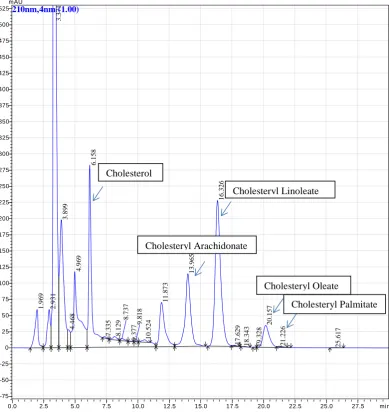
Figure 1.Chromatogram of commercial standards of cholesterol and cholesteryl esters.
The above standards are depicted as a chromatogram which have been dissolved in hexane, dried down with nitrogen gas and re-suspended in cholesteryl ester mobile phase. The prepared standards were then run on the HPLC using the cholesteryl ester method.
26
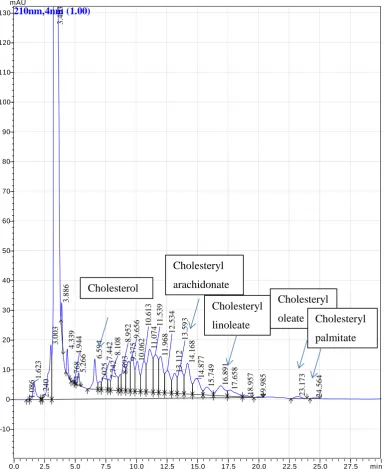
Figure 2.Chromatogram of extracted LDL with cholesterol and cholesteryl esters
identified. HPLC analysis of cholesterol and cholesteryl esters in LDL. 0.4mg of LDL was
extracted into hexane, dried and dissolved in cholesteryl ester mobile phase as per method. Lipid eluents detected by absorbance at 210nm.
27
Figure 3.Chromatogram of copper oxidised LDL with cholesterol and cholesteryl esters
identified. OxLDL was copper oxidised from the LDL sample (figure 2) at a concentration of
8.2mg/ml. Extracted into hexane, it was then dried under nitrogen and run on the HPLC in cholesteryl ester mobile phase using the cholesteryl ester method.
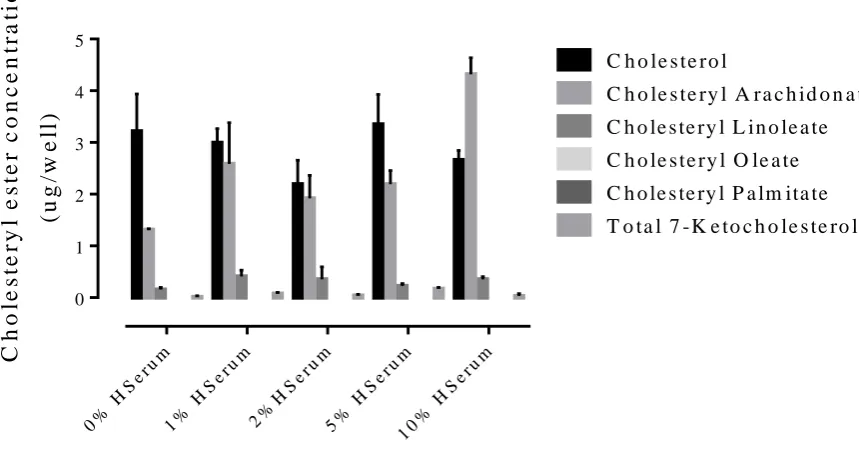
To further control for the types of lipids the cells were exposed to, the human serum
was also analysed for cholesterol and cholesterol esters (figure 4). As was expected,
low levels of these various esters were identified in the human serum due to the
lipoproteins presence in the serum. Because of the altered lipid profile of oxLDL, if it
was the lipid present in the human serum, cholesteryl arachidonate and –linoleate would
not be present. As they are, along with cholesteryl oleate and –palmitate the source of
these lipids was LDL. This confirmed that the cholesterol ester HPLC method was able
to be used to measure cholesterol and cholesteryl esters in the diluted human serum as
well as the pure lipoproteins.
28
[image:35.595.113.549.119.511.2]
Figure 4. Chromatogram of RPMI 1640 and 10% human serum with cholesterol and
cholesteryl esters identified. 200µl of RPMI 1640 and 10% human serum (cell culture media)
was extracted into hexane, dried and re-solubilised in cholesteryl ester mobile phase. HPLC analysis used absorbance measured at 210nm.
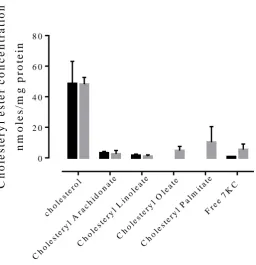
The resulting data from figures 2 and 3 were analysed to establish how much ester was
available (figure 5). LDL had more esters available than oxLDL. This is due to lipids
being altered during oxidation.
2.5 5.0 7.5 10.0 12.5 15.0 17.5 20.0 22.5 min
-25 0 25 50 75 100 125 150 175 200 225 250 275 300 325 350 375 400 425 450 475 500 525 mAU 210nm,4nm (1.00) 2. 5 02 2. 7 35 2. 8 22 5. 1 02 5. 3
97 6.277
29 C h o le s te ry l e s te r c o n c e n tr a ti o n (m g /w e ll ) Ch ole
s te r ol
Ch ole
s te r yl
Ara c h
ido na t
e
Ch ole
s te r yl
Lin ole
a te
Ch ole
s te r yl
Ole a te
Ch ole
s te r yl
Pa l mit
a te 0 . 0
0 . 5 1 . 0 1 . 5
L D L o x L D L
Figure 5.Changes in sterol content during LDL oxidation. LDL isolated from human
plasma or oxLDL made by copper oxidation of the LDL sample, was extracted into hexane, dried and re-suspended in cholesteryl ester mobile phase. Samples were processed in triplicate using the Cholesteryl Ester measurement method on the HPLC using absorbance at 210nm to quantify the eluting sterols. Representative chromatograms are shown in figures 2 and 3.
3.2
Determining amount of cells required for analysisWe investigated how many cells would be required to obtain a valid cholesterol and
ester signal on the HPLC. One well of a cell culture plate had a seeded concentration of
5x10⁶ cells/ml. In figure 6 the wells of cells were pooled to obtain a clear signal of the
cholesterol and esters on the HPLC chromatograms. A clear signal was required to
separate the cholesterol and ester peaks from the other peaks on the chromatogram.
Once the HPLC signal was acquired, the data was corrected to concentration of
cholesterol or ester per well. Figure 6 also demonstrates the variability of the cells
within each preparation. Despite the cells being seeded in almost identical
environments and the adoption of meticulous handling protocols, the cell response
differed. This can be seen in the cholesterol and cholesteryl arachidonate accumulation.
30
followed by a large drop in the cholesterol accumulation in 2 wells of oxLDL cells. By
pooling 3 wells to increase the concentration of cells, the expectation was a stronger
signal. While the 3-well-pooled signal was strong, pooling-2-well samples occasionally
exhibited higher concentrations of cholesterol and cholesteryl arachidonate as well as
7KC. Only the 2- and 3-well-pooled samples measured cholesteryl linoleate. None of
the samples measured a signal for cholesteryl palmitate. Pooling of three wells was
chosen as the preferred method on the assumption that if the cells took up higher
concentrations of cholesteryl oleate and -palmitate, the higher cell concentration would
be more likely to reveal the esters in question. Of note in figure 6 is that none of the
cells with oxLDL for 48 hours exhibited signs of cholesterol and ester uptake beyond
the control levels. Rather the levels of lipids are below the control cell’s levels (figure