Numerical Research of Heat Transfer of Supercritical
CO
2
in Channels
Lina Zhang1, Minshan Liu2, Qiwu Dong2, Songwei Zhao2
1School of Aeronautics Engineering, Zhengzhou Institute of Aeronautical Industry Management, Zhengzhou, China
2Thermal Energy Engineering Research Centre, Zhengzhou University, Zhengzhou, China E-mail: lina810619@163.com
Received December 17, 2010; revised March 18, 2011; accepted April 13, 2011
Abstract
With the worldwide development of nuclear power plant and requirement of saving energy and resource, high thermal efficiency and economical competitiveness are achieved by using supercritical CO2 with special thermal properties and better flow and heat transfer characters. In this paper, heat transfer of supercritical CO2 has been investigated in square and triangle array tube-bundle of cooled system in reactor using compu-tational fluid dynamics (CFD) code FLUENT, and the basic knowledge of heat transfer of supercritical CO2 and first experience of CFD simulation are obtained. The effect of mesh structures, turbulence models, as well as flow channel size is analyzed. The choice of turbulence model adopted in simulating supercritical CO2 is recommended. Comparing the effect of heat transfer with supercritical CO2 and supercritical water as cooled medium, the results show that the former was higher. The new idea is provided for choice of cooled medium and improving thermal efficiency this paper.
Keywords:Nuclear Power, Supercritical CO2, Heat Transfer, Numerical Analysis
1. Introduction
Supercritical fluids are very popular in a number of in-dustrial applications because of their special thermal properties, such as advanced water-cooled nuclear reac-tors, environmentally friendly air-conditioning and re-frigeration systems and high pressure water oxidation plant for waste processing. Recently, carbon dioxide has been used frequently in experimental studies because of its lower critical pressure and temperature. A compre-hensive understanding of the flow and heat transfer characteristic of supercritical fluid is essential for the purpose of performing accurate thermal-hydraulic pre-dictions, which is important in supercritical light water reactor (SCLWR) design calculations. At the same time, heat transfer of supercritical fluids is studied by using computational fluid dynamics (CFD) codes for predict-ing the heat transfer coefficient and providpredict-ing a better understanding of the heat transfer mechanism.
Kim et al. [1] researched the heat transfer of super-critical carbon dioxide flowing upward through tubes and a narrow annulus passage by experiments. S. M. Liao and T. S. Zhao [2] studied convective heat transfer to
supercritical carbon dioxide in miniature tubes with di-ameters of 0.70, 1.40, and 2.16 mm. The results of ex-periments revealed that the buoyancy effects were sig-nificant for all the flow orientations, although Reynolds numbers were as high as 105. Chaobin Dang and Eiji Hihara [3] investigated experimentally heat transfer of supercritical carbon dioxide cooled in four horizontal cooling tubes with different inner diameters ranging from 1 to 6mm. M. Sharabi [4] et al. investigated the effect of different turbulent models on the simulation results of supercritical CO2 in triangular and square channels.
The used turbulence models included RNG k-ε model and six kinds of low Reynolds number formulations. Pei-Xue Jiang et al. [5] investigated convection heat transfer of supercritical CO2 in a 0.27 mm diameter
ver-tical mini-tube experimentally and numerically. Lixin Cheng et al. [6] analyzed and compared many reports of heat transfer and pressure drop experimental data and correlations for supercritical CO2 cooling in-macro- and
micro-channels.
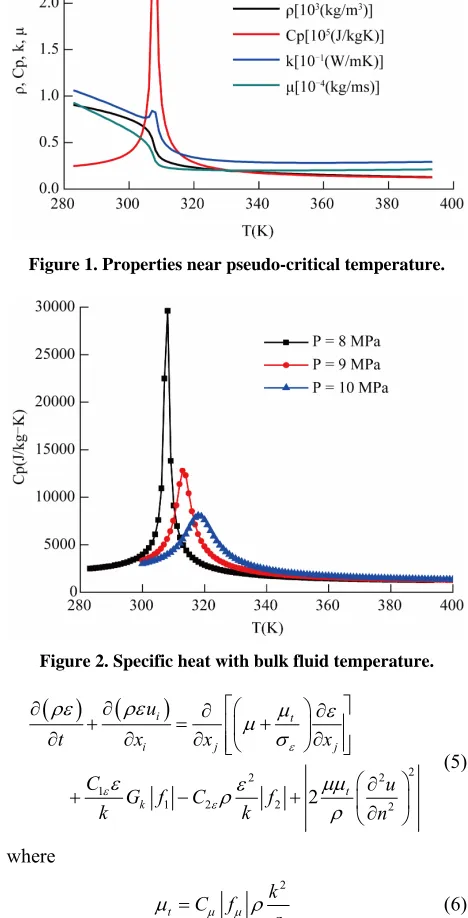
The large variation of the fluid physical properties of CO2 at 8 MPa with temperature around the critical point
The temperature at which the specific heat at constant pressure attains a maximum value is called the pseudo critical temperature, TPC. The important characteristics of
fluids at supercritical pressure, which makes them very particular from the point of heat transfer, is that their specific heat vary rapidly with both pressure and tem-perature, as seen from Figure 2.
Although a large number of numerical studies on heat transfer of supercritical fluids have been carried out by various authors, these works are mostly concentrated to simple geometries which are usually circle tubes. The objective of this study is to figureure out the distinctive characteristics of supercritical heat transfer in various flow channels such as triangular tube and sub channels of rod bundles using the CFD code FLUENT.
2. Turbulent Models and Method of Solution
Three kinds of low Reynolds number turbulent models are considered including YS model, LS model and AKN model provided by FLUENT code. The low-Reynolds number turbulent models respond strongly to the effects of buoyancy and acceleration resulting from the sharp decrease in density with the increase of temperature due to heating and the subsequent redistribution of velocity in the near wall region, and exhibit severe localized dete-rioration of heat transfer. The model equations are as following:
Continuity
0t
V (1)
Momentum
P t VVV V g (2)
Energy
p T T t C V T (3)
where ρ, μ, λ and CP are density, dynamic viscosity, thermal conductivity and specific heat for fluid, respec-tively, V and g are the dimensional velocity vector and
gravity vector, t is time, and T is temperature. Turbulent kinetic energy (k) [7]:
2 1/ 2
2
i t
i j k j
k
ku
k k
t x x x
k G n (4)
[image:2.595.311.538.78.247.2]Dissipation rate (ε):
Figure 1. Properties near pseudo-critical temperature.
Figure 2. Specific heat with bulk fluid temperature.
2
2 2
1
1 2 2 2 2
i t
i j j
t k
u
t x x x
C u
G f C f
k k n
(5)
where
2
t
k C f
(6)
[image:2.595.305.539.128.587.2]dioxide is pressurized to 8 MPa. Inlet fluid temperature is 288.15 K.
3. Triangular Channel
To gather first experience in the application of CFD codes to supercritical fluids, a vertically oriented trian-gular channel was selected which studied experimental by Jong Kyu Kim, et al. [8]. The structure size, boundary conditions (symm represents symmetrical condition) and grid adopted in the simulation of the model is illustrated as Figure 3. Due to symmetry, only a half of the actual
flow passage is modeled for the triangular channel. The hydraulic diameter is 9.8 mm and the heated length is 1.2 m. The sections before and after the heated section were 500 mm long (more than 40 d). Calculations with various size counts, which are 80 × (80 × 40), 100 × (100 × 50) and 120 × (120 × 60) in the axial directions and the OB side and OC side of the radial directions along the heated length, showed that the results were independent of the three kinds of size counts of grid. Therefore, the meshes with 100 size counts in the axial direction and (100 × 50) size counts in the radial direction were used. The con-vergence criteria required a decrease of at least six orders of magnitude for the residuals with no observable change in the surface temperatures for an additional 200 itera-tions.
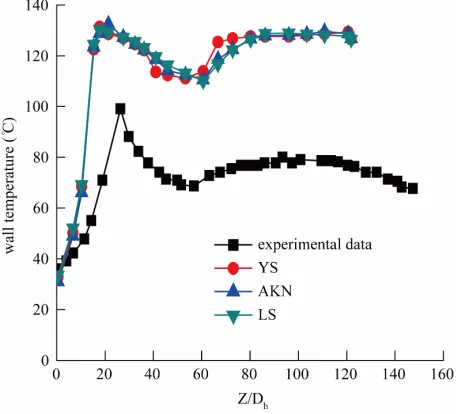
Figure 4 shows the triangular duct wall temperatures
predicted by the three kinds of low Reynolds number turbulent models under heat flux of 50 kW/m2 and mass
flux of 419 kg/(m2s). In the study, computational
simula-tions were compared with the selected experiments re-ported by Jong Kyu Kim et al.[8]. As can be seen, the simulations have the same trend with the experiment. The wall temperature appears a peak near Z/Dh equal to
20. Thereafter, the wall temperature decreases slightly as Z/Dh increases, as a result of the change in fluid transport
properties. The results of different turbulent models are almost same. The AKN turbulence model over-predicts significantly turbulence reduction, and the result is same with S. He et al. [9].
[image:3.595.322.529.75.205.2]In the later simulation of this paper, modeling results will be reported using the AKN because the results in-dependent on the grid numbers can easily obtained ac-cording AKN turbulence model.
Figure 5 shows local Nusselt number variations in
tri-angular tube along the flow direction, and the correla-tions and experimental data with the present simulated data are compared. The simulated data are very close to the experimental data during the heated section, and are in reasonably good agreement with the two correlations. Kransnoshchekov and Protopopov’s and Jackson’s cor-relations are based primarily on the forced convection at
C O
wall
wall symm
B
[image:3.595.310.538.249.456.2]Figure 3. Grid and boundary conditions adopted for the triangular channel.
[image:3.595.308.538.258.682.2]Figure 4. Wall temperature along the axial line C.
[image:3.595.308.539.475.689.2]supercritical pressure. Other forced convection correla-tions for heating CO2 in a vertical pipe have been
pro-posed, but according to Jackson and Hall, Krans-noshchekov and Protopopov’s correlation is the most accurate and is supported by the most experimental data [8].
[image:4.595.309.538.78.286.2]The effect of mesh structures and turbulence models was studied. Based on a comparison of the numerical results with experimental data, the accuracy and applica-bility of turbulence models were assessed.
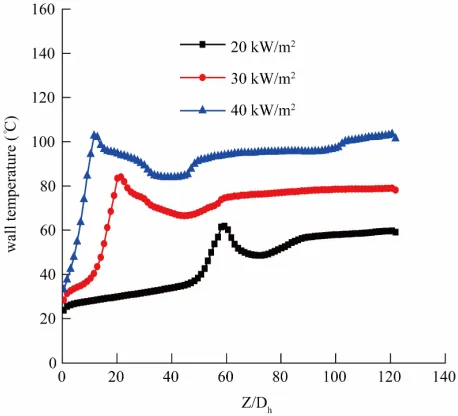
Figure 6 shows the wall temperature variations for the
triangular channel in the axial direction at the different heat flux, with the mass flux is 314 kg/(m2s). There is a
peak in the temperature distribution, it shows the heat transfer deterioration. The deterioration takes place ear-lier at about Z/Dh equal to 10 under higher heat flux
equal to 40 kW/m2. The heat transfer deterioration takes
place stronger under higher heat flux.
The distributions of Nusselt number along heated sec-tion under different heat flux are as shown in Figure 7. It
is noted that the Nusselt number fluctuates to some ex-tent. Nusselt number appears a peak under higher heat flux, and the heat transfer deterioration takes place ear-lier. Nusselt number appears two peaks under 20 kW/m2.
4. Sub-Channels
In this section, sub-channels of both triangular-array and square-array rod bundles are taken, the structure and grid as indicated in Figure 8, and the simulated parameters
are as Table 1.
Nusselt numbers for forced convection are calculated by using the Gnielinski correlation [10]:
2/3
8 Re 1000 Pr
1.07 12.7 8 Pr 1
b
b f
Nu
f
b
(7)
210
1.82 log Reb 1.64
[image:4.595.308.537.97.517.2]f (8)
Figure 9 shows the Nusselt number of supercritical
CO2 and water in the square array rod bundles under
pressure of 8 MPa and 25 MPa respectively. The mass flux and the heat flux of water are 740 kg/(m2s) and 600
kW/m2 respectively, and those of CO
2 are 300 kg/(m2s)
and 100 kW/m2, respectively. The simulated data of
su-percritical water are cited from numerical analysis re-ported by X. Cheng et al. [11]. Supercritical CO2 under
far lower pressure, mass flux and heat flux, the Nusselt number is little lower than supercritical water. The effect of heat transfer with supercritical CO2 is better than that
of supercritical water.
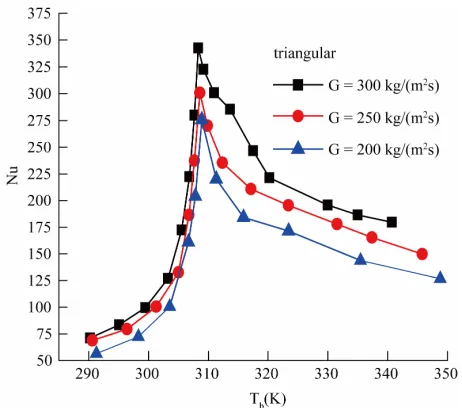
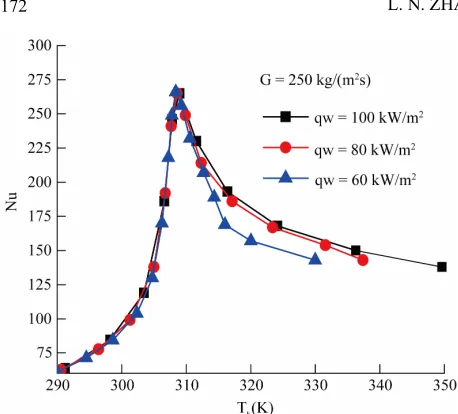
Figure 10 and Figure 11 show the effect of mass flux
on Nusselt number as a function of fluid bulk tempera-ture (Tb) of square and triangular array rod bundles, and
[image:4.595.309.539.305.521.2]Figure 6. Wall temperature along the axial line C.
Figure 7. Local Nusselt number variations in the flow di-rection.
[image:4.595.311.536.566.704.2]Table 1. Parameters for the sub channels simulation.
Parameters Range Rod bundle arrangement Square, triangular
Rod diameter 8.0 mm
Pitch-to-diameter ratio 1.2
Pressure 8 MPa
Mass flux 200 - 300 kg/(m2s)
Heat flux 60 - 100 kW/m2
Fluid bulk temperature 280 - 350 K
[image:5.595.57.288.89.453.2]Turbulence models AKN
Figure 9. Variation of Nusselt number for supercritical CO2 and water.
[image:5.595.57.285.92.455.2]Figure 10. Mass flux effects on Nusselt number in square array rod bundle.
Figure 11. Mass flux effects on Nusselt number in triangu-lar array rod bundle.
Tin equals to 288.15 K, heat flux is 100 kW/m2. The
mass flux effects Nusselt number significantly due to the increased Reynolds number. However, before the critical point, mass flux has less effect on heat transfer. The peak values increase with increasing mass flux. The peak of Nusselt number appears around the pseudocritical tem-perature. After the near-critical point region, the effect of mass flux on Nusselt number becomes more obvious.
Figure 12 shows the effect of heat flux on the Nusselt
number as a function of bulk temperature in the square array rod bundles. Before the pseudocritical temperature, the Nusselt number under different heat flux is nearly same. With the increasing bulk temperature, the variety becomes more obvious. Especially under lower heat flux, the Nusselt number decreases significantly.
Figure 13 shows the comparison between the square
lattice and triangular lattice of Nusselt number along bulk temperature with the heat flux 100 kW/m2. The heat
transfer is enhanced in the triangular lattice at pseudo-critical temperature and got cross that temperature, and the reason is that the degree of turbulence increases be-cause of the change of structure of flow channels.
5. Conclusions
Heat transfer of supercritical CO2 has been investigated
in various flow channels. Three kinds of low Reynolds number turbulent models are adopted to analyze the ef-fect on the wall temperature of the triangle channels, and the results show that difference under different turbulent models is rather small, and then AKN turbulent model are chosen.
[image:5.595.57.287.490.694.2]Figure 12. Heat flux effects on Nusselt number of square array rod bundle.
Figure 13. Comparison of square array rod bundle with triangular array rod bundle.
with increasing heat flux. The heat transfer deterioration takes place earlier with higher heat flux, whereas Nusselt number appeared two peaks under lower heat flux.
The heat transfer effect of supercritical CO2 is better
than that of supercritical water. The effect of mass flux on Nusselt number is more obvious than heat flux. The Nusselt number is higher under larger mass flux, espe-cially across the pseudocritical temperature. The heat transfer effect with triangular array rod bundles is better than that of square array rod bundles under the same heat flux and mass flux.
6. Acknowledgments
This work was supported by the National Natural Sci-ence Foundation of China (51076145). The authors
would like to thank teachers of Thermal Energy Engi-neering Research Center of Zhengzhou University.
7. References
[1] K. Hyungrae, Y. K. Hwan, J. H. Song et al., “Heat Trans-fer to Supercritical Pressure Carbon Dioxide Flowing Upward through Tubes and a Narrow Annulus Passage,” Progress in Nuclear Energy, Vol. 50, No. 2-6, 2008, pp. 518-525. doi:10.1016/j.pnucene.2007.11.065
[2] S. M. Liao and T. S. Zhao, “An Experimental Investiga-tion of ConvecInvestiga-tion Heat Transfer to supercritical Carbon Dioxide in Miniature Tubes,” International Journal of Heat and Mass Transfer, Vol. 45, No. 25, 2002, pp. 5025-5034. doi:10.1016/S0017-9310(02)00206-5 [3] C. B. Danga and E. J. Hihara, “In-Tube Cooling Heat
Transfer of Supercritical Carbon Dioxide. Part 1: Ex-perimental Measurement,” International Journal of Re-frigeration, Vol. 27, No. 7, 2004, pp. 736-747.
doi:10.1016/j.ijrefrig.2004.04.018
[4] M. Sharabi, W. Ambrosini, S. He et al., “Prediction of Turbulent Convective Heat Transfer to a Fluid at Super-critical Pressure in Square and Triangular Channels,” Annals of Nuclear Energy, Vol. 35, No. 6, 2008, pp. 993-1005. doi:10.1016/j.anucene.2007.11.006
[5] P. X. Jiang, Y. Zhang and R. F. Shi, “Experimental and Numerical Investigation of Convection Heat Transfer of CO2 at Supercritical Pressures in a Vertical Mini-Tube,” International Journal of Heat and Mass Transfer, Vol. 51, No. 11-12, 2008, pp. 3052-3056.
doi:10.1016/j.ijheatmasstransfer.2007.09.008
[6] L. X. Cheng, G. Ribatskia and J. R. Thome, “Analysis of Supercritical CO2 Cooling in Macro- and Micro-Chan- nels,” International Journal of Refrigeration, Vol. 31, No. 8, 2008, pp. 1-16. doi:10.1016/j.ijrefrig.2008.01.010 [7] M. van der Kraan, M. M. W. Peeters, M. V. Fernandez
Cid, G. F. Woerlee, W. J. T. Veugelers and G. J. Wit-kamp, “The Influence of Variable Physical Properties and Buoyancy on Heat Exchanger Design for Near- and Su-percritical Conditions,” The Journal of Supercritical Fluids, Vol. 34, No. 1, 2005, pp. 99-105.
doi:10.1016/j.supflu.2004.10.007
[8] J. K. Kim, H. K. Jeon and J. S. Lee, “Wall Temperature Measurement and Heat Transfer Correlation of Turbulent Supercritical Carbon Dioxide Flow in Vrtical Circu-lar/Non-Circular Tubes,” Nuclear Engineering and De-sign, Vol. 237, No. 15-17, 2007, pp. 1795-1802. doi:10.1016/j.nucengdes.2007.02.017
[9] S. He, W. S. Kim and J. H. Bae, “Assessment of Per-formance of Turbulence Models in Predicting Supercriti-cal Pressure Heat Transfer in a VertiSupercriti-cal Tube,” Interna-tional Journal of Heat and Mass Transfer, Vol. 51, No. 19-20, 2008, pp. 4659-4675.
doi:10.1016/j.ijheatmasstransfer.2007.12.028
[image:6.595.59.286.304.497.2][11] X. Cheng, B. Kuang and Y. H. Yang, “Numerical Analy-sis of Heat Transfer in Supercritical Water Cooled Flow Channels,” Nuclear Engineering and Design, Vol. 237,
No. 3, 2007, pp. 240-252.