https://www.scirp.org/journal/eng
ISSN Online: 1947-394X ISSN Print: 1947-3931
DOI: 10.4236/eng.2019.119042 Sep. 23, 2019 604 Engineering
Development of a Competitiveness
Improvement Framework for Forensic
Science Laboratories
Gloria Cuthbert Omari
1, Samwel Victor Manyele
2, George Mwaluko
11Department of Mechanical and Industrial Engineering, College of Engineering and Technology, University of Dar es Salaam, Dar es Salaam, Tanzania
2Government Chemist Laboratory Authority, Dar es Salaam, Tanzania
Abstract
This study presents a methodology used in developing the competitiveness improvement framework (CIF) for laboratories, in particular, Forensic Science Laboratories (FSLs). The cyclic nature of FSL processes allowed data collec-tion for the purpose of identificacollec-tion of factors affecting FSL performance (cause factors). Flow charts were used to represent mathematical formula-tions for cause factor measurements and quantification of the baseline data on turnaround time (TAT), backlogs for case files (Bg), turnaround time in the supply chain (Tsc), and employee absenteeism (Ab). By quantifying the cause factors in addition to academic development coefficient (Ad) and com-plex longevity (Lc) for FSL employees, it was possible to establish the organi-zational design features requiring improvements. The relevance of cause fac-tors to FSL stakeholders and means of improvement and sustainability were established. A detailed road map towards CIF was presented using D-MAIC methodology. The rated cause factors based on challenges in the FSL business environment were subjected to Pareto analysis to prioritize the challenges in order to improve FSLs’ competitiveness. The interrelationship between the three dimensions of competitiveness improvement (process, performance and planning) was presented in terms of the affected six cause factors. Also, the potential lean practices for improving competitiveness of FSL based on meas-ured cause factors have been presented. This paper introduced methods and measures for improving operational competitiveness of laboratories. The CIF was finally presented in a form of a series of three flow charts summarizing all steps implemented in its development with inputs and cause factors involved.
Keywords
Competitiveness Improvement, Laboratory Process Variations, Organizational Performance Factors, Pareto Analysis, Dimensions of How to cite this paper: Omari, G.C.,
Ma-nyele, S.V. and Mwaluko, G. (2019) Devel-opment of a Competitiveness Improvement Framework for Forensic Science Laborato-ries. Engineering, 11, 604-641.
https://doi.org/10.4236/eng.2019.119042
Received: July 30, 2019 Accepted: September 20, 2019 Published: September 23, 2019
Copyright © 2019 by author(s) and Scientific Research Publishing Inc. This work is licensed under the Creative Commons Attribution International License (CC BY 4.0).
http://creativecommons.org/licenses/by/4.0/
DOI: 10.4236/eng.2019.119042 605 Engineering Competitiveness, Wastes in Laboratory Processes, D-MAIC Methodology
1. Introduction
1.1. Need for Developing the Competitiveness Improvement
Framework for FSL
The FSL consists of a series of connected processes beginning at SRO’s office (when samples arrive) and ending at the same area where clients collect their analytical reports. In this study, the critical performance measures and cause factors were identified in order to develop the CIF. The contribution of this study to the global knowledge is mainly on forensic science laboratory manage-ment, which is a new research area involving competitiveness improvement. Af-ter establishing the baseline performance data, the study scope was extended to locating areas of improvement and the approach.
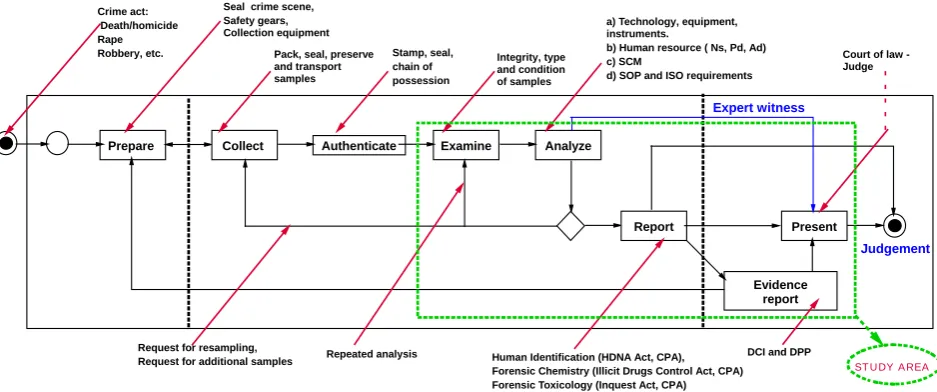
The current structure of forensic science services in Tanzania is defined using the basic processes shown in Figure 1 (starting from a crime scene to judgment at a court of law). The study area started from the time samples/exhibits are submitted to the laboratory to the time when a report is released.
The competitiveness scenario of FSL focuses on differentiation of services from its competitors and elimination of customer complaints due to delayed re-ports (extended TAT and backlogs). It was important to use the lean principles (LPs) based on essential characteristics and power to identify the non-value added activities (NVAs) [1].
1.2. Baseline Data on Cause Factors Affecting Competitiveness in
the FSL
1.2.1. Case-File Backlogs Challenge
Case-file backlogs were identified as one of the cause factors affecting the com-petitiveness of the (FSL). Backlogs represent case-files that remain unprocessed or unreported within a selected time interval (year, week or month) which leads to increased customer complaints, rework, cost of analysis, degradation of bio-logical samples, etc. Case-file backlogging was quantified in three consecutive years (Y2014 to Y2016) to study variations as case files are processed [2][3][4] [5]. Data were collected for the case-files received and case-files processed, dif-ference of which gives case-files backlogged. The time interval for a case-file to be regarded as backlogged was one week, which can translate into backlogged case-files per month or year. A data collection tool was established and used for three laboratory disciplines (forensic chemistry, biology/DNA and toxicol-ogy).
DOI: 10.4236/eng.2019.119042 606 Engineering Figure 1. Process flow chart for forensic science services in Tanzania and the study area, identification.
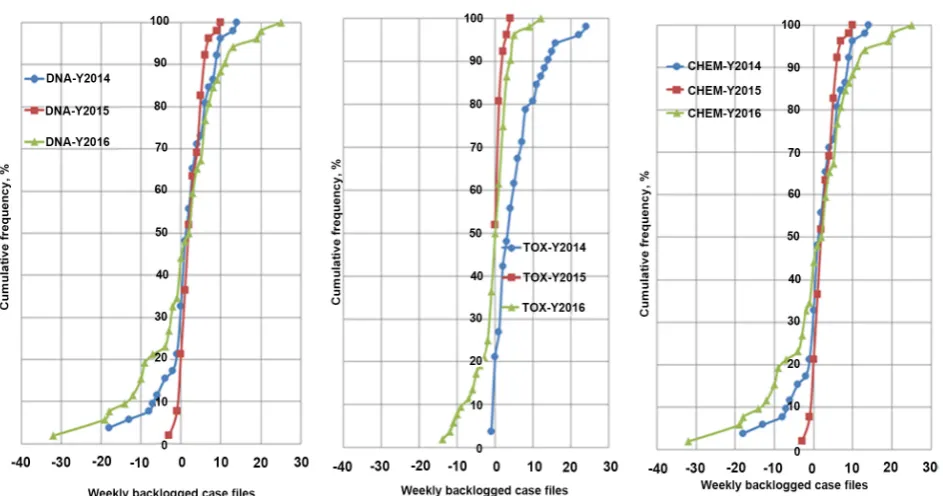
respectively. The annual percentage of the case-files backlogged was highest for forensic toxicology (at 29.0%), while the highest number of case-files backlogged per week was observed for forensic chemistry (1.0 case-file per week), followed by forensic biology/DNA (at 0.77 case-files per week) in Y2016.
The number of case-files backlogged per analyst per year was highest in Y2014 and dropped continuously towards Y2016, being comparably higher in forensic biology/DNA (8.0 case-files per analyst per year) and chemistry (7.4 case-files per analyst per year). The effect of case-file backlogging on FSL competitiveness can be minimized by continued management effort in backlog elimination [6] [7][8].
1.2.2. Extended Turnaround Time during Case-File and Sample Processing
TAT is the total time interval from when a request for laboratory analysis is re-ceived until when the results are collected by the client [9] [10]. The perfor-mance of the FSL is affected by extended TAT in the case-file and sample processing steps. This has not been subjected to intensive research, necessitating critical analysis [11][12] [13][14]. The total TAT was obtained as the sum of measured time interval for each work station, six of which were studied [15] [16]. Extended TAT leads not only to customer complaints, but also paves way for customers to seek for services from competitors, leading to lost competitive edge for the FSL. This study was conducted to establish the baseline data on
TAT (between Y2014 and Y2015) to enable implementation of corrective actions
[14]. Six case-file processing steps were identified for which starting and com-pletion times were recorded in dates, giving TAT values in days. The overall turnaround time (TTAT) was the highest for forensic biology/DNA compared to forensic chemistry and toxicology (137.7, 76.4 and 54.5 days on average, respec-tively). The laboratory analysis time (TAT2) was the longest of all six case-file processing steps (being 94.9, 31.8 and 10.4 days, for biology/DNA, toxicology Prepare Collect Authenticate Examine Analyze
Report Present
Evidence report Seal crime scene,
Safety gears, Collection equipment Crime act:
Death/homicide Rape
Robbery, etc. Pack, seal, preserve
and transport samples
a) Technology, equipment, instruments.
b) Human resource ( Ns, Pd, Ad) c) SCM
d) SOP and ISO requirements Stamp, seal,
chain of possession
Integrity, type and condition of samples
Expert witness
Court of law - Judge
DCI and DPP
Repeated analysis Human Identification (HDNA Act, CPA),
Forensic Chemistry (Illicit Drugs Control Act, CPA) Forensic Toxicology (Inquest Act, CPA)
Judgement
STUDY AREA
DOI: 10.4236/eng.2019.119042 607 Engineering and chemistry laboratories, respectively). The three major steps necessitating root-cause analysis and intervention to minimize TAT were analysis turnaround time (TAT2), report collection time (TAT6) and report review time (TAT4). It was concluded that the causes for extended TAT were within control by the FSL management, although financial and human resources were required to achieve the TAT reduction.
1.2.3. Employee Absenteeism in the FSL and Its Impact on Competitiveness
Absenteeism is a bigger problem affecting negatively the competitiveness of any laboratory [17][18][19]. A detailed analysis of the measured absenteeism data for employees in the FSL was conducted, using a sample size of 134 (78%) em-ployees out of 172. While the availability of resources affects also the perfor-mance of the laboratory, absenteeism plays a vital role, worth exploring [20][21] [22][23][24]. The factors assumed to affect absenteeism included differences in gender, departments/units, periods of the year, skill-levels and professions (chem-ists, technologists and accountants). The data were collected throughout a ca-lendar year, using a biometric system infrastructure incorporating fingerprint capturing device, IP camera, database server and software (Bio Star Version 1.62) [25]. The absenteeism ratio based on hours, Abh, was observed to be the most appropriate parameter [25]. The lowest values of Abh (at 0.82% annual av-erage) were observed in the business development department (BDD), with highest in PQSD at 26.91%. Female employees show higher Abh (at 17.54%) and lower Abd (at 20.36%) than male employees (at 12.93% and 20.36%, respectively), while accountants show lowest absenteeism (at −4.94%) compared to other pro-fessions (12.58% and 36.58% for chemists and technologists, respectively). Em-ployees in professional level had highest absence rate (24.0%) compared to skilled (13.6%), semi-skilled (12.7%) and unskilled employees (9.5%). Most working hours were lost during September-December compared to the rest of the year. The results reveal higher employee absenteeism in the FSL affecting its overall performance as lost productivity [26][27][28].
1.2.4. Employee Longevity and Academic Development
A detailed analysis of academic development index and longevity among labor-atory employees was conducted aimed at improving organizational performance
pro-DOI: 10.4236/eng.2019.119042 608 Engineering gram, the percent of staff with MSc has been increasing from about 3.5% in Y2004 to 9% in Y2015. Results show that a balanced staff distribution based on
Lcand Adis inevitable for improved performance. It was concluded that the new indices (Ad and Lc) are important tools towards development of the workforce and competitiveness of any laboratory as they lead to human performance im-provement (HPI) [36][37].
1.2.5. Turnaround Time for Supply Chain Management Processes
The Supply Cycle Time (SCT) denoted as Tsc, depends on all factors that affect the turnaround times across its key components (the user, supplier, tender board, the procurement management unit performance). Baseline study revealed wide variations in Tsc, giving a mean of 105.6 days, which is extended. Reduction in Tsc must involve the FSL management and all key players in the SCM processes. However, the reduction of SCT by elimination of wastes in the processes is difficult as most of the SCM steps in between are pre-requisite in the said process and the steps are mandatory. Thus, step by step reduction in the Tsc is required.Lack of knowledge on procurement processes by staff in the user de-partments is another challenge to the FSL competitiveness. The Tsc is also ex-tended due to the fact that most of the laboratory suppliers involve a relationship with third party vendors, which implies a complex relationship with the FSL.
2. Literature Review
2.1. Impact of Process Variables on FSL Competitiveness
The pillars of the FSL competitiveness include processes and organizational de-sign. All these areas have been studied in details, before developing the CIF. Turnaround time analysis was accomplished by identifying action points to be assessed [9][38][39], followed by detailed data collection. Moreover, the back-logged case-files, Ncb, were also repeatedly captured at different action points by determining the number of case-files received and reported [5].
The laboratory turnaround time can also be defined differently according to the test type or analysis requested. The “total testing cycle” describes TAT as a syndicate of eight stages: collection, identification, transport, preparation, analy-sis, reporting, interpretation, and action [40].
Supply chain management (SCM) is an integrative philosophy to manage the total flow of a distribution channel from supplier to the ultimate user [41][42]. In this study, SCM analysis comprised of: determination of the TAT compo-nents in SCM; determination of procurement performance measurement sys-tem; interaction between the user, procurement management unit (PMU), ac-counts and supplier, and determination of the key metrics for supply chain management (financial and other metrics).
longevi-DOI: 10.4236/eng.2019.119042 609 Engineering ty, academic and professional development, staff absenteeism, staff responsibili-ties and interactions [25][43][44].
2.2. Resource-Based Competitiveness
Researchers have advanced various methods for improving performance of laboratories including competitiveness, for example, a resource-based method
[45] [46]. The term resource is meant anything which could be thought of as strength of a laboratory as an organization. According to this broad definition, resources can be tangible or intangible. In this case, organizations perform poorly because either they possess resources that are not in demand, own resources that are not scarce or do not own such resources [46][47]. Improving performance of a laboratory requires understanding the core processes and factors hindering these processes. Intervention under this method would comprise of searching for resources that are in demand, scarce and appropriated by the organization, such as working areas, machinery, skilled and well developed staff, motivated staff, etc. Improving performance should adopt an industry-based method, which relies on the principles that laboratory success is based on its ability to harness opportunities and tame threats that exist in the business environment [48] [49].
2.3. Effect of Extended Turnaround Time in Supply Chain
Management on FSL Competitiveness
Supply chain management (SCM), is among the factors affecting FSL competi-tiveness. In this study, supplier-laboratory interactions have been assessed based on Tsc and financial metrics, etc. In FSL, the role and importance of the supply chain is mainly understood as evidence supply chain or the storage of evidence at the FSL. In this study, however, SCM focuses on material and services flow from suppliers. One of the methods which can be used to assess the key perfor-mance of supply chain management in the laboratory setting is consideration of issues affecting supply chain [50]. However, there is a need of having supply chain operators responsible for managing inventory flow to ensure that the goods arrive at the right place at exactly the right time, that is, the procurement management unit (PMU).
Supply chain performance measures (SCPM) serve as indicators of how well the supply chain system is functioning. Measuring SCP can facilitate a greater understanding of the supply chain and allow improving its overall performance
DOI: 10.4236/eng.2019.119042 610 Engineering
2.4. Models for Improving Organizational Competitiveness
Competitiveness is a multidimensional concept, observed from different levels: national and organizational or firm level. Competitiveness means involvement in a business opposition for markets, in this study used to describe economic strength of entity laboratory with respect to its competitors [55]. Laboratory or firm-level competitiveness is defined as the capacity of the laboratory to design, produce and or sell its products or services superior to those offered by compet-itors, considering the price and non-price qualities.
Researchers suggest different framework designs for competitiveness. While others suggest a framework with three folds: performance, potential, and the management processes, others suggest a framework that involves a combination of assets and processes, where assets are either inherited (natural resources) or created (infrastructure) and processes transform assets to achieve economic gains from sales to customers [56]. Other authors present an approach which emphasizes the role of factors internal to the laboratories such as strategy, struc-tures, competencies, capabilities to innovate, and other tangible and intangible resources for their competitive success [57] [58]. In order to provide customers with a greater value of satisfaction than their respective competitors, laboratories must be operationally efficient, cost effective, and quality conscious [59].
Competitiveness improvement process seeks to identify the important factors and performance of core processes including the human resource processes, op-erations management processes (that is, laboratory processes based on case-file management and supply chain management) and planning or strategic man-agement processes. Balancing the core processes will enhance the ability of la-boratory to compete more effectively. Researchers view sources of competitive-ness as those assets within the laboratory organization that provide advantage which can be tangible or intangible [60].
Business design for FSL, therefore, has two principal requirements: sustaining casework productivities in a timely and efficient manner, whilst adhering to quality standards and the timelines of the investigatory and judicial processes. The design involves also developing and executing major programs of infra-structure investment and process re-engineering. Competitiveness is the ability of a laboratory or country to offer services and products that meet the quality standards of the local and global markets at prices that are competitive and pro-vide adequate returns on resources employed [46][61]. Competitiveness of a la-boratory is measured in terms of quality of service, level of productivity, quality of human resource, price, and ability to innovate [31][32][35][62][63].
devel-DOI: 10.4236/eng.2019.119042 611 Engineering oped covers also multidimensional aspects of organizations namely, organiza-tional processes, design, culture and politics [64]. The need to consider the en-vironment is also taken into account in particular the stakeholder demand of services, and challenges in the laboratory business environment [48].
3. Methodology
3.1. Utilizing the Cyclic Nature of the FSL Processes
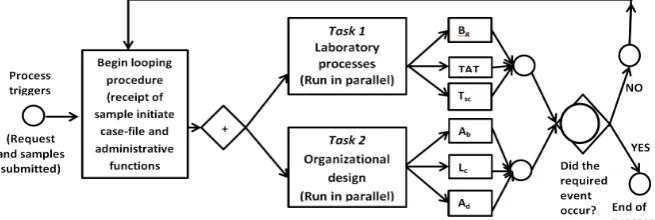
(CIF) applies repetitive business processes such as the case flow management (CFM) assessed thoroughly in this research. In the FSL model setup, each case-file passes through several action points and complete processing is achieved before passing to another point. Whenever any action is completed time taken was noted while, if the case files are not completed in seven days, the case file is re-garded as back logged. When another request for analysis of samples arrive, the same process is repeated at varying performance, measured using TAT, case-file backlogs (Bg), coupled with assigning staff of different traits (Ad, Lc and Ab), leading to a dynamic cyclic process of different characteristics. Figure 2 shows the decision diagram for conducting CIF analysis by observing designated events at different action points. Table 1 summarizes the parameters or cause factors assessed after capturing data in this study.
In forensic science laboratory, the repeating business takes place within the organization design or in the processes taking place within the laboratories. All the six parameters, or cause factors for FSL competiveness can be tracked in a repeating mode using the case-files as a unit of measure for laboratory issues (Bg,
TAT), purchase order processing(Tsc) and absence/presence of staff with differ-ent traits (Ad, Lc) based on assignment case files (number of case files per analyst per year) and biometric database on daily basis (Ab). However, intervals among action points differ from one case-file to another which was measured leading to wide data volume for TAT and Bg. The processing time was also different for each purchase order, leading to data on Tsc.
3.2. Capturing Variations in the Total Turnaround Time and
Backlogs during Case-File Management
[image:8.595.210.538.590.700.2]Variations were identified in the turnaround time (TAT) for sample analysis.
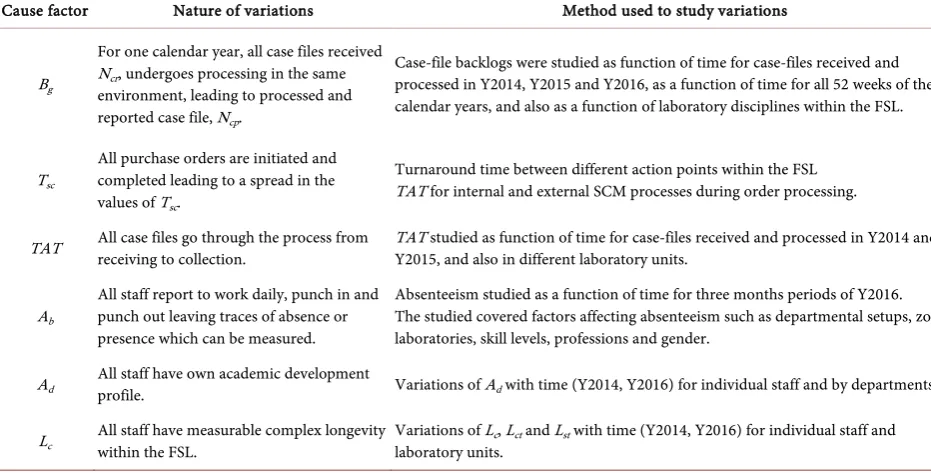
DOI: 10.4236/eng.2019.119042 612 Engineering Table 1. Cyclic nature of the FSL processes and methods adopted for studying variations in the FSL processes.
Cause factor Nature of variations Method used to study variations
Bg
For one calendar year, all case files received Ncr, undergoes processing in the same environment, leading to processed and reported case file, Ncp.
Case-file backlogs were studied as function of time for case-files received and processed in Y2014, Y2015 and Y2016, as a function of time for all 52 weeks of the calendar years, and also as a function of laboratory disciplines within the FSL.
Tsc
All purchase orders are initiated and completed leading to a spread in the values of Tsc.
Turnaround time between different action points within the FSL TAT for internal and external SCM processes during order processing.
TAT All case files go through the process from receiving to collection. TAT studied as function of time for case-files received and processed in Y2014 and Y2015, and also in different laboratory units.
Ab
All staff report to work daily, punch in and punch out leaving traces of absence or presence which can be measured.
Absenteeism studied as a function of time for three months periods of Y2016. The studied covered factors affecting absenteeism such as departmental setups, zonal laboratories, skill levels, professions and gender.
Ad All staff have own academic development profile. Variations of Ad with time (Y2014, Y2016) for individual staff and by departments.
Lc All staff have measurable complex longevity within the FSL. Variations of Llaboratory units. c, Lct and Lst with time (Y2014, Y2016) for individual staff and
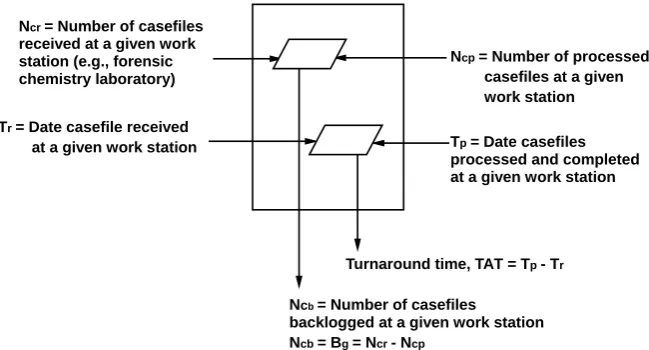
The identified six components of the total turnaround time (TTAT) were also identified, which in turn vary from one case-file to another [14]. Each time in-terval between action points was determined as the difference between receiving and completion of processing time in the same action points. The initial and fi-nal times were recorded in dates giving TAT values in days, as shown in Figure 3. For simplicity, during TAT analysis, some of the time intervals were com-bined to give one delay reducing the number of time intervals or action points from 20 to 6. Meanwhile, some actions could proceed in parallel (where the ref-erence date remains the same).
Based in Figure 3, the number of backlogged case-files was determined for each laboratory discipline, by comparing case-files in and case-files out, in a spe-cified time interval, say 7 days [5][14].
DOI: 10.4236/eng.2019.119042 613 Engineering Figure 3. Capturing the repetitions and differences in TAT and backlogs for case-files at each work station.
number of orders in the period studied, Nto, all the order processes falls in the cyclic nature and repetition, which fits well into the development of the CIF.
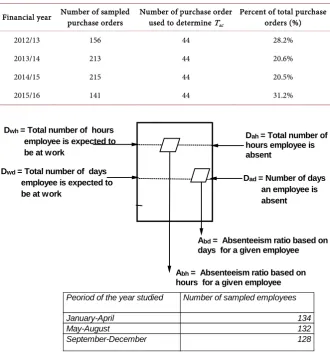
The supply cycle time, Tsc, including payments acknowledgement, was deter-mined as difference between date payments are made and acknowledged, Tpa and the date purchase order is requested by the user department, Tos. Table 2 summarizes the time variations by years studied and purchase order sampling details for determination of Tsc. Each purchase order processing undergoes the same cycle, based on which, variations in the cycle times were captured.
3.4. Variations in Staff Absenteeism
Measurements of absenteeism ratio, Ab, started with collecting data for individu-al employee on daily basis using the biometric system, from which, the ratio was expressed in terms of hours or days absent. For 192 staff logged into the system, this is a complex data set to manage [25]. Thus, the data was grouped into three time intervals (4 months), departments, units, gender, professions and skill le-vels to characterize and compare the average values. The determination of Ab is characterized by long time interval (3 months in this case), data screening to eliminate staff with special absence like study leave, maternity leave or sick leave, wrong data entry and errors, which reduces the sample size. The mathematical formulations implemented for absenteeism analysis can be summarized using a flow chart as shown in Figure 4, which shows two different outcomes of absen-teeism data analysis, that is, day-based and hour-based absenabsen-teeism (Abh and Abd, respectively) [25].
3.5. Variations in the Staff Academic Development
Another variation within the laboratory was identified in the staff academic de-velopment, experience and longevity which originate from individual employee data. The cyclic nature on this case stems from the fact that during employment
Ncp= Number of processed
casefiles at a given work station
Ncr= Number of casefiles
received at a given work station (e.g., forensic chemistry laboratory)
Tp= Date casefiles
processed and completed at a given work station
Tr= Date casefile received
at a given work station
Turnaround time, TAT = Tp- Tr
Ncb= Number of casefiles
backlogged at a given work station
DOI: 10.4236/eng.2019.119042 614 Engineering Table 2. Sampling details for case files used for supply cycle time analysis.
Financial year Number of sampled purchase orders Number of purchase order used to determine T sc
Percent of total purchase orders (%)
2012/13 156 44 28.2%
2013/14 213 44 20.6%
2014/15 215 44 20.5%
2015/16 141 44 31.2%
Figure 4. Flow chart for determination of employee absenteeism ratios Abh and Abd (based on 192 total employees).
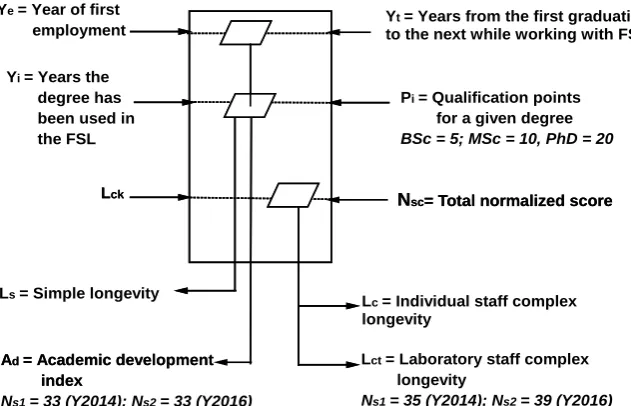
and working life, each individual staff is subjected to academic development and longevity, data of which was captured not only once but at different times (Y2014 and Y2016) for comparison [44]. Successful management of any labora-tory requires a great sense of self-awareness, commitment or engagement and the presence of the staff in the processes where academic development index, Ad, and complex longevity, Lc, play a vital role in performance and hence, competi-tiveness of the whole FSL as an organization. The parameters used to assess staff development (academic and professional development) are summarized in Fig-ure 5. These variations arise among employees and also change with time for in-dividual employees, specific FSL units or departments (total complex longevity or academic development index), which were used to develop the CIF. Thus variations in employee trails were captured as time possess while individual em-ployee data offers another variation analysis opportunity by comparing individ-ual staff, laboratory discipline, or zonal setting. The sample size (number of em-ployees in each period) used to study variations in the academic development and longevity is also summarized in Figure 5.
Dah = Total number of
hours employee is absent
Dwh = Total number of hours
employee is expected to be at work
Dad= Number of days
an employee is absent
Dwd = Total number of days
employee is expected to be at work
Abd= Absenteeism ratio based on
days for a given employee
Abh= Absenteeism ratio based on
hours for a given employee
Peoriod of the year studied Number of sampled employees
January-April 134
May-August 132
DOI: 10.4236/eng.2019.119042 615 Engineering Figure 5. Determination of academic development coefficient, Ad, and complex longevi-ty, Lc.
3.6. Methodology for Implementation of Pareto Analysis
Given the six cause factors measured and implemented in the CIF development process, each factor was assessed on its relationship with: a) challenges in the FSL business environment and b) applicability of the lean practices for improv-ing FSL competitiveness. The business environment challenges studies were 8 while the lean practices for CIF were 5, the so called variants. Let Nv = number of variants, that is, number of challenges in the business environment or number of lean practices (Nv = 8 and 5 respectively), and Ncf = number of cause factors measured and assessed for CIF development, that is, Ncf = 6. Then, using a scor-ing system of Ns= 1, 2 or 3 for low, medium and high connection between the cause factors and the challenges or practices respectively, the total score, Stot, for a given variant, was established based on Equation (1):
, 1
cf N
tot s i
i
S N
=
=
∑
(1)The total score values for each variant, were then used to establish the percen-tage frequency distribution, using Equation (2).
,
, 1
v tok k
d N
tot k k
S F
S = =
∑
(2)Finally, Pareto analysis was conducted by analyzing the Fd values.
4. Results and Discussion
4.1. Summary of Variations Captured in the Laboratory Processes
4.1.1. Variations in the Turnaround Time
Based on TAT analysis, the performance of FSL disciplines shows strong varia-tions between Y2014 and Y2015 as presented in Figure 6. For forensic chemistry,
Yt= Years from the first graduation
to the next while working with FSL
Ye= Year of first
employment
Nsc= Total normalized score
Lck
Ls= Simple longevity
Ad= Academic development
index
Lc= Individual staff complex
longevity
Pi= Qualification points
for a given degree BSc = 5; MSc = 10, PhD = 20
Yi= Years the
degree has been used in the FSL
Nsc= Total normalized score
Lck
Lct= Laboratory staff complex
longevity
Ns1= 35 (Y2014); Ns2= 39 (Y2016)
Ad= Academic development
index
DOI: 10.4236/eng.2019.119042 616 Engineering Figure 6. CDFs of laboratories analysis turnaround time data for different laboratory dis-ciplines in Y2014 and Y2015.
the number of case-files completed within one day of submission increased from 2% in Y2014 to 45% in Y2015. For biology/DNA, on the other hand, an opposite scenario was observed, as the performance decreased leading to very few case files completed in a given time of 50 days from 50% to only 35% of case files. For forensic toxicology, improved performance was observed, for instance, at a given
TAT2 of 50 days, 60% of case files were completed in Y2014 which increased to 85% in Y2015. Cases where performance dropped require intervention if the FSL is to remain at its competitive edge.
4.1.2. Variations in the Backlogged Case-Files
According to Figure 7, variations in the laboratory performance with time for each discipline are obvious. The laboratory backlogdata was assessed for each calendar year, from Y2014 to year Y2016. Figure 7 shows the cumulative distri-bution for Bg data for 52 weeks in each year. By drawing a vertical line at Bg = 10, using the collected data in three consecutive years, it is evident for DNA labora-tory that the backlogs increased between Y2014 and Y2015 and decreased be-tween Y2015 and Y2016. For forensic toxicology, backlogs increased bebe-tween Y2014 and Y2015 while in forensic chemistry, backlogs decreased. Thus, varia-tions in cause factors have been captured using data collection tools applied to the cyclic nature of the processes, allowing for identification of root causes and taking action to improve and sustain.
4.2. Harnessing Variations in Cause Factors for Competitiveness
Improvement
DOI: 10.4236/eng.2019.119042 617 Engineering Figure 7. Variations in the weekly backlogs for three consecutive years.
parameters or cause factors affecting competitiveness were studied in details and quantified between Y2014 and Y2016 so that improvements and sustainability can be measured in the next few years or later. This study is thus used as a defin-itive guide on what needs to be improved. Table 3 gives what is needed to im-prove based on the pre-determined performance factors and how to approach the improvements. In details, gives the key steps applicable to each cause factor starting from relevance of each factor to FSL, stakeholders and baseline or cur-rent status are given. Means of improving and sustaining competitiveness via these cause factors are also presented in Table 3. Finally, future plans for sus-taining competitiveness are also summarized.
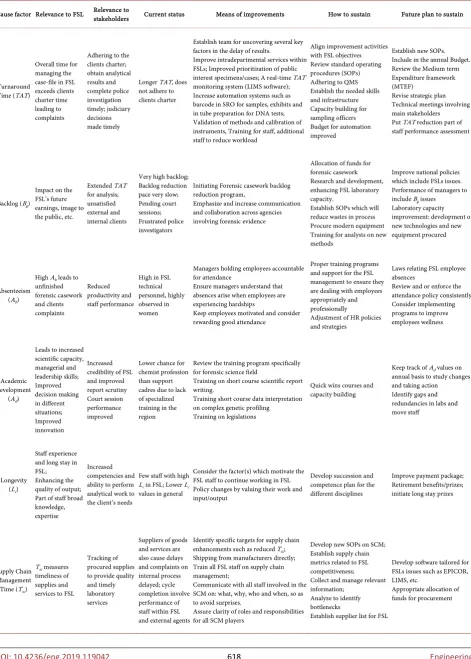
DOI: 10.4236/eng.2019.119042 618 Engineering Table 3. The relevance of cause factors of the FSL performance towards competitive improvement.
Cause factor Relevance to FSL Relevance to stakeholders Current status Means of improvements How to sustain Future plan to sustain
Turnaround Time (TAT)
Overall time for managing the case-file in FSL exceeds clients charter time leading to complaints
Adhering to the clients charter; obtain analytical results and complete police investigation timely; judiciary decisions made timely
Longer TAT, does not adhere to clients charter
Establish team for uncovering several key factors in the delay of results.
Improve intradepartmental services within FSLs; Improved prioritization of public interest specimens/cases; A real-time TAT
monitoring system (LIMS software); Increase automation systems such as barcode in SRO for samples, exhibits and in tube preparation for DNA tests; Validation of methods and calibration of instruments, Training for staff, additional staff to reduce workload
Align improvement activities with FSL objectives Review standard operating procedures (SOPs) Adhering to QMS Establish the needed skills and infrastructure Capacity building for sampling officers Budget for automation improved
Establish new SOPs. Include in the annual Budget. Review the Medium term Expenditure framework (MTEF)
Revise strategic plan Technical meetings involving main stakeholders Put TAT reduction part of staff performance assessment
Backlog (Bg)
Impact on the FSL’s future earnings, image to the public, etc.
Extended TAT
for analysis; unsatisfied external and internal clients
Very high backlog; Backlog reduction pace very slow; Pending court sessions; Frustrated police investigators
Initiating Forensic casework backlog reduction program,
Emphasize and increase communication and collaboration across agencies involving forensic evidence
Allocation of funds for forensic casework Research and development, enhancing FSL laboratory capacity.
Establish SOPs which will reduce wastes in process Procure modern equipment Training for analysts on new methods
Improve national policies which include FSLs issues. Performance of managers to include Bg issues Laboratory capacity improvement: development of new technologies and new equipment procured
Absenteeism (Ab)
High Ab leads to unfinished forensic casework and clients complaints Reduced productivity and staff performance
High in FSL technical personnel, highly observed in women
Managers holding employees accountable for attendance
Ensure managers understand that absences arise when employees are experiencing hardships
Keep employees motivated and consider rewarding good attendance
Proper training programs and support for the FSL management to ensure they are dealing with employees appropriately and professionally
Adjustment of HR policies and strategies
Laws relating FSL employee absences
Review and or enforce the attendance policy consistently Consider implementing programs to improve employees wellness
Academic development
(Ad)
Leads to increased scientific capacity, managerial and leadership skills; Improved decision making in different situations; Improved innovation Increased credibility of FSL and improved report scrutiny Court session performance improved
Lower chance for chemist profession than support cadres due to lack of specialized training in the region
Review the training program specifically for forensic science field
Training on short course scientific report writing.
Training short course data interpretation on complex genetic profiling Training on legislations
Quick wins courses and capacity building
Keep track of Ad values on
annual basis to study changes and taking action Identify gaps and redundancies in labs and move staff
Longevity (Lc)
Staff experience and long stay in FSL; Enhancing the quality of output; Part of staff broad knowledge, expertise
Increased competencies and ability to perform analytical work to the client’s needs
Few staff with high
Lc in FSL; Lower Lc
values in general
Consider the factor(s) which motivate the FSL staff to continue working in FSL Policy changes by valuing their work and input/output
Develop succession and competence plan for the different disciplines
Improve payment package; Retirement benefits/prizes; initiate long stay prizes
Supply Chain Management Time (Tsc)
Tsc measures timeliness of supplies and services to FSL
Tracking of procured supplies to provide quality and timely laboratory services
Suppliers of goods and services are also cause delays and complaints on internal process delayed; cycle completion involve performance of staff within FSL and external agents
Identify specific targets for supply chain enhancements such as reduced Tsc; Shipping from manufacturers directly; Train all FSL staff on supply chain management;
Communicate with all staff involved in the SCM on: what, why, who and when, so as to avoid surprises.
Assure clarity of roles and responsibilities for all SCM players
Develop new SOPs on SCM; Establish supply chain metrics related to FSL competitiveness; Collect and manage relevant information;
Analyze to identify bottlenecks
Establish supplier list for FSL
Develop software tailored for FSLs issues such as EPICOR, LIMS, etc.
DOI: 10.4236/eng.2019.119042 619 Engineering
4.3. Competitiveness Improvement by Managing the Dimensions
4.3.1. Dimensions of the FSL Competitiveness
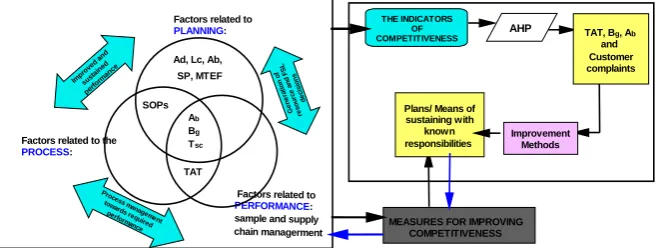
The competitiveness improvement framework involves individual staff, product (laboratory reports) and FSL services (receiving/processing exhibits, expert wit-ness and training for sampling officers). Single measures of competitivewit-ness (e.g. finance, SCM, etc.), do not capture all the elements of the research issue, it was necessary to examine performance, potential and management processes (shown in Figure 8), in order to evaluate critically the changes or level of competiveness and interrelationship. The Venn diagram in Figure 8 shows the interrelationship between the competitiveness dimensions based on the cause factors measured and analyzed in this study.
4.3.2. Competitiveness Improvement by Managing Performance in the Laboratory
Under this component, the study measured the status of Ad, Lc and Ab which are related to staff capability or tools to enable them push the organization towards competitive advantage, for the FSL to improve its performance. Managing the performance in FSL should be an ongoing communication process conducted which is carried out between the supervisors and the employees throughout the year. A system of managing the performance comprises of activities such as de-velopment of job descriptions within the different FSL disciplines and employee performance plans which includes the key result areas (KRAs) and performance indicators with respect to the cause factors: Ad, TAT, Tsc and Bg. Placement and staffing of the appropriate staff and providing continuous training and response during the period of delivery of performance is essential in performance man-agement.
[image:16.595.209.538.579.703.2]A performance management process sets the stage for fulfilling distinctions by supporting the FSL staff undertaking with the FSL mission and. The CIF is de-signed with the objective of improving both individual and FSL performance by identifying performance requirements with respect to the cause factors, provid-ing regular feedback and assistprovid-ing the FSL’s employees in their career develop-ment. It is also aimed at building a high performance culture for both individu-als and the FSL management team so that they jointly take the responsibility of
Figure 8. Interrelationship between the dimensions of FSLs competitiveness. MEASURES FOR IMPROVING
COMPETITIVENESS Factors related to
PERFORMANCE: sample and supply chain managerment Factors related to the
PROCESS: Impr oved and sus tained perfo rman ce Proce ss m anag em ent tow
ards requi red perform ance G e ne ra ti o n o f re s our c e a nd FS L d e c is io n s THE INDICATORS OF COMPETITIVENESS Factors related to
PLANNING: AHP
Improvement Methods Plans/ Means of
sustaining with known responsibilities
TAT, Bg, Ab
and Customer complaints Ab Bg Tsc SOPs TAT Ad, Lc, Ab,
DOI: 10.4236/eng.2019.119042 620 Engineering improving the business processes on a continuous basis and at the same time raises the competence bar by upgrading their own skills within a leadership framework.
The sole purpose of a performance management system for a given laboratory is to assess and ensure that the employees are carrying out their duties in an ef-fective and satisfactory manner. The performance of the employees can be im-proved by inspiring employee empowerment, incentive and operation of an ef-fective reward mechanism. In addition, identifying the obstacles towards effec-tive performance and resolving those obstacles through continuous monitoring, training and development involvements will create a basis for several adminis-trative decisions, strategic planning, business plans, succession and competence plans, academic development plans, etc. Also, encouraging personal growth and advancement in the career of the employees by helping them in acquiring the desired knowledge and skills may increase the staff performance and hence competitiveness of the FSL [44].
These factors identified and shown in Figure 8 and Table 3 and Table 4 de-mand a lot from the human resource team, all of which are based on perfor-mance management issues. Thus, perforperfor-mance management is much of a com-prehensive and a complex function, as it incorporates activities such as mutual goal setting, continuous progress assessment and regular communication, re-sponse and training for improved performance and implementation of employee development plans. In addition, FSL employees should continually be seeking ways to improve their own performance, to take ownership for their work, and reinforce team working, thereby improving worker motivation.
4.3.3. Improving Competitiveness via Management of Laboratory Processes
Another aspect of CIF portrayed in Figure 9 is process management, a concept that integrates quality, performance and excellence during accomplishing the tasks in the laboratory that connects the organization with clients (processes). The process parameters identified in this study include TAT, Bg, and Tsc. These parameters should be managed while focusing at CIF as they connect with the outside customers or stakeholders.
DOI: 10.4236/eng.2019.119042 621 Engineering Figure 9. Pareto analysis for ranking the business environment challenges for competi-tiveness improvement in the FSL.
Table 4. Process management remarks with respect to cause factors.
Processes Remarks
Customers of the process
It is about understanding the customers, their needs and how to provide the services. The customers of a process are the people who require the products and services. Classified as: external customers (or people who consume the products and/or services of the FSL) and internal customers (the owners of the next phases in the process within the FSL).
Customer/supplier relationship
Concepts relating to client/supplier relationships and satisfaction are the right to expect quality products and services to internal or external client. The FSL employees are considered as the next phase in the process employees or the internal client. Also, each team (individual and team performance) should treat one another as valuable to bring improvement. In addition, the customer shall determine the product or service satisfaction level and the value expected from the supplier.
Relationship to quality, schedule and cost
Evaluating and improve processes by establishing process baselines for quality, schedule, and cost. It is about highest quality products and services on or ahead of schedule and at the lowest possible price which are interdependent. In order to satisfy and retain its external customers, FSL should be competitive based on analysis and supply chain turnaround time by providing real-time information to internal and external customers. Design and simplify with minimal non-value activities for the customers such as defects or constraints. Modify the models based on progressive decision making, with coexisting engineering management. In addition, empower workers to undo time-wasting bureaucracy.
The process owners The process owners are the analysts (chemists and technologist) who understand about the processes which accomplish all activities in action point and accept accountability. Thus, process assessment and development should be done per day so as TAT reduction to become a reality.
How to improve Knowledgeable and accountable employees of the process are process owners. However, criticism from customers and suppliers contributes an unlimited need for improvement.
Responsible for
improvement process Improvement is gradual and continuous, intense process redesign or re-engineering, and should be the basic part of process management and improvements.
radical changes. Ideas for such changes come from the workers themselves based on the talents of the existing workforce and therefore easier to implement. Also, such changes involved in process management should not require major capital investment, consultants or expensive equipment.
[image:18.595.58.543.306.604.2]DOI: 10.4236/eng.2019.119042 622 Engineering end that can be replicated, conceptual models for TAT, Tsc and Bg, were estab-lished [5][14]. The FSL was viewed as a set or hierarchy of laboratory processes that yield analytical reports and services of value to the criminal justice system and investigative science, as well as a set of functions such as chemical or genetic profiling, expert witnessing, accounting, procuring of supplies or services, train-ing and capacity buildtrain-ing. Table 4 summarizes the process remarks with respect to the cause factors in relation to arrangement of processes.
For the laboratory to experience the highest levels of success and hence com-petitiveness, external and internal customers must be satisfied. Each laboratory staff (chemists, accountants and technologists) have the duty to understand their roles as suppliers to internal and external customers. Principally, customers want to be their suppliers' first priority. They deserve perfect analytical reports, which delivered on or ahead of schedule (client’s charter). They expect suppliers to be in the improvement mode of operation so that the criminal justice system and the investigative science field are assured of a competitive third opinion expert advice to bring justice.
Process management has potential for improvement. The FSL management should focus on current issues to avoid performing analysis using old methods which are of no use to the criminal justice system. Furthermore, focus may be on quality, whereas reduced turnaround time is crucial. In addition, determining the supplier performance using rating system based on quality, capabilities, conformance to requirements is an important role in process performance mea-suring.
4.4. The Role of Policies, Procedures and Plans on
Competitiveness Improvement
The third component of CIF presented in Figure 3 is the role of policies, proce-dures, programs and plans (strategic plans, staff training program, improvement programs, expenditure framework, etc.). The competitiveness and service viabil-ity of forensic science services (FSS) industry as well as its disciplines can poten-tially be enhanced by planning strategically for future. Laboratory strategic plan-ning, especially in the selected priority disciplines can help set the stage for ap-propriate responses to the many dynamic changes and driving forces that impact the FSS industry. The FSS strategic planning must take into consideration the laboratory complexities, necessitating comprehensive perception.
DOI: 10.4236/eng.2019.119042 623 Engineering
4.5. Identification and Elimination of Wastes in the FSL Processes
Anything that doesn’t increase value in the laboratory processes and in the per-ception of the customers must be considered as waste and every effort should be made by the management to eliminate that waste. By understanding the different types of waste within the laboratory it is possible to eliminate or reduce impact of such steps to the performance and competitiveness. In this study, such wastes were reached at after detailed analysis of the cause factors, as summarized in Ta-ble 5.4.6. Effect of Laboratory Business Environment on Measured
Cause Factors
Services offered that differentiate FSL from other organizations are those that are associated with criminal justice. While the rest of laboratory services are sub-jected to competition. Commercial or private laboratories, research cum training laboratories, other government laboratories, are likely to give stiff competition to the FSL. Any laboratory is regarded as competitive if its services consider priori-ty to regular customers, prioripriori-ty services with additional charges for faster ser-vices, discount on the cost, and continuous improved/innovative quality servic-es. Also, quick and short delivery of services at reduced waiting time through a provision of mistake-proof or error-free services is a key to competitiveness. The CIF parameters shown in Table 6 were identified through data collection and application of the AHP methodology in ranking the factors. Table 6 shows the importance of the cause factors towards competitiveness and category of indica-tors to be utilized. The categories denoted as A, B and C have the following ex-tended description: A—Outcome indicators that capture the final objectives of policy; B—Fundamental factor of competitiveness that structurally drives out-comes and which are core levels for policy intervention that can have sustainable impact; and, C—Control indicators that capture potential imbalance that have the potential to create high short term costs even if they don’t drive outcomes in the long run.
During development of the CIF, it was important to characterize the cause factors in relation to whether improvements can lead to increased customer awareness and satisfaction, increased number and strength of customer specifi-cations or increased purchase power of customers. Moreover, the cause factors were assessed and rated in relation to coping with fast changing technology, large number of competitors, newer business models and practices, and also on the need for improved business infrastructure. Newer business models in the public laboratory like FSL are difficult to implement, giving chance to competi-tors in implementing such models like private sector and research institutions, laboratories. The last rating was focused on whether the cause factors are af-fected by frequently changing government policies or increased cost of man-power in order to improve, as shown in Table 7.
DOI: 10.4236/eng.2019.119042 624 Engineering Table 5. Wastes identified in FSL processes and possible means of elimination.
The waste Definition Possible means of elimination
Waiting
Analysis work in the process has stopped due to bottlenecked operations, equipment changeover and services
Also, system response time, approvals from the laboratory manager may take long depending on the type of case and samples involved (such as challenging samples)
Administrative duties for Director may delay approval of reports Lack of supplies-reagents and other consumables may cause delay in laboratory processes
Equipment reliability such as Genetic analyzer,
LCMS/MS through Total Productive Maintenance (TPM) with service contract as part of SCM
Adequate staffing at the bottlenecked operations such as
Backlog Reduction
Improve system reliability-scientific report capacity
building
Push decision-making down to lower levels, that includes the users, technologists
Cross-train employees so that work can continue in
absence (e.g. top managers)
Reduce batch sizes and run them more frequently, ultimately shooting for a batch size of one
Make sure all supplies are available Increase number of identification equipment
Over- production
Printing analytical report before completing analyzing all the
data
Purchasing items such as reagents and other perishables that
are consumed seasonally or before they are needed
Producing reports that are not needed Purchasing equipment that are rarely used
Over staffing in some areas
High sample influx and too many case-files arriving in short
period of time
Establish a flow sequence to satisfy the downstream
customer or supervisor (manager)
Create workplace SOPs, guidelines and regulations for
each process
Create signal devices to prevent over processing, e.g.
FIFO lanes
Defects
Cross contamination, wrong labeling or overheating in
re-amplification due to power interruption.
Multiple profile, contaminated STR profile Mischaracterization of drugs of abuse
Defective or degraded biological samples
Inoperative machines lying without service or maintenance
Error-proof steps-working in set of two individuals
Decontamination of working bench and the FS
laboratory processes
Good laboratory practices especially Checklists Stocktaking of functioning instruments and equipment
Establishing and maintaining the service contract Preventive maintenance schedule adhered according to
manufacturer and installation engineer
Under-utilized human resources
People’s creativity, ideas, and abilities are not fully tapped Limited employee authority and responsibility for basic tasks,
management command and control
Losing ideas, skills, and improvements by not listening to
employees
Institute the academic development program and
consider tapping the employees with high complex longevity
Initiate employee suggestion systems Form teams to solve process problems
Excess processing
Processing of more samples or duplicate samples of the same
case-file
Taking unneeded steps to process the samples that have shown
to have no trace of searched chemical or low DNA
Inefficient processing due to poor tool and product design Also, re-entering data, extra copies, unnecessary or excessive
reports
Lack of statistical or arbitrary resampling techniques for
similar items such as pellets or sachets of drugs of abuse
Perform preliminary/presumptive tests before
undergoing into the major processes
Remove unnecessary steps
Use design for as manufactured for the specific instrument with the specified ratios
DOI: 10.4236/eng.2019.119042 625 Engineering
Continued
Transportation
Movement of work or paperwork, sample, from one step to the
next step in the analytical process or from one place to the other
Long distance movement between buildings or time consumed
to reach the next location for processing
Sample management-proper packaging and storage for
sample transportation
Make the distance over which something is moved as
short as possible
Consider work cells and co-located teams
Establish chain of possession forms and adhere chain of
custody and sample integrity
Inventory
Any supply that is in excess or less, hence performing
stocktaking to avoid pending cases, creating backlogging. Any form of batch processing
Producing more profiles, analytical or computing statistical
data, than customer demand or submission
Movement of people, staff reallocation and placement
Purchase only enough to satisfy your downstream sample process and what is submitted to the laboratory
Ensure that work arrives at the downstream process when it is required and does not stay pending or put away for storage
Reducing batch sizes eventually to a batch size of one
where necessary, thus reducing the amount of reagent usage
Create print on demand processes for reports and documents for the specific sample/exhibit of the case-file reducing stationary usage
Motion
Movement of analysts during processing Use of network for
data transfer
Limitation of staff from different work areas into other
restricted or private
Arrange work areas to reduce movement
Consider cell type processing (each process to have its own cubicle)
Part trays located close to the worker
Provide extra fax, copy machines and computers and
locate files at work stations
Use color codes as much as possible to differentiate
[image:22.595.59.538.464.738.2]processing areas or laboratory coats
Table 6. Measured cause factors identified to affect FSL competitiveness.
Parameter Importance towards competiveness improvement Category of indicators
Backlog, Bg Customer focus. Employee fatigue, frustration and complaints from the public. A, C
Turnaround time, TAT Quality, capacity, customer focus. Important influence on competitiveness. A, C
Absenteeism, Ab
Individual component, culture and trust for analysts; individual behavior and interactions between individuals are the core aspects of productivity. Denotes also interactions between individuals and
organization. A, B, C
Academic development index, Ad
Adequately trained human capital is required to support business activities as well as to develop
innovative capacity and entrepreneurship. A, B
Complex longevity, Lc Knowledgeable and experienced employees over FSL processes are required to carry out and supervise others completely, without the negative aspects of longevity. B
Supply chain time, Tsc
Tracking of procured supplies such as reagents, and instruments to obtain proper resources and provide quality and timely forensic services. Starting from the time the order request is placed by the user department within FSL to the time the order is supplied and payment is made and acknowledged by the supplier. It is the overall efficiency of the supply chain.
DOI: 10.4236/eng.2019.119042 626 Engineering Table 7. Rating of the cause factors based on applicability of competitiveness challenges in the FSL business environment (√√√ = high, √√ = medium, √ = low).
Cause factor Increased customer awareness
Increased customer specifications
Increased purchase power
of customers
Fast changing technology
Large number of competitors
Newer business models and
practices
Need for improved infrastructure
Frequently changing
policies
Increase cost of manpower
Backlog, Bg √√ √√ √√ √√ √√ √ √ √ √√√
Turnaround
time, TAT √ √√ √√√ √√√ √√ √ √√ √√ √√√
Absenteeism, Ab √ √ √√ √ √√ √ √ √√√ √√
Academic development
index, Ad √√ √ √√√ √√√ √√√ √ √ √√√ √√√
Complex
longevity, Lc √√√ √√ √√√ √√ √ √ √ √√√ √√
Supply chain
time, Tsc √ √ √√ √√ √√ √ √ √√√ √
Total score 10 9 15 13 12 5 7 15 14
was possible to arrange the challenges in descending order, and apply Pareto analysis, as summarized in Figure 9. Based in Figure 9, there are five challenges in the business environment that the laboratory needs to address first in order to improve its competitiveness by 80% while utilizing 20% of the rather limited re-sources. These challenges are: increased purchase power of customers; frequent-ly changing government policies; increased cost of manpower; fast changing technology; large number of competitors; and, increased customer awareness, in that order of importance. The last three challenges, contribute only 20% of the problems facing the competitiveness of the laboratory.
Furthermore, Table 8 shows the means of which the above nine challenges in the business environment affect FSL via the six cause factors identified and meas-ured in this study. The business environment challenges are also arranged in the same order as presented in the Pareto chart (Figure 9).
4.7. Application of D-MAIC Methodology in Competitiveness
Improvement
DOI: 10.4236/eng.2019.119042 627 Engineering
Table 8. Summary of recommendations for the business environment challenges for competitiveness improvement in the FSL
based on cause factors.
Cause factor Increased customer awareness Increased customer specifications Fast changing technology Large number of competitors Newer business models and practices Need for improved infrastructure Frequently changing policies
Increase cost of manpower
Backlog, Bg
Customers aware of Bg on FSL will non away to competitors
When customer specify their requirements and FSL falls into Bg and Ab
high customer will run away
Bg can be eliminated by enquiring new equip new methods Extended Bg will have
no excuse before customers
Extended TAT will have no excuse
FSL will need to procure new equip that are faster
High Bg will turn customers to other service to other service providers (competitors)
Bg will show down FSL to enter new business practices
This factor has to be eliminated or reduced to minimal to improve business
Government may reactively to Bg, packing FSL to accountability Government
policies may put Bg
on spotlight Need for Expert
witness (EW) to appear in courts at increased number of criminal case forces FSL to have high Bg
FSL and Government unable to provide more staff to lower Ab
due to high cost of salaries for such specific experts
Turnaround time, TAT
Slight extended
TAT leads to complaints Poor FSL image
on average customers
Customer specifies TAT
and fast tests if
TAT is still too long, they run away
Extended TAT have no excuse
FSL will need to procure new equipment that are faster
With available service providers at disposal customers will opt for shorter
TAT services
The customers will run away where service providers offer new business models/ practices FSL will be
forced to abandon its old model for business or perish
To improve its business FSL must tower
TAT; Expenses may
fall on new equipment and increased number of staff
Transfer of staff with high Lc, Ad will
affect FSL FSL be coming on
government spotlight will be forced to reduce
TAT at any expense This puts FSL at
pressure which may lead to errors
Longer TAT caused by lack of manpower may lead to expenses on increased labor force
Increasing staff without increasing supervisors may not help
Always time is re for new workforce
Absenteeism,
Ab
Leads untimeliness of services will lead complaints and tarnished image of FSL and poor competitiveness
High Ab leads
to unmet customer specification and demands
Available technologies for tacking Ab
New equip can be used to produce fast results and counteract
Abeffects
New service providers with high-tech equipment With high Ab,
customers will opt for new service providers
Increased Ab will
allow customers to opt for competitors to get services
High Ab hinders changes in business model and new practice Competitors
with new business models and practices may arise and gain customer support due to high Ab in FSL
Business can be improved if
Ab is reduced
to minimal Policy changes
are needed by FSL to curb Ab
and improve FSL business
Policy to curb Ab in government institutions has helped FSL to curb Ab
This will improve FSL’s competitiveness
High Ab implies receiving payments without working Cost of empower
escalates due to high
Ab as output is
lowered for the same pay
Academic development index, Ad and Complex longevity, Lc
High Ad will help to wider customer’ needs
Advanced technical reports
High Ad, with staff advanced in academic development, they will be able to address customer specification received, and provide advice consultancy
• Able to cope with fast changing technical when
Ad is high • Able to use new in struments/equipment • Able to diagnose errors and design corrective action
• Capable of setting up trouble shooting exercises
Able to maintain the competitive edge even in presence of competitors
High Ad will allow design of resent models but also to cope with new business practices Capable of playing important role Business improvement possible as high
Ad will allow staff to measure current status, analyze fund bottlenecks and find root causes
Capability to cope with changing polices high when Ad
is high among employees
High Ad calls for higher salaries and hence increased manpower cost It is a give and take phenomena Ensure Ad
corresponds with performance and increased revenue to create balance
Supply chain time, Tsc
Suppliers are aware of their rights Tcs
for internal process must improve State supplier obligations clearly in contracts , a prior,
Tsc for external process must improve
FSL must state specification precisely for suppliers and stick to procedures
Improvise new systems to take advantage of technology and shorten
Tsc for the Labs to receive
services/goods on time; this will help FSL at competitive advantage
Long Tsc will pare way to competitors as FSL services are not provided on time
Extended Tsc will
not fit into new business models leading to last competitors
Reduced Tsc will lead to improve business
Tsc need to change,
and minimize Tscto
cope with government policies New regulation
place
Increase manpower in PMU unit Centralize SCM Incur manpower
DOI: 10.4236/eng.2019.119042 628 Engineering
Figure 10. Simple flow chart for competitiveness improvement for FSL
based on D-MAIC methodology.
format, [5][14][25][44] showing the criticality of current situation and action required. At this point, it is important to establish a need to redesign or re-model the existing conceptual model of the FSL system or there is a specific cause factor that has to be corrected. Analysis was followed by remodeling or optimization, before improvement and control. In this case control means maintaining the improved system to prevent the system from going back to the initial poor state (sustainability). Table 9 shows the competitiveness improvement framework developed using the detailed D-MAIC methodology for the FSL.
Based in Table 9, the competitiveness improvement framework has been pre-sented in five key steps of D-MAIC but also using 15-step processes with highly detailed process analysis for each step in relation to the cause factors established. The possible measures for improving competitiveness can then be introduced or an optimum can be used for the existing situation suggested as per concepts in