Umar Rashid
A Thesis Submitted for the Degree of PhD at the
University of St. Andrews
2012
Full metadata for this item is available in Research@StAndrews:FullText
at:
http://research-repository.st-andrews.ac.uk/
Please use this identifier to cite or link to this item: http://hdl.handle.net/10023/3193
This item is protected by original copyright
Mobile Interaction with Large Displays
PhD Thesis
by
Umar Rashid
School of Computer Science
University of St Andrews
Mobile devices equipped with features (e.g., camera, network connectivity and media player) are increasingly being used for different tasks such as web browsing, document reading and photography. While the portability of mobile devices makes them desirable for pervasive access to information, their small screen real-estate often imposes restrictions on the amount of information that can be displayed and manipulated on them. On the other hand, large displays have become commonplace in many outdoor as well as indoor environ-ments. While they provide an efficient way of presenting and disseminating information, they provide little support for digital interactivity or physical accessibility. Researchers argue that mobile phones provide an efficient and portable way of interacting with large displays, and the latter can overcome the limitations of the small screens of mobile devices by providing a larger presentation and interaction space. However, distributing user inter-face (UI) elements across a mobile device and a large display can cause switching of visual attention and that may affect task performance.
device as well as on the large display, versus those shown only on the large display, is faster despite the cost of initial attention switching in the former. On the other hand, a hybrid UI configuration where the visual output is distributed across the mobile and large displays is the worst, or equivalent to the worst, configuration in all the visual search tasks. A mo-bile device-controlled large display configuration performs best in the map search task and equal to best (i.e., tied with a mobile-only configuration) in text- and photo-search tasks.
I, Umar Rashid, hereby certify that this thesis, which is approximately 40,000 words in length, has been written by me, that it is the record of work carried out by me, and that it has not been submitted in any previous application for a higher degree.
I was admitted as a research student in September 2010 and as a candidate for the degree of Doctor of Philosophy in September 2010; the higher study of which this is a record was carried out in the University of St Andrews between 2010 and 2012, (and in University College Dublin between 2007 and 2010).
date signature of candidate
I hereby certify that the candidate has fulfilled the conditions of the Resolution and Regu-lations appropriate for the degree of Doctor of Philosophy in the University of St Andrews and that the candidate is qualified to submit this thesis in application for that degree.
date signature of supervisor
to the thesis. We have obtained any third-party copyright permissions that may be required in order to allow such access and migration, or have requested the appropriate embargo below.
The following is an agreed request by candidate and supervisor regarding the electronic publication of this thesis:
Access to Printed copy and electronic publication of thesis through the University of St An-drews.
signature of candidate signature of supervisor
I have had the opportunity of interacting and working with some remarkable people during my doctoral research. I would like to express my thanks to all of them whose contribution and encouragement has played a crucial role in the accomplishment of this work.
First of all, I am highly indebted to my advisor Prof. Aaron Quigley for giving me the opportunity to pursue my doctoral research under his supervision. Working with him im-mensely helped refine my ideas and hone my presentation skills. His inquisitiveness, en-thusiasm and ambition has always been a source of inspiration for me.
Similarly, I was really blessed to have Dr. Miguel A. Nacenta as my co-advisor whose meticulous approach to problem solving I found both challenging and enlightening. I have learnt a great deal about the pitfalls of experiment design and data analysis from him.
I want to thank Lucia Terrenghi and Thomas Lang who supervised my internship at Vo-dafone Group Research in Munich (Germany). I am grateful to Jonna H¨akkil¨a for giving me the opportunity to do an internship with her team at Nokia Research Center, Tampere (Finland). Special thanks to my former colleagues at Nokia Research Center, Jarmo Kauko and Antti Virolainen.
Big thanks to Prof. Patrick Baudisch, Dr. Hrvoje Benko and Prof. Sriram Subramanian for being part of the doctoral panel of ITS 2010 conference and sharing their insightful comments and critiques for driving my research.
Thanks to my other colleagues at St Andrews Human Computer Interaction (SACHI) lab: Tristan Henderson, Jakub Dostal, Luke Hutton, Shyam Reyal. It has been a pleasure to work with all of you.
Much credit is due to Dr. Katharine Preedy of Mathematics and Statistics Support Net-work at University of St Andrews for helping me comprehend the intricacies of statistical analyses. And to Dr. Marie Robinson for proof-reading parts of my thesis.
Some ideas presented in this thesis have already been published in some of the following papers.
[1] RASHID, U., KAUKO, J., H ¨AKKILA¨, J., AND QUIGLEY, A. Proximal and dis-tal selection of widgets: Designing distributed UI for mobile interaction with large display. InProceedings of the International Conference on Human Computer Inter-action with Mobile devices and services(New York, NY, USA, 2011), MobileHCI ’11, ACM, pp. 495–498.
[2] RASHID, U., NACENTA, M. A., AND QUIGLEY, A. Factors influencing visual attention switch in multi-display user interfaces: A survey. In Proceedings of the 2012 International Symposium on Pervasive Displays(New York, NY, USA, 2012), PerDis ’12, ACM, pp. 1–6.
List of Figures vi
List of Tables ix
1 Introduction 1
1.1 Motivation . . . 2
1.1.1 Mobile Phones: More than Telecommunication . . . 3
1.1.2 Limitations of Mobile Displays . . . 4
1.1.3 Large Displays: More than Household Items . . . 4
1.1.4 Coupling Mobile Displays with Large Displays . . . 5
1.1.5 Distribution of User Interfaces . . . 6
1.1.6 Attention Switching in Distributed User Interfaces . . . 6
1.2 Problem Statement . . . 7
1.3 Research Approach . . . 8
1.4 Thesis Statement . . . 9
1.5 Scope of Thesis . . . 9
1.6 Thesis Contributions . . . 10
1.7 Thesis Organisation . . . 11
2 Background 14 2.1 Definitions . . . 15
2.1.1 Multi-Device Environment . . . 16
2.1.2 Multi-Display Environment . . . 16
2.1.3 Device Interoperability . . . 17
2.1.4 Multi-Display User Interface . . . 17
2.2 Usage of Multiple Devices . . . 18
2.3 Computing Paradigms for Device Interoperability . . . 19
2.3.1 Ubiquitous Computing . . . 19
2.3.2 Activity-Based Computing . . . 20
2.3.3 Recombinant Computing . . . 21
2.3.4 Synergy of Multiple Devices . . . 22
2.4 Multi-Display User Interfaces . . . 24
2.5 Human Vision and Characteristics of Displays . . . 26
2.5.1 Foveal Vision . . . 26
2.5.2 Peripheral Vision . . . 27
2.5.3 Visual Field . . . 27
2.5.4 Perceptual Resolution . . . 28
2.5.5 Useful Field of View (UFOV) . . . 28
2.5.6 Eye Movements . . . 28
2.5.7 Display Characteristics . . . 30
2.5.8 Physical Navigation . . . 32
2.5.9 Virtual Navigation . . . 32
2.5.10 Summary . . . 33
2.6 Task Performance with Large Displays . . . 33
2.7 Navigation Patterns with Displays . . . 35
2.7.1 Egocentric . . . 35
2.7.2 Exocentric . . . 36
2.7.3 Virtual . . . 36
2.7.4 Summary of Navigation Patterns . . . 36
2.7.5 Attention Switching & Navigation Patterns . . . 36
2.8 Summary and Discussion . . . 38
3.1 Taxonomies for MDUIs . . . 40
3.1.1 Configuration of Multiple Displays . . . 41
3.1.2 Taxonomy for Mobile Interaction . . . 41
3.1.3 Taxonomy for Private Mobile Devices and Public Situated Displays 42 3.1.4 Taxonomy of Multi-person-display Ecosystems . . . 43
3.1.5 Taxonomy of Cross-Display Object Movement Techniques . . . 44
3.1.6 Model of Distributed Interaction Space . . . 44
3.2 Taxonomy Based on Visual Arrangement of Multi-Display User Interfaces (MDUIs) . . . 45
3.2.1 Display Contiguity . . . 46
3.2.2 Angular Coverage . . . 55
3.2.3 Content Coordination . . . 57
3.2.4 Input Directness . . . 60
3.2.5 Input-Display Correspondence . . . 62
3.3 The Scope of the Thesis & Taxonomy of MDUIs . . . 65
3.4 Summary and Discussion . . . 65
4 Proximal and Distal Selection of Widgets for Mobile Interaction with Large Displays 66 4.1 Related Work . . . 68
4.2 Experiment . . . 69
4.2.1 Apparatus . . . 69
4.2.2 Participants . . . 70
4.2.3 Task . . . 70
4.2.4 Design . . . 71
4.2.5 Hypotheses . . . 72
4.3 Experimental Results . . . 73
4.3.1 Task Completion Time . . . 73
4.3.2 Error Rate . . . 74
4.3.4 Subjective Evaluation . . . 77
4.3.5 Overall Preference . . . 78
4.4 Discussion . . . 79
4.4.1 Limitations . . . 79
4.4.2 Lessons for Practitioners . . . 80
4.5 Conclusion . . . 81
5 Visual Search with Mobile, Large Display and Hybrid Distributed UIs 83 5.1 Related Research . . . 85
5.1.1 Distributed and Multi-device User Interfaces . . . 85
5.1.2 Studies on Distributed Interaction . . . 85
5.1.3 Issues in Mobile-Large Display Interactive Scenarios . . . 86
5.2 Empirical Study . . . 87
5.2.1 Apparatus . . . 87
5.2.2 Conditions . . . 88
5.2.3 Measures . . . 89
5.2.4 Participants . . . 90
5.2.5 Procedure . . . 90
5.2.6 Data Filtering . . . 91
5.3 Experiment: Map Search . . . 91
5.3.1 Hypotheses . . . 92
5.3.2 Results . . . 94
5.3.3 Summary . . . 99
5.4 Experiment: Text Search . . . 100
5.4.1 Hypotheses . . . 102
5.4.2 Results . . . 102
5.5 Experiment: Photo Search . . . 107
5.5.1 Hypotheses . . . 108
5.5.2 Results . . . 108
5.6.1 Distributing visual output across displays has a cost . . . 112
5.6.2 Tasks and UI Configurations . . . 114
5.6.3 Large display indirect vs. small display direct . . . 115
5.6.4 Limitations . . . 116
5.6.5 Lessons for Practitioners . . . 117
5.7 Conclusion . . . 118
6 Conclusion and Future Work 120 6.1 Research Objectives . . . 120
6.2 Summary of Experimental Results . . . 121
6.3 Contributions of Thesis . . . 122
6.3.1 Taxonomy of Multi-Display User Interfaces (MDUI) . . . 123
6.3.2 Analysis of Cross-Display Switching for Multiple Widget Selection 123 6.3.3 Analysis of Cross-Display Switching for Visual Search . . . 124
6.3.4 Lessons for Practitioners . . . 124
6.3.5 Minor Contributions . . . 125
6.4 Limitations and Future Work . . . 126
6.4.1 Input Mechanisms . . . 126
6.4.2 Tasks . . . 127
6.4.3 Modality of Feedback . . . 128
6.4.4 Visual Arrangements of Output . . . 129
6.4.5 Multi-User Scenarios . . . 130
6.4.6 Hybrid Navigation Patterns . . . 130
6.4.7 Computational Model of Attention Switching . . . 131
6.4.8 Next-Generation Operating Systems . . . 132
6.4.9 Participants . . . 132
6.4.10 Multi-displays in the Wild . . . 133
6.5 Concluding Remarks . . . 133
1.1 Emergence of Different Paradigms of Computing. . . 2
1.2 Distributed User Interfaces Across Mobile Devices and a Large Display. . . 6
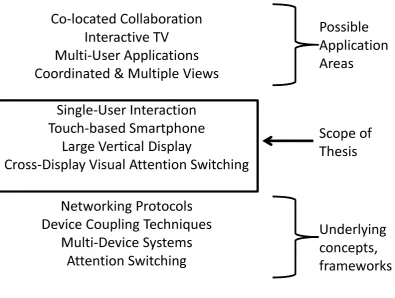
1.3 Scope of Thesis. . . 10
2.1 Multi-Device and Multi-Display Environments. . . 17
2.2 Computational Activity. . . 21
2.3 Speakeasy. . . 22
2.4 Device Ensembles. . . 23
2.5 A multi-display whiteboard system. . . 25
2.6 Object size, viewing distance and visual angle. . . 31
2.7 Continuum of Attention Switching in Egocentric Navigation. . . 38
3.1 Display Contiguity in Multi-Display User Interfaces. . . 47
3.2 Visual Field & Depth Contiguous: Siftables. . . 48
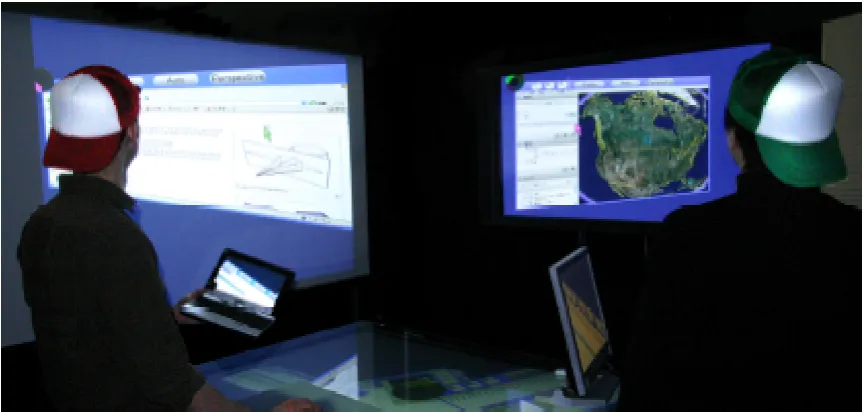
3.3 Visual Field & Depth Contiguous: Dual-projected vertically tiled arrange-ment in Dynamo. . . 48
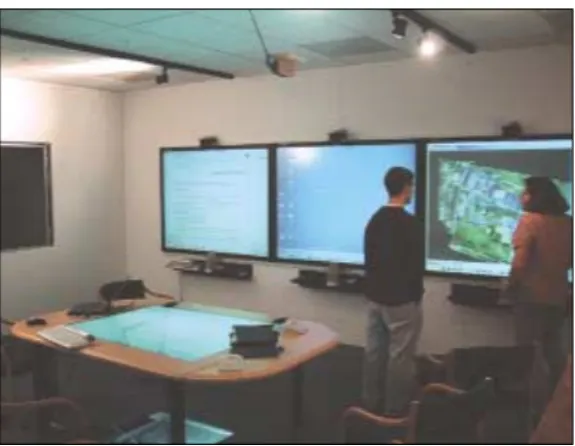
3.4 iRoom: Large data wall with a multi-user multi-touch tabletop. . . 49
3.5 Visual Field Discontiguous & Depth Contiguous: SyncTap operations for multiple devices. . . 49
3.6 Visual Field Contiguous & Depth Non-contiguous: Econic perspective-aware UI. . . 50
3.7 Visual Field Contiguous & Depth Non-contiguous: Ubiquitous Graphics. . 51
3.8 Visual Field & Depth Discontiguous: wall and tabletop display in Dynamo. 52 3.9 WeSpace: Large data wall with a multi-user multi-touch tabletop. . . 52
3.10 Angular Coverage in Multi-Display User Interfaces. . . 57
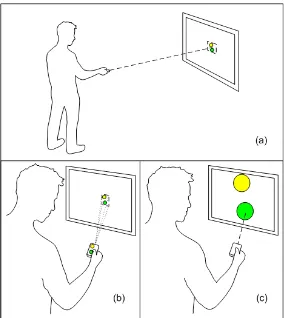
4.1 Proximal and Distal Selection of Widgets. . . 67 4.2 Mobile device: Wiimote circuit board attached to the back cover of N900
mobile phone. . . 69 4.3 Completion time for different number of widgets with Distal Selection
(DS) and Proximal Selection (PS). Error bars indicate 95% confidence in-tervals. . . 74 4.4 Error rate for Distal Selection (DS) and Proximal Selection (PS) with
dif-ferent widget sizes. Error bars indicate 95% confidence intervals. . . 75 4.5 Scatterplot of completion time against number of widgets with regression
lines for Distal Selection (DS) and Proximal Selection (PS). . . 76 4.6 Scatterplot of standardised residuals against standardised fitted values of
completion time for Distal Selection (DS) and Proximal Selection (PS). . . 77 4.7 User ratings of the DS and PS techniques with respect to physical effort. . . 78
5.1 Hybrid Configuration for Information Seeking. . . 84 5.2 Map search task on mobile and large display (hybrid configuration).
De-vices are not to scale. . . 89 5.3 Map search: mean completion times with different UI configurations and
data sizes. Error bars indicate 95% confidence intervals. . . 95 5.4 Map search: completion times with different UI configurations and data sizes. 95 5.5 Map search: length of interaction (LI) with different UI configurations and
data sizes. Error bars indicate 95% confidence intervals. . . 97 5.6 Map search with hybrid configuration: scatterplot of completion time against
average gaze shifts (per trial). . . 98 5.7 Map search with hybrid configuration: scatterplot of standardised residuals
against standardised fitted values of completion time. . . 99 5.8 Text search task shown on mobile and large display. . . 101 5.9 Text search: mean completion times with different UI configurations and
5.10 Text search: completion times with different UI configurations and data sizes.104 5.11 Text search: length of interaction with different UI configurations and data
sizes. . . 106 5.12 Photo search task on mobile and large display. . . 108 5.13 Photo search: mean completion times with different UI configurations and
data sizes. Error bars indicate 95% confidence interval. . . 109 5.14 Photo search: completion times with different UI configurations and data
sizes. . . 110 5.15 Photo search: length of interaction with different UI configurations and
2.1 Display Characteristics: Size, Resolution, PPI, Pixel Size, Viewing Dis-tance and Viewing Angle. All calculations are based on perceptual
resolu-tion of 20/20 human vision. . . 32
2.2 Navigation Patterns in Multi-Display User Interfaces. . . 37
3.1 Display Contiguity in Multi-Display User Interfaces. . . 53
3.2 Content Coordination in Multi-Display User Interfaces. . . 59
3.3 Directness of Input in Multi-Display User Interfaces. . . 61
3.4 Input-Display Correspondence in Multi-Display User Interfaces. . . 64
3.5 Taxonomy of Prototypes Investigated in the thesis. . . 65
5.1 Map search: average ratings and statistics for the TLX questions. For per-formance, higher means better. . . 96
5.2 Map search: configuration preference rankings. . . 96
5.3 Text search: average ratings and statistics in the TLX questions. . . 104
5.4 Text search: configuration preference rankings. . . 105
5.5 Photo search: average ratings and statistics in the TLX questions. . . 110
5.6 Photo search: configuration preference rankings. . . 111
want my radiologist and air-traffic
controllers to be using multiple
large high-res[olution] displays.
Ben Shneiderman
Chapter 1
Introduction
The emergence of desktop computers in the 1970s and 1980s began an era of personal computing(one computer per person) that is credited for bringing computing into mains-tream society and removing the constraints of the established mainframe computing(one computer for many people). Interaction with a personal computer has been based on the “desktop metaphor” [113] that signifies a standalone and stationary “box” with a proces-sing unit, and input and output devices connected to the box. Although physically smaller in size than a mainframe computer, a desktop computer still lacked portability.
The breakthroughs in the development of portable devices (such as laptops and smart-phones) and the widespread availability of mobile telecommunication technologies facili-tated the emergence ofmobileor nomadic computingthat enabled users to readily access data anywhere at any time. As a result, today it is possible to avail oneself of many features of computing (e.g., reading online information, exchanging digital contents) while away from the computer desk.
The advances in mobile computing [128] and embedded computing have motivated resear-chers to develop the notion ofubiquitous computing(one person with many computers) that suggests a single user interacting with multiple devices embedded into the environment si-multaneously. This vision is centred on the prospect of user interaction spanning across a
multitude of devices seamlessly, rather than being restricted to one particular device.
The “one box model” of a computer as embodied in the desktop metaphor [113] of perso-nal computing is becoming outdated [146] as it fails to accommodate the user experience across multiple heterogeneous devices in the emerging paradigms of computing (shown in Figure 1.1). While we have enabling technologies for mobile and ubiquitous computing, we can also consider all the computational elements (including input and output) being individually available to be used as a single ecosystem of interaction. Ongoing research into designing user interface (UI) elements spanning across multiple devices [19, 79, 133] points towards an attempt to fill the “missing link” between the conventional desktop me-taphor and the advent of multi-device computing and distributed applications.
ϭϵϳϬƐͲϭϵϴϬƐ WĞƌƐŽŶĂů
ŽŵƉƵƚŝŶŐ DŽďŝůĞͬEŽŵĂĚŝĐŽŵƉƵƚŝŶŐ hďŝƋƵŝƚŽƵƐŽŵƉƵƚŝŶŐ
[image:20.595.117.538.317.392.2]ϭϵϴϬƐͲϭϵϵϬƐ ϭϵϵϬƐͲŽŶǁĂƌĚƐ
Figure 1.1: Emergence of Different Paradigms of Computing.
1.1
Motivation
1.1.1
Mobile Phones: More than Telecommunication
In recent years, mobile phones have become the most pervasive of all computing devices as the worldwide subscribers’ base is reported to have already exceeded five billion [26] and is expected to double by 2020 [240], thus foreshadowing a world where mobile phones will soon outnumber humans [25]. Although originally designed for telecommunication, mobile phones equipped with advanced computing ability and features (e.g., camera, net-working capabilities, accelerometer) are increasingly being used for day-to-day tasks such as photography, calendar management, e-document reading, games and web browsing [15]. According to an Olswang report in 2011, smartphones are experiencing accelerating rates of adoption: 22% of consumers already have a smartphone, with this percentage rising to 31% among 24–35 year olds [165]. An InMobi survey of 15,000 mobile phone users in 14 countries found that for Internet shopping, users who prefer to use a mobile phone are almost double the number of those who prefer to use a computer [108].
Mobile devices are frequently used in medicine [78], and facilitate the access to patient records [132]. Mobile phones can help students get access to their lessons [148, 188, 253] and stay in touch with their classmates, anytime and anywhere [246]. Inside classrooms, they create a more engaging teaching environment [223]. In the business sector, they allow professionals to work from anywhere, while simultaneously remaining in contact with their colleagues [124]. Users are now able to access e-mails, documents, and the web from their portable device [54] — the tasks that a few years ago would be feasible only on a dedicated personal computer. Moreover, in many developing countries where access to desktop computers is limited, mobile devices are the only means of Internet access [114].
1.1.2
Limitations of Mobile Displays
While the portability of mobile devices makes them desirable for pervasive access to in-formation, the small screen size often imposes restrictions on the amount of information that can be displayed and manipulated on mobile devices. While recently there has been a significant increase in the resolution of mobile screens (e.g., Apple iPhone 4TM ’s Retina Display has 640x960 pixels), the portable form factor requirements will always place limits on their physical size. More simply stated, small screens are a feature, not a bug of mobile devices. Hence, it is not possible to view large amounts of information simultaneously (due to the low resolution) and adequately (due to the small size) on mobile screens. Researchers have attempted to mitigate this problem by visualizing references to off-screen objects on mobile displays [38].
Being able to attend to more information at once is associated with better perception and comprehension of the information space [173]. Mobile screen users are unable to avail themselves of the performance improvement associated with large displays in tasks such as geo-spatial navigation [183, 231, 232] and visualization [12] tasks. In the words of Ben Shneiderman [138],
“This [smartphone] works fine for many small common tasks but I want my radiologist and air-traffic controllers to be using multiple large high-res[olution] displays.”
1.1.3
Large Displays: More than Household Items
The termlarge display is applied to a myriads of displays; they may includevertical dis-plays (e.g., television sets, interactive whiteboards, digital signs, wall disdis-plays) as well as
horizontaldisplays (e.g., tabletop surfaces). The constituent devices may include plasma, Liquid Crystal Display (LCD) or Light-Emitting Diode (LED) monitors, High Definition Television (HDTV) or projectors.
item of entertainment for decades. However, in recent years, large displays have become commonplace in many locations; these include outdoors (e.g., railway stations, city squares [103]) as well as indoors (e.g., classrooms, workplaces [104, 184]). They have been placed in different social settings: private (e.g., an office), semi-public (e.g., a meeting room) or public (e.g., shopping mall). They provide an effective way of disseminating information and, in addition to their use for advertising and entertainment, are also being used for co-located collaboration [239].
At present, over 2 million SMART BoardTM touch-enabled interactive whiteboards are
being used, mostly in classrooms, but also in corporate offices, around the world [219]. The retail sector across the world is increasingly making use of digital signs, and the number of these is estimated to rise to 22 million by 2015 [1]. Efforts are being made to integrate Internet connectivity into modern TV sets, thus giving rise toSmart TV orConnected TV. At the end of 2010, there were 124 million TV sets across the world connected to the Internet and the number of these is estimated to reach 551 million (i.e., 8.9% of global TV sets) by 2016 [49].
1.1.4
Coupling Mobile Displays with Large Displays
Researchers have proposed solutions that support coupling of mobile handheld devices with large displays to create an enhanced user experience. These include using a mobile device as a remote control [14, 101], as a companion device [40] as well as a conduit for exchan-ging material between displays [34, 45]. Mobile devices can also facilitate interaction with displays that are physically inaccessible and do not provide any means of direct interaction, such as playing pong game with the building-sized Blinkenlights displays [33].
cou-pling of mobile devices with large displays (among other peripherals) in the environment has given rise to the notion ofdevice symbiosis[179].
1.1.5
Distribution of User Interfaces
[image:24.595.186.473.354.558.2]In order to make the most of multi-device coupling, and also to make its advantages more perceptible, solutions have been introduced that support migration of parts or the whole of a UI across different devices according to the input and output capabilities of these devices [19, 133]. An example of a multi-device user interface is shown in Figure 1.2. This shows a Scrabble game where an iPad serves as a Scrabble board and each iPhone shows the tiles for the player. The separation of UI elements across displays of differing sizes helps overcome the limitations of viewing and interacting with the content on a single display.
Figure 1.2: iPad Scrabble (used with permission from Movie-peg.com).
1.1.6
Attention Switching in Distributed User Interfaces
and a vertical large display affects performance in different tasks. One study [230] showed a detrimental effect of the separation of text in the visual field only if it is also combined with separation in depth, while another shows that users perform a visual search of images better on a single vertical screen than across multiple vertical screens showing different orientations of the same images [76]. These results suggest that the overhead caused by attention switching differs with the type of task being performed. An insight into these issues will help designers understand if when performing a task it is worth distributing user interfaces across multiple displays, and what is the extent of performance gain/loss associated with such distribution.
1.2
Problem Statement
Much of the motivation for this work arises from a literature review in human-computer interaction, experimental psychology and information visualization. The main problem this work tries to address is the effect on task performance of cross-display attention switching in mobile interaction with large vertical displays. Attention is an area widely researched in psychology and neuro-science and it encompasses different modalities such as touch, hearing or sight [5, 267]. Although an attention switch does not necessitate a change in direction of gaze, yet in most cases, the former triggers the latter [259].
In this thesis, the focus is on the performance effects ofcross-display switching, that spe-cifically refers to the switching ofvisual attentionbetween a handheld mobile device and a vertical large display. The other aspects of visual attention, as well as other modalities of attention, lie outside the scope of the thesis.
The main research problem this thesis addresses is:
Considering the scope of this thesis, we break down this high-level question into the follo-wing dimensions:
• Local and remote selection: placement of widgets∗ for mobile interaction with the large displays:
In a task that involves manual selection of multiple on-the-display widgets in series, how does task performance differ while interacting in “no-attention-switch” (widgets on the large display) vs. in “attention-switch” (widgets shown on the large display as well as replicated on the mobile device) configurations of UI elements across a mobile device and a large display?
• Visual search on mobile, large display and hybrid UIs:
How does task performance in visual search tasks differ while interacting in “no-attention-switch” (mobile-only, mobile-controlled-large-display) vs. in “attention-switch” (hybrid) configurations of UI elements across a mobile device and a large display? Three visual search tasks were tested with map, text and photo data.
• The cost of cross-display switching:
How does the overhead caused by cross-display attention switching vary according to the type of the task being performed?
1.3
Research Approach
This work is directed by an experiment-driven constructive research approach. It involves identification of research problems and formulation of hypotheses based on a comprehen-sive survey of related work. In order to test those hypotheses, prototypes are developed and evaluated through user studies. Based on the experimental results, recommendations
∗In this work, a widget refers to an interactive component of a Graphical User Interface (GUI) [140] that
for the design of user interfaces distributed across a handheld mobile device and a vertical large display are outlined.
1.4
Thesis Statement
In answer to the problem statement (see Section 1.2), the statement of this thesis is as follows:
In mobile interaction with large displays, selecting multiple widgets replicated on the mobile device as well as on the large display, versus those shown only on the large display, is faster despite the cost of initial cross-display switching in the former. On the other hand, the cross-display switching adversely affects task performance in the visual search of map, text and photo contents replicated across the mobile device and the large display.
1.5
Scope of Thesis
This thesis addresses the question about the performance effects of switching visual at-tention between a small handheld display and a large vertical display during single-person interaction with the aforementioned displays. For the purposes of the thesis, it is assumed that the infrastructure needed to support network communication between mobile devices and large displays, as well the frameworks to distribute user interfaces across different displays, are readily available or will be available in the near future.
ŽͲůŽĐĂƚĞĚŽůůĂďŽƌĂƚŝŽŶ
/ŶƚĞƌĂĐƚŝǀĞds
DƵůƚŝͲhƐĞƌƉƉůŝĐĂƚŝŽŶƐ
ŽŽƌĚŝŶĂƚĞĚΘDƵůƚŝƉůĞsŝĞǁƐ
ŝ
^ŝŶŐůĞͲhƐĞƌ/ŶƚĞƌĂĐƚŝŽŶ
dŽƵĐŚͲďĂƐĞĚ^ŵĂƌƚƉŚŽŶĞ
>ĂƌŐĞsĞƌƚŝĐĂůŝƐƉůĂLJ
ƌŽƐƐͲŝƐƉůĂLJsŝƐƵĂůƚƚĞŶƚŝŽŶ^ǁŝƚĐŚŝŶŐ
ŝ
EĞƚǁŽƌŬŝŶŐWƌŽƚŽĐŽůƐ
ĞǀŝĐĞŽƵƉůŝŶŐdĞĐŚŶŝƋƵĞƐ
DƵůƚŝͲĞǀŝĐĞ^LJƐƚĞŵƐ
ƚƚĞŶƚŝŽŶ^ǁŝƚĐŚŝŶŐ
ŝ
hŶĚĞƌůLJŝŶŐ
ĐŽŶĐĞƉƚƐ͕
ĨƌĂŵĞǁŽƌŬƐ
WŽƐƐŝďůĞ
ƉƉůŝĐĂƚŝŽŶ
ƌĞĂƐ
[image:28.595.119.515.76.374.2]^ĐŽƉĞŽĨ
dŚĞƐŝƐ
Figure 1.3: Scope of Thesis.
1.6
Thesis Contributions
The contributions of this thesis are as follows:
• Taxonomy of multi-display user interfaces (MDUIs). This thesis introduces a taxo-nomy based on the factors associated with visual arrangement of UI elements that can affect visual attention switching in user interaction with MDUIs. These dimensions includedisplay contiguity,angular coverage,content coordination,input directness, and input-display correspondence. A detailed description of this taxonomy is pre-sented in Section 3.2.
(i.e., pointing at widgets on the large display) and “attention-switch” (i.e., widgets on the large display replicated and selected on the mobile touchscreen) configurations. The experimental results suggest guidelines for the placement of widgets on a large display or a mobile device to improve performance under different difficulty levels of the task [181].
• Analysis of cross-display switching for visual search. This thesis provides empirical evidence of how “no-attention-switch” and “attention-switch” configurations of user interfaces affect task performance, subjective workload and preference in the visual search of map, text and photo contents. The experimental results suggest guidelines for choosing UI configurations for the visual search of different contents. [183].
• Lessons for practitioners. Based on the experimental results, this thesis provides guidelines for designers to improve the task performance and enhance the user expe-rience with MDUIs. The guidelines also suggest the experimental conditions where the distribution of the visual output across multiple displays can be detrimental to the task performance.
• Calculation of cross-display switch overhead. As a minor contribution, this thesis provides a calculation of the overhead in terms of the time it takes to switch visual attention between a handheld mobile device and a vertical large display. For the widget selection task, the time cost is about 0.64±0.36seconds; for the map search task, this cost is about 1.8±1.4 seconds with the data simultaneously visible on the mobile display, and 1.8±0.96 seconds with the data simultaneously visible on the large display.
1.7
Thesis Organisation
The thesis is organised as follows:
over-view of multi-device usage and emerging computing paradigms that envisage an integrated user experience across heterogeneous devices. In this chapter, we discuss approaches to-wards the design of user interfaces for multi-display systems and highlight some issues of human vision and perception, as well as characteristics of displays, that can be helpful in understanding the human interaction with multi-display user interfaces (MDUIs). We dis-cuss navigation patterns supported by different displays and relate the scope of this thesis to the attention switching associated with the continuum of the navigation pattern under consideration.
Chapter 3 provides an overview of the taxonomies and classifications in the existing lite-rature that are applicable to MDUIs and introduces a taxonomy based on the factors asso-ciated with the visual arrangement of UI elements that can affect visual attention switching during user interaction with MDUIs. For each factor, the existing multi-display systems are classified and the relevance to cross-display switching is explained.
Chapter 4 presents an empirical comparison of the task performance for selecting multiple widgets in a switch” vs. “attention switch” condition. The “no-attention-switch” condition is reflected in the Distal Selection (DS) technique that uses a mobile pointer to zoom-in to the region of interest and select the widgets on the large display. The “attention-switch” condition is reflected in the Proximal Selection (PS) technique that in-volves pointing at the large display and transferring the zoom-in view of the highlighted region of the large display onto the mobile touchscreen for selections thereafter. The task performance, subjective workload and preference with both interaction techniques are dis-cussed, the calculation of cross-display switching time in multiple widget selection task is provided and recommendations for designers are outlined.
display. The tasks tested involved the visual search of map, text and photo contents. The performance differences across different UI configurations are analysed, the calculation of cross-display switching time in the map search task is provided, and recommendations for the design of MDUIs are presented.
Isaac Newton
Chapter 2
Background
Devices with computing capacity and visual output (i.e., displays) are increasingly making their way into everyday life. Users are progressively shifting from using a single perso-nal computer to interacting with a wider range of computing devices (e.g., laptops, tablets, mobile phones, media players, e-book readers) [59, 258]. The proliferation of computing devices has created opportunities to make different applications and services readily ac-cessible on multiple devices. For example, it has become commonplace to play videos, check emails and read documents not just on desktop computers but on mobile phones and tablets as well. Researchers are also trying to support interactionacrossmultiple devices in order to take advantage of the strengths and overcome the limitations of each device, thus resulting in an enhanced user experience. Examples include asynchronous multi-device interaction such as accessing web pages on a desktop computer and resuming them on a mobile device [43, 120], as well assynchronousmulti-device interaction such as simulta-neously playing Scrabble on iPhone and iPad [211].
As discussed in Chapter 1, the classical Graphical User Interface (GUI) model based on a “desktop metaphor” [113] was designed for interaction with input and output devices attached to a single computing device unit. With the increasing prevalence of computing, situations now arise when tasks are performed with user interface elements residing in physically and visually disjointed devices, such as browsing a webpage on a large display
and controlling the browsing operation on a handheld device [19]. Efforts are underway to provide explicit support for designing user interfaces across multiple devices [18, 19, 61]. Ongoing developments of multi-device operating systems (e.g., Meego [142], Tizen [243], Microsoft Windows 8TM[264]) are meant to pave the way for an integrated user experience across heterogeneous devices.
This research draws much of its inspiration from the state-of-the-art research on systems that support interoperability and user interaction across multiple devices. In this chapter, we define some terms that are frequently used in the rest of the thesis (see Section 2.1). We report on some user studies on multi-device usage (see Section 2.2). We discuss computing paradigms that envisage the phenomenon of integrated user experience across heteroge-neous devices (see Section 2.3) and approaches towards the design of user interfaces for multiple displays (see Section 2.4). We discuss some issues of human vision and perception that can be helpful in understanding human interaction with Multi-Display User Interfaces (MDUIs) in Section 2.5. We explain how these issues relate to task performance using large displays (see Section 2.6). After discussing the attention switching associated with naviga-tion patterns supported by different multi-display systems (see Secnaviga-tion 2.7), we conclude this chapter.
2.1
Definitions
2.1.1
Multi-Device Environment
Amulti-device environmentrefers to the computing system that supports simultaneous in-teraction between multiple computing devices. The distinguishing feature of a multi-device environment is that the execution of a taskmustspan multiple devices. For example, a mo-bile phone used to control the cursor on a desktop computer constitutes a multi-device environment. However, writing a text message on the mobile screen while playing a media file on a computer does not fall into the category of a multi-device environment.
2.1.2
Multi-Display Environment
Hutchings et al. [105] coined the term “Distributed Display Environment” (DDE) to refer to the “computer systems that present output to more than one physical display”. In this thesis, the termmulti-display environment(MDE) is used to refer to the said systems. MDEs may include multiple screens connected to a single computing device (e.g., Nintendo DS), or a logical composition of single-displays, each connected to a different computing device (e.g., SharedNotes [82]). Hence, a multi-display environment may be a single-device or a multi-single-device environment. Similarly, a multi-single-device environment may or may not classify as a multi-display environment. For example, aNike + iPodsystem that sup-ports exchange of data between a shoe sensor and an Apple iPodTMdevice is a multi-device
environment, but not a multi-display environment. On the other hand, SharedNotes [82] is both a multi-device and a multi-display environment. iRoom [111] is another example of a multiple display environment (MDE) that comprises of personal devices such as laptops and shared devices such as large vertical displays to provide a virtual workspace.
DƵůƚŝͲĞǀŝĐĞŶǀŝƌŽŶŵĞŶƚ DƵůƚŝͲŝƐƉůĂLJŶǀŝƌŽŶŵĞŶƚ
ŝZŽŽŵ ŝͲ>E tĞ^ƉĂĐĞ LJŶĂŵŽ ŽŶŶĞĐƚĂďůĞƐ hďŝdĂďůĞ ͲĐŽŶŝĐ
EŝŶƚĞŶĚŽ^ DƵůƚŝͲŵŽŶĞƐŬƚŽƉ EŝŬĞнŝWŽĚ
ĂƌƉŚŽŶĞнŵŽďŝůĞ
Figure 2.1: Multi-Device and Multi-Display Environments.
2.1.3
Device Interoperability
Interoperability refers to the ability of different systems or devices to work together. In the context of computing, O’Brien and Marakas [163] defined it as “Being able to accomplish end-user applications using different types of computer systems, operating systems, and application software, interconnected by different types of local and wide area networks.”
In this thesis, interoperability is defined as the ability of a computing device to have seam-less (and synchronous) access to applications and data across multiple devices to accom-plish a task.
2.1.4
Multi-Display User Interface
Amulti-display user interface(MDUI) refers to the configuration of user interface elements (i.e., input and output) across multiple displays in a multiple-display environment. MDUIs are built using computing frameworks and technologies that support device interoperability.
shown on both the mobile device and the projection surface. An in-depth description of the taxonomy of MDUIs is given in Chapter 3.
2.2
Usage of Multiple Devices
In recent years, researchers have reported on the experiences ofmulti-device users(MDUs) i.e., the people who regularly use multiple computing devices. In 2008, a study of 27 people from academic and industrial research labs found them to be using more than five computing devices on average [59]. The MDUs identified managing information across devices as the most challenging aspect of the multi-device usage and welcomed the idea of seamless data exchange across different devices [59, 167].
The trend of using multiple computing devices is no longer confined to researchers and academics. Studies by Microsoft Advertising identified about 33 million Americans [258] and 19 million Europeans [257] to bemulti-screen consumers. A “multi-screen consumer” [258] is defined as an adult in the age group of 18–64 years who uses a TV, computer, and smartphone, and also accesses the Internet at least 23 times each week using both the computer and the smartphone. In 2010, a survey of 1200 of these consumers across the US found evidence of widespread engagement in activities across multiple screens. As stated in [258],
“Multi-Screen Consumers, who used to turn to specific screens for specific activities, are increasingly engaging in activities across multiple screens. Convergence occurs as the functional benefits of each screen come together. Individual activities, from social networ-king to playing games to watching news highlights, are no longer restricted to a single screen.”
one machine does everything, it in some sense does nothing especially well, although its complexity increases.”
This suggests that instead of replacing multiple special-purpose devices by a single omni-purpose device, a synergy of the former is more promising for improving user interactions in many situations [210]. This implication remains a prime motivation for the research on supporting interoperability among devices.
2.3
Computing Paradigms for Device Interoperability
The Merriam Webster Dictionary [143] defines aparadigmas “a philosophical and theore-tical framework of a scientific school or discipline within which theories, laws, and gene-ralizations and the experiments performed in support of them are formulated”. The Oxford English Dictionary [168] defines it as “a world view underlying the theories and methodo-logy of a particular scientific subject”.
This section provides a brief overview of some emerging computing paradigms that em-phasise the interconnectivity and interoperability of multiple devices as their core concepts.
2.3.1
Ubiquitous Computing
Ubiquitous computing (abbreviated asubicomp; also known as pervasive computing) pre-sents the vision of seamless interaction among multiple computing devices embedded into everyday life [255]. Mark Weiser, the pioneer of ubicomp vision, proposed three basic forms for ubicomp devices as follows:
• Pads. Handheld decimetre-sized devices. Laptops, netbooks and tablets (e.g., Apple iPadTM, HTC FlyerTM, Samsung GalaxyTM) are included in this category.
• Boards. Metre-sized interactive display devices. Desktop computer, digital white-boards and large displays are included in this category.
In the words of Mark Weiser [255],
“Prototype tabs, pads and boards are just the beginning of ubiquitous computing. The real power of the concept comes not from any one of these devices; it emerges from the interaction of all of them.”
Due to the proliferation of computing devices of various form factors, as well as the in-creasing support for their interconnectivity and interoperability, the vision of ubicomp is gradually coming closer to reality. A thorough investigation of ubicomp enabling techno-logies is beyond the scope of this thesis.
2.3.2
Activity-Based Computing
Activity-Based Computing (ABC) is a paradigm within Ubiquitous Computing that focuses on the activity of the user to define interaction with computers [20]. In activity-based computing, the basic computational unit is no longer the file (e.g., a document) or the application (e.g., a word processor) but the activity that aggregates various computational services and data resources, and may include more than one participant (see Figure 2.2).
Figure 2.2: A computational activity aggregates a set of computational services, data resources and users (used with permission from [21]).
2.3.3
Recombinant Computing
Recombinant computing [158] is an approach to software infrastructures that aims at sup-portingserendipitousinteroperability i.e., the ability of devices and services within Ubiqui-tous Computing to access one another without having any prior knowledge of each other. It advocates the design of computing entities bearing in mind the consideration that they might be used in multiple ways, in different situations, and for different purposes [158].
Figure 2.3: Speakeasy: A PDA displaying the controller for a PowerPoint viewer running on a projector (used with permission from [157]).
2.3.4
Synergy of Multiple Devices
Below is a brief overview of the notions concerning synergies of multiple devices that appear in the literature.
Device Ensembles
Schilit and Sengupta [210] introduce the notion ofDevice Ensemblesthat refers to the wor-king of diverse computing devices in concert to give rise to an enhanced user interaction, similar to the ensemble of musicians that achieves a total effect greater than the sum of individual performances. A particular case of device ensembles is reflected in the cou-pling of mobile devices with large displays that can be used to make the most of input and output capabilities (e.g., the former’s easier physical accessibility and the latter’s bigger representation space) of each device.
Figure 2.4: Ensembles of digital devices are emerging for common usage models at home, at work, and on the road (used with permission from [210]).
provided in [210], and lies beyond the scope of this thesis.
Cyber Foraging
The notion ofcyber foraging[8, 208] refers to augmenting the computing capabilities of a resource-poor mobile device by offloading some of the tasks to the computational resources (calledsurrogates) in the environment. A number of systems that support cyber foraging have been proposed [9, 58, 73, 227].
Device Symbiosis
Borrowing concepts from biology, Raghunath et al. [179] present a notion of symbiosis between handheld devices and large displays in the environment where the former’s pre-sentation space opportunistically cause the latter to display content to the user. This notion has been realized in some prototypes. For example, the Personal Server [250] is an auxiliary device that enables a mobile phone to co-opt screens and keyboards of nearby computers through a WiFi connection. Berger et al. [27] present a prototype that allows a user to read an email received on a small handheld display by showing it on large displays.
The notion of device symbiosis is closest to the purposes of this research because it ex-plicitly supports the sharing of UI elements between handheld devices and situated large displays.
2.4
Multi-Display User Interfaces
A case study by Hutchings et al. [106] shows that users are interested in the potential of dividing interfaces across multiple devices mainly based on the input/output capabilities of each device. Current GUI programming toolkits such as JavaTMSwing and Microsoft Foun-dation ClassesTM are designed for a single workstation and do not support development of
UI across multiple machines. Considering the limitations of the “desktop metaphor” of being tied to a single workstation, researchers have explored alternative models of GUI for a ubiquitous computing environment that take into account its multi-device composition.
application with its UI elements distributed across different machines.
Coutaz et al. [52] presented a more general framework for migratory applications where migration is intended both as total migration of the application interface as well as split-ting it into several parts to be spread over different platforms. Bandelloni and Paterno [19] proposed a solution for runtime migration of Web applications that allows users interacting with an application to change device and continue their interaction from the same point. Their interface generation tool called TERESA also supportspartial migration and syner-gistic access, by which a part of the user interface is kept on one device during runtime and the remaining part is moved to another with different characteristics. For example, partial migration allows a user to display videos and photos from a handheld device onto a large display while maintaining control on the former.
Rekimoto [190, 191] proposed the notion ofmultiple-computer user interfacesthat consis-ted of a handheld computer (called M-Pad) serving as a tool palette and data entry palette for the digital whiteboard, as shown in Figure 2.5. Similar to an oil painter holding a pa-lette in his/her hand when painting on a canvas, M-Pad offers an easy way to select tools to manipulate the whiteboard application.
Figure 2.5: A multi-display whiteboard system: digital drawing in the manner of oil painting (used with permission from [190]).
simultaneously by more than one display. WebSplitter [90] helps split a Web page into per-sonalised partial views for each user and and further splits the partial view into components to be shown on individual devices accessible to the users. WinCuts [234] lets users select regions of interest from a local display and show it to other users on a large display.
The closest to the purposes of this thesis is the notion of the Distributed User Interface
(DUIs) [65]. DUI refers to any application UI whose components can be distributed across various displays of different computing platforms and can be accessed by different users, co-located as well as remote [61]. DUIs allow for UI elements to be spread over multiple devices/displays/platforms to take advantage of their interaction capabilities, instead of being constrained by that of a single device/display/platform [133].
At present, system support for DUIs remains in its rudimentary stage. Researchers are working on conceptual models [133], software architectures [17] and toolkits [83, 161] to support the generation of DUIs. A detailed discussion of these research endeavours is beyond the scope of this thesis.
2.5
Human Vision and Characteristics of Displays
One aspiration relevant to the effective design of visual interfaces is that it should be based on a sound knowledge of underlying concepts about visual perception. In this section, we present some information about human vision and perception that is pertinent to the design and usage of MDUIs. We will also discuss some characteristics of displays that are relevant to our purposes.
2.5.1
Foveal Vision
general rule is that the foveal region is almost as wide as one’s thumbnail appears at arm’s length [251]. This implies that at a normal reading distance (i.e., 30cm), the diameter of foveal region is about 2cm [22].
2.5.2
Peripheral Vision
Peripheral vision refers to the ability to see objects and movement outside of the direct line of vision. Large displays provide more space to utilise the peripheral vision while small displays provide little space to make use of it. The key benefits of exploiting peripheral vi-sion are the greater amount of simultaneously visible data, the broader contextual overview and the awareness of spatial orientation [23, 63, 180].
2.5.3
Visual Field
Visual field refers to the total space visible using the peripheral vision while the eyes are fixed on a central point (i.e., in the foveal region). More simply stated, it stands for the maximum area one can see without moving one’s eyes or head. The human visual field typically spans around 200◦horizontally and 135◦vertically [256]. The foveal vision com-prises about 1%-3% of the visual field.
2.5.4
Perceptual Resolution
The perceptual resolution refers to the ability of eyes to resolve details in a visual pre-sentation. At a distance of 20 feet (6 metres), human eyes with normal 20/20 vision can distinguish between details as fine as 1 arcminute (i.e., 1/60◦) [118]. This angle is also called theminimum angle of resolution(MAR). This translates to about 1.75mm being the minimum size of the object that is distinctly distinguishable from a distance of 20 feet.
2.5.5
Useful Field of View (UFOV)
The Useful Field of View (UFOV) refers to the area over which a person can extract in-formation in a single glance [206]. The span of the UFOV varies according to the task and the information being shown [251]. For tasks that require detailed discrimination, such as text reading, the UFOV becomes smaller and the locus of attention is narrowed down. For example, while reading an English script, the UFOV span extends from 3–4 letters to the left of fixation to about 14–15 letter spaces to the right of fixation [185]. On the other hand, for tasks not requiring detailed discrimination, such as visual navigation or detection of large moving objects, the UFOV may extend to 180◦ [22]. Therefore, in the design of MDUIs, it is important to consider the dominant viewing task while distributing UI elements across displays of different sizes.
2.5.6
Eye Movements
about 40–50 milliseconds [186].
The saccade is ballistic and its destination must be selected prior to the movement. Since the destination usually lies beyond the current foveal region, its selection requires the use of peripheral vision. A saccade is usually followed by afixation, i.e., a period of relative stability when an object can be viewed. The visual information is usually processed and analysed during a fixation [185]. The mean duration of an eye fixation also varies de-pending on the task. For example, it may last around 225–250 milliseconds during silent reading of an English text and 180–275 milliseconds during a visual search task [186].
Sanders [205] suggested that the visual field can be divided into three regions depending upon whether a visual stimulus can be identified (a) without an eye movement, (b) with an eye movement, and (c) with a head movement. The maximum region a saccade can cover without any head movement is approximately±55◦(i.e., theoculomotor range) [86], although typically a head movement is involved in any saccade larger than 10◦ [129].
Eye fixations and saccadic movements are extensively studied in vision science, neuros-cience and experimental psychology to determine a person’s focus and level of attention [92]. Although an attention shift can happen without an eye movement in simple discrimi-nation tasks [175], the former is closely associated with the latter in complex information processing tasks such as reading and visual search [185].
Fixation durations and saccade amplitudes can vary in different tasks due to the characteris-tics of the task (e.g., memorization vs. item identification), the type of visual information (e.g., text vs. image), and the density of visual information (i.e., more densely packed items result in longer fixations and shorter saccades) [186]. This implies that the behaviour of eye movements is closely related to the UFOV associated with a particular task (see Section 2.5.5).
required eye or head movements, and the time cost of cross-display switching.
2.5.7
Display Characteristics
Some characteristics of display devices affect the viewing experience [265]. For the pur-poses of this thesis, we divide them into two, i.e., characteristics that determine how in-formation appears on the display (e.g., colour, brightness, contrast, refresh rate [265]), and characteristics that determinehow much information appears on the display (i.e., display size and resolution [254]).
Our exploration is focused on display characteristics that are related to thehow muchfactor. For the purposes of this thesis, we assume that the display characteristics related to the
howfactor are held comparable across multiple displays such that their differences are not particularly noticeable by the users. The following subsections discuss some issues related to display resolution, pixel density, pixel size, and viewing distance & angle.
Display Resolution
A screen is typically made up of thousands of tiny dots calledpixelsthat collectively illumi-nate to generate the visual presentation. Theresolutionof a display represents the number of distinct pixels in each dimension. This is usually presented as widthx height, for ins-tance where the units in pixels are “1024x768”, it means there are 1024 pixels along the screen’s width and 786 pixels along the screen’s height, thus 804864 screen pixels in total.
Pixel Density
Another useful measure of a display resolution is called pixel density or pixels per inch
(PPI) that denotes the number of pixels contained in one inch length of a display. For example, an Apple iPhone 4TM ’s “Retina Display” with a 3.5"screen and 640x960
With higher PPI, the visual presentation looks smoother and is easier to read. By defini-tion, small displays with high resolution have higher PPI, and consequently visual objects containing the same number of pixels appear smaller on them than what they appear on displays with the same physical size but lower resolution. Experimental results show that with the same PPI, a physically larger display improves task performance in 3D navigation [159].
Pixel Size
The reciprocal of PPI gives the pixel sizein inches. For example, the pixel size of Apple iPhone 4TM is 1/326=0.003"(0.78mm) while that of an HD LCD is 1/54=0.018"(4.7mm).
Viewing Distance & Angle
Based on the information about the perceptual resolution of the human eye, we can calcu-late that an object is distinctly visible at a distance of less than or equal to 3438 times its size (i.e.,tan(1/2arcminute)=0.000145=⇒Size of the object/2*Viewing Distance=0.000145=⇒
3438*Size of the object=Viewing Distance) [174]. Figure 2.6 shows the relationship bet-ween object size, viewing distance and visual angle.
sŝĞǁŝŶŐŝƐƚĂŶĐĞ
KďũĞĐƚ^ŝnjĞ sŝƐƵĂůŶŐůĞ
ЪsŝƐƵĂůŶŐůĞ
ƚĂŶ;ϭͬϮsŝƐƵĂůŶŐůĞͿсKďũĞĐƚ^ŝnjĞͬϮΎsŝĞǁŝŶŐŝƐƚĂŶĐĞ
Figure 2.6: Object size, viewing distance and visual angle.
the viewing distance and angle for a typical desktop computer are about 100cm and 25◦– 30◦respectively. Table 2.1 shows display size, resolution, PPI, pixel size, viewing distance and viewing angle for different display devices.
Table 2.1: Display Characteristics: Size, Resolution, PPI, Pixel Size, Viewing Distance and Viewing Angle. All calculations are based on perceptual resolution of 20/20 human
vision.
Device Size Resolution PPI Pixel Size Distance Angle
Nokia N900TM 3.5" 800x480 267 0.95mm 32.7cm 10◦ Apple iPhone4TM 3.5" 640x960 326 0.78mm 27cm 11◦ HTC Desire HDTM 4.3" 480x800 240 1.06mm 36.4cm 9◦ HTC FlyerTM 7" 600x1024 169 1.50mm 51.7cm 11◦ Apple iPadTM 9.7" 786x1024 131 1.90mm 66.7cm 13◦ Apple new iPadTM 9.7" 2048x1536 264 0.96mm 33.08cm 25◦ HDTV 42" 1920x1080 54 4.70mm 160cm 33◦
2.5.8
Physical Navigation
Physical navigation refers to the physical movement of the foveal vision to look at different areas of the display; it may include eye saccades, head movements, reorientation of the torso, or walking towards/away from the display [12]. The smaller the display size, the less physical navigation is needed to view its contents and vice versa. For example, moving one’s eyes or head away from a mobile display does not help one to view more information on the display as these movements will take visual attention away from the display. On the other hand, a large display provides a lot more space for physical navigation as one can move one’s head or re-orient one’s posture and still be able to view the information.
2.5.9
Virtual Navigation
to view its contents and vice versa. For example, it requires a lot of panning and zooming to go through a large map on a handheld display. On the other hand, a large display can show more information at once and reduces the demand for virtual navigation.
2.5.10
Summary
Human foveal vision covers a very small region (i.e., 2◦) of the visual field, hence, we make eye movements to look at the visual information outside the foveal region. The Useful Field Of View (UFOV) refers to the information one can extract at a glance. The nature of the viewing task, the type of visual information and the density of visual information influence the span of UFOV and the pattern of eye movements.
How much information a display can show at once depends on its size and resolution, and these characteristics determine the distance from and angle at which a display can be viewed as a whole. If the data is too large to fit into the visual field at once, humans adopt physical navigation. If the data is too large to fit into the display at once, users resort to virtual navigation.
2.6
Task Performance with Large Displays
It is an intuitive expectation that bigger displays provide better viewing experiences. Be-havioural studies show human preference for larger objects in presentations [216]. This section provides an overview of research about task performance with different configura-tions comprising large displays.
multi-monitor configuration with increased resolution (3 monitors wide) performed better in complex, cognitively demanding productivity tasks (e.g., sensemaking) than on a single monitor.
A 4-month long diary study comparing the usage of a large (5mx2m) high-resolution (6144x2304 pixels) display with a single monitor and dual-monitor for information pro-cessing work [30] showed the participants’ unanimous preference for using a large display. The stated reasons were that a large display facilitates multi-tasking and provides a more “immersive” experience. Sabri et al. [204] showed that a larger-sized display (made of 3x3 tiled monitors) affected the players’ strategies and resulted in more wins and greater enjoyment for the players. Ball et al. [10] investigated the performance advantages of large high-resolution displays in visual search tasks with geo-spatial data. Moreover, they repor-ted up to a ten-fold improvement in the performance time with larger displays when the participants used physical navigation rather than virtual navigation [13].
The performance improvement with large displays is task-dependent; no performance ad-vantages with a large display have been shown in reading comprehension tasks [232] but spatial tasks benefit from the wider visual field offered by a large display [231, 232]. Stu-dies report on improved task performance with large displays in spatial and virtual path selection [232, 233], 3D navigation [56], and 2D navigation and visualization [10, 272] tasks.
Ball et al. [12] attribute the advantages of large displays to three main factors:
• Peripheral Vision. Small displays emphasise foveal vision and provide minimal op-portunities to harness peripheral vision. Large high-resolution displays provide a greater peripheral area, and help smooth shifting of the foveal vision across the vi-sual field.
• Physical Navigation. The increased physical navigation with large displays, and subsequently less virtual navigation, can result in better performance.
cognitive mind is inseparable from the physical body and the combination of mental and physical resources—that includes peripheral vision and physical navigation— produce an impact. Experimental evidence confirms the combined role of peripheral vision and physical navigation in improving task performance with large displays [12].
2.7
Navigation Patterns with Displays
The navigation pattern refers to the human interactions with the display device in order to view the information that lies outside the focal vision. A display supports different navigation patterns to different extents depending on its specifications such as form factor, physical size, distance from observer, and manipulation of the screen’s viewport (e.g. via scrolling, swiping).
As discussed earlier, physical navigation (see Section 2.5.8) involves movement of the body around the display to bring information into one’s viewpoint while virtual navigation (see Section 2.5.9) involves manipulating the display to bring information into the screen’s view port. Physical navigation can be classified into egocentric and exocentric, usually depending on the physical size of the display as well as its distance from the observer.
2.7.1
Egocentric
2.7.2
Exocentric
Exocentric navigation involves moving a display close to or away from one’s body. Portable displays can allow for high levels of exocentric navigation, while levels of this are medium in desktop monitors, and low in large displays.
2.7.3
Virtual
When the information does not fit within the display at once, it requiresvirtual navigation
to bring it into the viewpoint [12]. Virtual navigation may include panning, zooming, or ad-justing the resolution of the display. Virtual navigation is supported by multi-window and virtual desktop features in most operating systems for computers (e.g., Windows, OS X, Li-nux) and by the screen-swiping feature on many smartphone platforms (e.g., iOS, Android). By default, most display devices can accommodate a high level of virtual navigation, al-though the application and interface developers may restrict the level of accommodation.
2.7.4
Summary of Navigation Patterns
According to their physical size, distance from the observer and available provisions for adjusting their viewpoints, different displays can offer opportunities for exocentric, ego-centric and virtual navigation along a spectrum. Table 2.2 shows the provision of different navigation patterns in some of the work containing MDUIs.
2.7.5
Attention Switching & Navigation Patterns
Table 2.2: Navigation Patterns in Multi-Display User Interfaces.
MDUIs Egocentric Exocentric Virtual
Multi-monitor desktop Medium Low High
Nintendo DS Low High High
Bumping [96] Medium Medium High
GeneyTM[57] Low High High
Courtyard [237] High Low High
UbiTable [214] Medium Medium High SharedNotes [82] Medium High High Projector Phones Low High High SildeShow Commander [150] Medium Medium High
i-LAND [225] High Low High
or tactile. Extensive research on attention has been reported in the areas of psychology and neuro-science [5, 267].
A comprehensive analysis of different modalities of attention is beyond the scope of this work. For the purposes of this thesis, we restrict our exploration to the switching of visual attention across different user interface elements that are visually separated across different displays in a multi-display environment. Moreover, this work is particularly focused on cross-display attention switching in mobile interaction with large displays.
Considering the navigation patterns described in Section 2.7, the focus of this thesis is on visual attention switching between a handheld mobile device and a vertical large display, following the egocentric navigation pattern. In egocentric navigation, attention switching occurs along a continuum and we are particularly concerned with that due to eye and head movements, as depicted in Figure 2.7.
ŽŐŶŝƚŝǀĞ LJĞ ,ĞĂĚ ŽĚLJ
&ŽĐƵƐŽĨdŚĞƐŝƐ
Figure 2.7: Continuum of Attention Switching in Egocentric Navigation.
2.8
Summary and Discussion
In this chapter, we discuss the proliferation of computing devices of various form factors and report on studies about multi-device usage. We provide an overview of computing pa-radigms that envisage the phenomenon of integrated user experience across heterogeneous devices. After this, we highlight some approaches towards the design of user interfaces for multi-display systems. We discuss some aspects of human vision and perception, as well as characteristics of display devices, that can be relevant to the design of effective multi-display user interfaces (MDUIs). We explain the performance gains of large displays and relate them to the use of peripheral vision, physical navigation and embodied inter-action. We indicate navigation patterns supported by different displays and highlight the scope of thesis with respect to the attention switching associated with the continuum of the navigation pattern being investigated.


![Figure 2.3: Speakeasy: A PDA displaying the controller for a PowerPoint viewer runningon a projector (used with permission from [157]).](https://thumb-us.123doks.com/thumbv2/123dok_us/8669149.376551/40.595.186.476.76.302/figure-speakeasy-displaying-controller-powerpoint-runningon-projector-permission.webp)
![Figure 2.4: Ensembles of digital devices are emerging for common usage models at home,at work, and on the road (used with permission from [210]).](https://thumb-us.123doks.com/thumbv2/123dok_us/8669149.376551/41.595.187.475.77.366/figure-ensembles-digital-devices-emerging-common-models-permission.webp)
![Figure 3.3: Visual Field & Depth Contiguous: Dual-projected vertically tiled arrangementin Dynamo (used with permission from [109]).](https://thumb-us.123doks.com/thumbv2/123dok_us/8669149.376551/66.595.186.473.301.547/figure-visual-contiguous-projected-vertically-arrangementin-dynamo-permission.webp)