A Comparison of Guiding Techniques for Out-of-View
Objects in Full-Coverage Displays
Julian Petford, Iain Carson, Miguel A. Nacenta University of St Andrews
St Andrews, Scotland
[email protected],ic48,[email protected]
Carl Gutwin University of Saskatchewan
Saskatoon, Canada [email protected]
ABSTRACT
Full-coverage displays can place visual content anywhere on the interior surfaces of a room (e.g., a weather display near the coat stand). In these settings, digital artefacts can be located behind the user and out of their field of view — meaning that it can be difficult to notify the user when these artefacts need attention. Although much research has been carried out on notification, little is known about how best to direct people to the necessary location in room environments. We designed five diverse attention-guiding techniques for full-coverage display rooms, and evaluated them in a study where participants completed search tasks guided by the different techniques. Our study provides new results about notification in full-coverage displays: we showed benefits of persistent visualisations that could be followed all the way to the target and that indicate distance-to-target. Our findings provide useful information for improving the usability of interactive full-coverage environments.
CCS CONCEPTS
•Human-centered computing→Interaction techniques; Empirical studies in HCI;Empirical studies in ubiquitous and mobile computing.
KEYWORDS
Full-coverage Displays, Smart Rooms, Guiding, Spatial Noti-fication, Target Finding, Wedges.
ACM Reference Format:
Julian Petford, Iain Carson, Miguel A. Nacenta and Carl Gutwin. 2019. A Comparison of Guiding Techniques for Out-of-View Objects
Permission to make digital or hard copies of all or part of this work for personal or classroom use is granted without fee provided that copies are not made or distributed for profit or commercial advantage and that copies bear this notice and the full citation on the first page. Copyrights for components of this work owned by others than the author(s) must be honored. Abstracting with credit is permitted. To copy otherwise, or republish, to post on servers or to redistribute to lists, requires prior specific permission and/or a fee. Request permissions from [email protected].
CHI 2019, May 4–9, 2019, Glasgow, Scotland Uk
© 2019 Copyright held by the owner/author(s). Publication rights licensed to ACM.
ACM ISBN 978-1-4503-5970-2/19/05. . . $15.00 https://doi.org/10.1145/3290605.3300288
in Full-Coverage Displays. InCHI Conference on Human Factors in Computing Systems Proceedings (CHI 2019), May 4–9, 2019, Glasgow, Scotland Uk.ACM, New York, NY, USA, 13 pages. https://doi.org/ 10.1145/3290605.3300288
1 INTRODUCTION
Full-coverage displays (FCDs) are environments where con-tent can be displayed on any of the interior surfaces of a room, using technologies such as projection [12, 62] or augmented-reality headsets [31, 37]. FCDs offer new opportunities for interactive systems: they provide a large display area and extended pixel space; they allow spatial organisation of con-tent; and they enable integration of digital artefacts with real-world activities (e.g., weather information projected near the umbrella stand, or a print queue display near the actual printer). However, the radically different geometry of FCDs compared to traditional screens means that interfaces and interaction techniques need to be redesigned for the new environment. For example, input devices need to accommo-date looking and turning anywhere in the room [42], and layout and placement schemes must take into consideration the physical objects already in the room [43].
To provide an initial investigation of this problem, we designed five different notification techniques for FCDs that use a variety of underlying visual and geometric mechanisms to convey spatial location to the user: progressively leading the user with a moving mark; projecting a static directional indicator all the way to the location of the target; indicating direction through directional flashing colours; and showing a 3D map representation of the target location—as well as a control technique that notified the user and highlighted the target, but provided no visualisation that directed their attention to the correct spatial location in the room.
We carried out a controlled experiment to compare the techniques in terms of their speed and accuracy in guiding users to targets behind or above the user (i.e., at the back of the side walls and ceiling, or on the back wall). Participants played a visually-demanding game on the front wall of the room, and when a notification occurred, they had to find the related target as quickly as possible; participants used and rated all of the five notification techniques.
This work provides four main contributions. First, we char-acterise the problem of guiding users to out-of-view content in immersive environments. Second, we present five novel notification techniques. Third, we provide empirical results about the performance of the techniques, showing that ferent design approaches lead to substantial performance dif-ferences. Fourth, we provide design principles derived from our study that help designers choose the most appropriate notification technique for a variety of FCD usage situations.
2 RELATED WORK
Full-Coverage Display interfaces originated with CAVEs [12] but, inspired by Raskar et al.’s "office of the future" vision [48], the ideas behind FCDs are now applied beyond dedicated im-mersive rooms, to work environments and domestic spaces. In the last two decades there has been increasing research in-terest in larger and larger areas of work space, starting with smart rooms [27, 49, 55] and multi-display environments [39, 41], and evolving towards spaces where almost any surface can display digital information [28, 43, 60, 62, 63]. Most of the research focuses on the issues of input [39, 42, 49, 63], tech-nical infrastructure and display technology [27, 28, 43, 60], and the models of collaboration and display space manage-ment [13, 41]. Despite being an obvious challenge in these spaces, guiding attention beyond the immediate field of view has not been studied closely for this kind of environment (however, see [7, 17]). Instead there is relevant related work in virtual environments [6, 11, 54, 57], AR [19, 20, 26, 35, 53], outdoor and public spaces [36, 47], 360◦videos [32, 33, 51, 52], and mobile or mid-sized displays, where the first techniques to point to off-screen locations (a different problem for which similar solutions apply) were invented [5, 21, 22, 38, 64].
Beyond guiding or redirecting attention, the problem of capturing attention and conveying information in a timely manner (i.e., notification) has received considerable study in the HCI community. A variety of techniques exist for PC environments [34, 59] as well as sophisticated visuals to convey wider selections of items that require the user’s visual attention [58, 65]. The circumstance of having to notify or remind users at times when they are away from a display has also been investigated, including vibrating wearables [9] and LEDs [1, 8, 14–16, 25, 56, 61]. A related stream of research addresses communicating information without having to capture the user’s attention at all [2, 3, 10, 29, 30, 46].
3 SPATIAL NOTIFICATION FRAMEWORK
There are multiple components to the spatial notification task, and several ways that users could be guided to a spatial target. Here we provide a decomposition of the task and the information needed by users and a description of design space dimensions that can be used to facilitate the task.
Spatial Notification Task Decomposition
Spatial notification becomes necessary when a system needs to alert the user of an event (e.g., new information arrives in a window) and the information itself is not in the user’s visual field. Because the new information is not immediately accessible, the user needs to be guided to look elsewhere. There are 4 phases to such notifications: 1)Pre-notification: the user is carrying out a different activity; 2)Notification: the user has to be alerted that there is potentially relevant information; 3)Attention redirection: the user changes their focus of attention to the new information (usually hav-ing to change their gaze, head or body pose), and; 4) Post-notification: the user consumes the new information, and may, or may not, return to the previous task.
In order to provide spatial notifications, the system has to be aware of the three elements above. Additionally, it might have information about the identity and the locus of attention of the user(s). This is currently possible with different degrees of accuracy through gaze trackers (e.g., COGAIN [4]), 3D position body and/or head trackers (e.g., Kinect-like sensors [41]), or simply through the input activity of the user (e.g., which windows are being used).
Design Space
We have identified six main considerations in the design of techniques that help people redirect their visual attention (which in this paper we callguiding): modality, directness, resolution, adaptivity, size/amplitude, and placement. Before we describe the main dimensions of the space, we note that spatial notifications could be implemented simply by provid-ing the new information in the locus of attention of the user (removing the need for guiding). This is a common approach for small and medium displays (e.g., “toast” notifications on mobile or desktop computers), but can be too distracting if the current task requires concentration, if the content is complex or lengthy, or if the content requires interaction. Additionally, placing new information in the user’s current locus of attention defeats the advantages of spatial distribu-tion (e.g., spatial memory, appropriate context) that motivate the use of FCDs and quasi-FCDs in the first place.
Location Information Modality. Information about a location in a room can be conveyed through signals perceived with different senses (e.g., through visuals, audio or haptics). Different modalities might have different reaction times or different accuracy, and may interfere differently with other activities [44]. In this paper we only consider visual signals because they are precise and quick.
Location Information Directness.For each modality there are ways to convey location that range from the ex-plicit and direct (i.e., directly perceivable by the senses in spatial form, such as a visual marker indicating position or direction, or a sound signal coming from a specific location), to the mediated and indirect (i.e., when there is a language or sign system that encodes the location, such as a spoken description, or a visual symbol that is mapped to a mean-ing such as “behind you”). We also consider an intermediate level, which is an indirect but spatial representation, such as a map, or a spatial model. We do not know whether di-rectness translates into increased performance, since sign systems and languages can be very efficient.
Representation Resolution.Different techniques might be able to provide location information that is very precise (e.g., indicates the specific pixel) or fairly generic (e.g., the rough location of a wall). This information and when it is
provided (e.g., at the beginning or at the end of the atten-tion redirecatten-tion phase) might affect how users plan their movement.
Adaptivity.Information about the position and/or direc-tion of a target locadirec-tion can be disclosed all at once or be progressively disclosed according to the user’s progress so that the user is gradually guided through the space until they reach the target. Adaptive guiding can potentially make good use of current user position information to provide assurance to the user, or to minimise disruption to others in the space (e.g., by only showing visuals where the user is).
Size/Amplitude. The signal conveying the location can be very subtle (e.g., a small circle, a subtle tone) or very con-spicuous, (e.g., a full wall changing colour). In some modali-ties reaction times are proportional to the amplitude of the stimulus, which might, in turn, be relevant for performance.
Notification Placement. The placement of the guiding information is important because it affects the noticeability of the signal (e.g., [23]), but also because placement might interfere with the communication of location, which is also spatial in nature.
Outcome Dimensions
Different decisions in the dimensions above are likely to influence several relevant qualities of the interaction.
Performance.As mentioned above, different modalities, degree of directness, adaptivity, amplitude, and placement can affect the speed and accuracy with which the human system can react to the stimuli. This is key for UI design, but not the only outcome or focus of this paper.
Distraction/Intrusiveness. User interfaces with FCDs support different types of activities. Some of them might require concentration, might involve group work, or might only offer partial availability of screen real estate for guid-ing. Different guiding techniques might be more appropriate depending on how intrusive or distracting they are.
Comfort and Workload.Different ways of guiding peo-ple might result in different cognitive and physical demands on users (e.g., having to mentally translate frames of refer-ence, or having to turn in awkward ways).
4 GUIDING TECHNIQUES
Figure 1: A diagram of Wedge (left) and Flashing (right). The green square marked with an 8 is the intended target. The assumed current position of the user is looking into the farthest wall from the reader (i.e., head orientation as the reader). Magenta and green areas are part of the techniques.
out of view). We assume that the user is looking onto one of the display surfaces of an FCD and is carrying out some activity, and that the system requires the visual attention of the user in a location that is out of view.
Wedge. This is an adaptation of Gustafson et al.’s Wedge [21] for off-screen targeting, referenced in Section 2. Our Wedge is a triangular shape, with its narrow tip on the target, and that extends (and grows in thickness) all the way to the edge of the wall that the user is looking at (see Figure 1.left and Video Figure). The user initially sees the broad end of this triangle; using the direction and angles visible from that part of the triangle, they can infer the approximate direction of and distance to the target. In our implementation, the triangle is drawn on the walls of the room as if the walls were all in the same plane.
Our Wedge represents location in adirectway, hashigh representation resolution(leads all the way to the target), is
non-adaptive(does not change based on the movement of the user), has amedium to large size(it uses many pixels in the room), and is always placed so that it spans the short-est distance between the current focus of attention and the target.
Point. This technique guides the user progressively to the target. A circle appears in the user’s periphery (at the side of the wall that is currently the focus). As the user turns in the direction of the circle, it moves towards the target, always staying within the periphery of the user (using the system’s head tracking). When the target is reached, the circle disappears (see Figure 2 and Video Figure). We classify this technique asdirect,high resolution(similar to Wedge),
adaptive, small in size (the point is less likely to be noticed by others and takes relatively few pixels), and following the shortest path to the target.
Flashing.This technique draws attention to the wall con-taining the target by flashing large areas on the walls that
are on the path to the target. If the target is on one of the side walls or the ceiling, a green strip flashes at the nearest edge on the front wall. If the target is on the back wall, the flashing strip is magenta (to indicate a two-wall distance); the intermediate wall on the path to the target also flashes magenta, and the nearest strip to the target on the interme-diate wall flashes green. Figure 1.right shows the back-wall target case (see both cases in the Video Figure).
This technique hasdirectandindirectcomponents (the colour signals the distance to the target—magenta if back wall and green if next wall), haslow resolution(it only indicates the wall, and does not lead to the specific location), is non-adaptive, has alarge size, anddirectional placement.
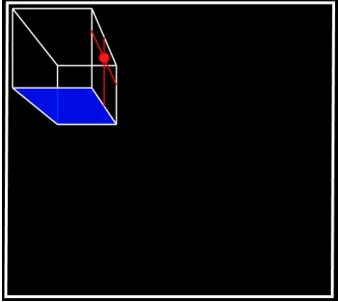
3D Radar. The Radar technique uses a World-In-Miniature (WIM) approach [54]. The radar is a wireframe-like repre-sentation of the room displayed on each of the walls at a fixed location. The target appears as a point in the radar (see Figure 3). We carried out an iterative design process with the radar to make its geometry as easy to interpret as possible. Specifically:
• The wireframe is realistically rendered on each wall using a CAVE-like perspective correction that takes into account the user’s head position in real time. This makes the projection of the room close to the retinal image that a small room model attached to the wall of the room would project on the user’s retina, and enables motion parallax (see also [24, 40]).
• The floor of the representation is highlighted in translu-cent blue. This is to avoid ambiguous Necker-cube illusion interpretations of the model [18].
• The horizontal and vertical wall coordinates of the target are represented as lines intersecting the target, which clearly indicates the wall containing the target. We classify our Radar implementation as asemi-direct tech-nique, withmedium resolution(people can get some idea of the location of the target), that isnon-adaptive1, of medium-small size, and is located in afixed positionat the top left of each wall. We considered placing the radar according to the position of the target, but this would have forced the user to interpret a much more varied set of 3D representations and to find the radar in different locations every time, which could also affect performance (see Section 7).
WedgeTrim (Pre-Study Technique).During piloting we also considered a version of the wedge that would be adaptive. A hybrid between Point and Wedge, WedgeTrim looks like a Wedge but shortens in length from the wide end as the user turns to find the object.
1Technically it adapts in real time to the position of the head, but those
Figure 2: Dynamics of the Point technique (L to R). Magenta areas show the participant’s field of view (not technique visuals).
Figure 3: The radar shown on the front wall. The participant is positioned lower than and to the right of the room rep-resentation, which is therefore looked at from below. The target is on the right wall, behind the right side of the user.
5 STUDIES
We designed empirical evaluations to find out which guid-ing techniques are best in terms of performance and user workload. Our secondary objective was to explain the causes of any differences in performance (i.e., the relationship be-tween performance and the factors in the framework). The experiments focus on Phase 3 of the Spatial Notification Task (Attention redirection–see 3) and do not address the noticeability of techniques (i.e., how likely it is that a signal is detected [23]) or how techniques can support the decision of whether to attend to specific content (e.g., [2, 3]). We de-signed an initial pre-study with a few participants in order to set technique parameters and to provide a preliminary validation of the techniques. This informed the main study. Most aspects of both studies are identical, but we highlight differences when appropriate.
Apparatus
The study took place in a 2.05m x 3.25m x 2.2m CAVE-like five-surface display space (four walls and the ceiling). The four walls and the ceiling were off-white projection surfaces. Three walls and the ceiling were projected using a hemi-spherical projector with two 4,100-lumen lamps. The remain-ing wall (the front wall, which is one of the narrow walls)
Fisheye Lens Projector Target
Back Wall
Front Wall
Distractors
Participant Position Game Rear Projector
(Front Wall)
Figure 4: Room setup and example trial, with example target (marked with 7) and example distractor locations.
was projected using a separate Sony VPL-FH35, 5,200-lumen projector (see Figure 4). The projection mapping and the ex-perimental software were implemented using the ASPECTA Toolkit [43].
Participants sat on a fully rotating chair in the middle of the room, wearing a pair of over-ear headphones with markers tracked by a set of 6 OptiTrack S250:E cameras, which provided a continuous stream of head tracking data to the experimental computer. Participants used a Jelly Comb WGJP-016 wireless numeric keypad for all input.
Tasks and Measurements
The experiment uses a dual task paradigm. To simulate an activity that demands visual attention, participants played a game inspired by rhythm games such as Guitar Hero. Fig-ure 5 shows the main elements of the game. White arrows in one of four possible directions fall vertically from the top, and the participant has to press the corresponding keypad arrow when each arrow crosses the horizon line at the bot-tom. We recorded a score but did not show it to participants. Participants were encouraged to do as well as they could at the game, and the experimenter prompted them if the frequency of misses noticeably increased.
[image:5.612.89.258.209.360.2]Figure 5: Visual structure of the game (activity task).
locations distributed over the left, right, back and ceiling walls, in the back of the room (outside the field of view of the participant). The guiding technique corresponding to the current condition would simultaneously appear to lead participants to the actual target, which could be in one of 16 positions (see Figure 6). As soon as they noticed that they had to find a target, participants had to press the enter key on the numeric keypad, which the system records astnoticed. Then they followed the technique to the target and, on finding it, pressed the enter key again, which the system records as tf ound. At this point, digits between 0 and 8 (excluding 6)2, replaced the squares of the potential targets. The participants had to remember the number corresponding to the target, return to the original position looking towards the game, and type the number that they had seen, which made the game resume. Figure 4 shows a diagram of the room at this stage. The main measurement of performance in this study is theexperimental task completion time, which is the interval betweentnoticed andtf ound.
In addition to these timed events, we also recorded 5-degree-of-freedom traces of the participant’s head position, using a sampling rate of 250Hz. We also marked trials if participants mistyped the target’s number, if participants reported finding the target before turning to it, or if partici-pants only reported finding the target after turning back. In the pre-study the experimental software added every failed trial to a queue of trials at the end, for repetition in order to attempt to obtain a valid measurement. However, this caused extended trial times and some frustration, and for the main experiment we simply discard trials with any of these errors (219 out of 7,200; 3.04%) before analysis. An additional trial had to be removed due to a failure in logging.
Conditions
In the pre-study we compared Wedge, WedgeTrim, Point, Flashing and 3D Radar. In the main study we compared Wedge, Point, Flashing and 3D Radar, as well as a condition where the participants had no assistance to find the target. ThisBaselinecondition is useful to see what the net benefit is of using a guiding technique. We removed WedgeTrim
2This is to avoid upside-down ambiguity, especially for ceiling targets
Ceiling Front
Left
Right
[image:6.612.84.264.90.181.2]Back
Figure 6: Positions of actual targets in the room.
because it showed very similar performance to Wedge, and to avoid fatigue in a longer study.
A key difference between the conditions in the two stud-ies is that, in the pre-study, the correct target was only highlighted for the Flashing technique (alternation between RGB(0,255,0) and RGB(255,0,255) colours of a 7 cm thick edge around the target, every 0.5 seconds), whereas in the main study the target was always highlighted, regardless of condition. This had clear effects in the performance of the techniques, which we describe in Section 6.
Procedure and Participants
Participants gave written consent and were assigned to a random order of techniques selected from a balanced 5 by 10 Latin square. Before the trials for each technique, participants received an explanation of each technique and practised until they felt confident, for a minimum of four trials. After each technique participants completed a NASA TLX questionnaire. Participants completed 3 (repetitions) * 4 (targets per wall) * 4 (walls) * 5 (techniques) = 240 trials. Five participants (aged 24-50, 2 female) participated in the pre-study, and 30 (aged 19-55, 16 female) in the main study. The full experiment lasted approximately one hour, and participants were compensated with a gift voucher.
6 RESULTS
We structure the presentation of the results in four parts. First we briefly present the relevant analyses of the pre-study data. Second, we present the core results of the main study - the comparison of guiding techniques. Third, we look at the influence of location for finding targets. Fourth, we describe post-hoc analyses that we carried out to explore factors underlying the performance differences.
averages. All error bars in figures represent 95% confidence intervals. Pair-wise comparison tests between techniques are only carried out if the omnibus test is significant, and are all pre-adjusted using Bonferroni’s procedure (α =0.05 after correction) unless otherwise stated. Analysis of Likert-scale data is based on non-parametric tests.
Pre-study Results
Although we only ran five participants in the pre-study, effect sizes were sufficiently large to provide valuable information and guide the design of the main study. Nevertheless, the results in this section should be interpreted with caution, as a sample of five participants might not be representative of the larger population.
An ANOVA of the log-transformed experimental task completion time (tf ound−tnoticed), with guiding technique
and target location as fixed factors and participant as ran-dom factor showed a strong effect of guiding technique (F(4,16) = 23.407,p < 0.001,η2p = 0.854), of the target location (F(15,60.3)=9.943,p <0.001,η2p=0.712) and the interaction (F(60,240.5)=1.693,p<0.005,ηp2 =0.297).
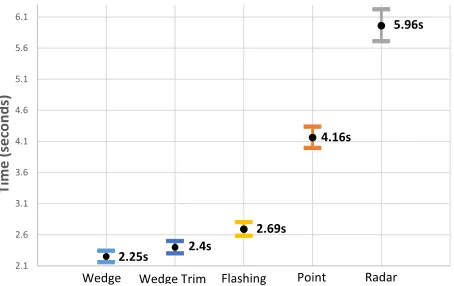
The pairwise comparisons of techniques were all signif-icant (p < 0.05), except between Wedge and WedgeTrim (p = 0.32). The mean timing values with 95% confidence intervals are in Figure 7. Radar was the slowest technique (µRadar =5.96s,SD =1.79s), on average 2.6 times slower than Wedge (µW edдe =2.25s,SD=1.4s). In this pre-study the target was not highlighted, and therefore participants chose the target from among all distractors based only on the information provided by the wireframe radar representa-tion. We observed large numbers of errors for this technique (which led to many repeated trials). In contrast, participants did not encounter the same kind of problem with the Wedge techniques because these led participants directly to the tar-get. Interestingly, the performance of Point was fairly slow (µPoint=4.16s,SD=1.71s), despite the fact that the Point also leads the user all the way to the target (although in an adaptive way). However, in this technique we noticed that participants felt compelled to slowly follow the dot.
Although some items of the NASA TLX showed ences, these were not statistically powerful enough to differ-entiate between techniques, and we do not report them.
Main Study Technique Comparisons
The ANOVA of the log-transformed experimental task com-pletion time (our main measure), with guiding technique and target location as fixed factors and participant as random fac-tor showed a clear effect of technique (F(4,116)=22.581,p< 0.001,ηp2 =0.438), of the target location (F(15,438)=34.565, p<0.001,ηp2 =0.542) and their interaction (F(60,1774.5)=
3.224,p <0.000,η2p=0.098).
2.1 2.6 3.1 3.6 4.1 4.6 5.1 5.6 6.1
Ti
m
e (
sec
onds
)
Technique
Wedge Wedge Trim Flashing Point Radar
2.25s 2.4s
2.69s 4.16s
[image:7.612.325.552.98.241.2]5.96s
Figure 7: Experimental completion times in the pre-study, by technique. Vertical scale does not start at 0.
1.6 1.7 1.8 1.9 2 2.1 2.2 2.3 2.4 2.5 2.6
Ti
m
e (
sec
onds
)
Technique
Wedge Flashing Radar Point Baseline
1.73s
1.88s
2.05s 2.22s
[image:7.612.324.553.285.430.2]2.48s
Figure 8: Experimental completion times in the main study, by technique. Vertical scale does not start at 0.
The pairwise comparisons between techniques were all significant (allp <0.001) and the mean timing values with 95% confidence intervals can be seen in Figure 8. All tech-niques are faster than the baseline (µBaseline =2.48s,SD=
1.4s), with Wedge fastest on average (µW edдe=1.73s,SD=
1.36s, 30.2% faster than the baseline), followed by Flashing (µF lashinд = 1.88s, SD = 1.34s, 24.2%), Radar (µRadar =
2.05s,SD =1.38s, 17.3%) and Point (µPoint =2.22s,SD = 1.53s, 10.5%).
0 1 2 3 4 5 6 7 8 9 10 µ Mdn χ2 p H.S.
Me
nt
al
Wedge 4 5 14 3 2 0 1 0 0 1 0 2.17 2
15.52 0.004
Flashing 3 8 9 3 4 1 0 0 1 1 0 2.43 2
Radar 3 6 7 5 4 1 3 0 0 1 0 2.77 2
Point 1 9 6 6 4 1 0 1 2 0 0 2.77 2
Baseline 0 5 10 3 5 1 4 0 2 0 0 3.3 2.5
Phy
sic
al
Wedge 6 10 6 2 1 2 2 1 0 0 0 2.03 1
20.97 0
Flashing 5 10 6 1 5 0 3 0 0 0 0 2.1 1.5
Radar 6 10 4 4 2 1 2 1 0 0 0 2.07 1
Point 4 10 3 3 4 2 2 2 0 0 0 2.57 2
Baseline 4 2 6 3 5 5 2 1 2 0 0 3.43 3.5
Te
m
po
ra
l Wedge 5 5 9 6 2 2 0 0 1 0 0 2.23 2
10.79 0.029
Flashing 5 6 7 8 1 1 1 0 0 1 0 2.27 2
Radar 5 7 6 5 1 4 1 0 0 0 1 2.47 2
Point 3 7 6 6 5 1 0 2 0 0 0 2.53 2
Baseline 3 5 3 9 4 3 1 2 0 0 0 2.97 3
Pe
rfo
rm
anc
e Wedge 2 6 5 7 3 3 2 1 1 0 0 3.03 3
5.27 0.261
Flashing 1 7 5 5 4 3 2 2 0 1 0 3.27 3
Radar 4 7 3 6 3 4 0 2 1 0 0 2.83 3
Point 2 7 4 4 3 5 3 2 0 0 0 3.2 3
Baseline 1 7 3 7 3 3 3 1 2 0 0 3.4 3
Effo
rt
Wedge 2 8 7 7 2 2 0 1 0 1 0 2.57 2
11.7 0.02
Flashing 1 8 11 1 2 4 1 0 1 1 0 2.8 2
Radar 4 5 8 3 1 4 3 1 0 1 0 2.93 2
Point 1 7 5 4 3 4 3 1 2 0 0 3.4 3
Baseline 0 6 3 6 6 4 3 1 0 1 0 3.6 3.5
Fr
ust
ra
tio
n Wedge 9 7 5 4 2 1 2 0 0 0 0 1.8 1
9.56 0.049
Flashing 10 7 2 4 1 3 2 1 0 0 0 2.03 1
Radar 13 5 1 3 4 2 0 1 1 0 0 1.9 1
Point 11 3 2 3 5 0 2 3 1 0 0 2.57 2
[image:8.612.53.297.91.348.2]Baseline 8 5 4 3 3 1 3 2 1 0 0 2.63 2
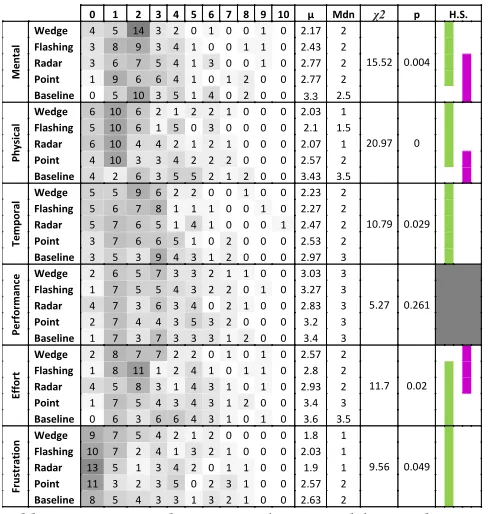
Table 1: NASA TLX histograms (main study). H.S. denotes homogeneous subsets.
Target Wall Analysis
To determine how target wall affects the time to reach the target with different guiding techniques, we ran an ANOVA similar to the one above but with target wall instead of individual target location as one of the fixed factors. The wall showed a significant main effect (F(3,87.1)=66.668, p < 0.01,ηp2 = 0.697), and there was an interaction be-tween the wall and the guiding condition (F(12,349)=6.658, p<0.001,η2
p=0.186).
Table 2 shows the average times, per technique, of the wall locations. There are two notable patterns: First, targets in the ceiling are consistently slower to reach than the left or right walls, independently of the guiding techniques, and despite angular distances being identical to their side counterparts. In fact, we found no statistically significant difference be-tween the times for the ceiling and from those on the back wall, which require wider rotations. The exception is the baseline, where the ceiling was slower than the back wall. Second, with the Point and Radar techniques, targets on the right wall are slower to reach than targets on the left.
Main Study Post-hoc Analyses
We were interested in whether the differences in perfor-mance stemmed from the time required to interpret the visu-als of the guiding technique, from slower movement, from inefficient movement, or a combination of these. To find out we used the head pose logs and analysed the rotation signal
Wedges Flashing Radar Point Baseline
Ceiling (seconds) 1.86 2.04 2.15 2.45 2.74
Left (seconds) 1.6 1.73 1.87 1.93 2.39
Right (seconds) 1.57 1.71 1.96 2.09 2.43
Back (seconds) 1.91 2.05 2.21 2.48 2.38
Left < Right (%) N.S. N.S. 4.58 7.67 N.S.
Left < Ceiling (%) 13.93 15 13.04 21.13 12.85
Right < Ceiling (%) 15.17 15.89 8.86 14.58 11.38
Left < Back (%) 16.28 15.61 15.42 22.33 N.S.
Right < Back (%) 17.48 16.49 11.36 15.89 N.S.
Back < Ceiling (%) N.S. N.S. N.S. N.S. 13.17
[image:8.612.318.558.94.217.2]
Table 2: Completion times per wall per technique, and com-parisons. “N.S.” indicates that the pairwise comparison was non-significant (after Bonferroni).
(angular difference between head and target direction, over time). We processed the signal as follows: A) we eliminated trials for which the tracking of the signal was not consistent (i.e., had more than 30 missed samples, 448 out of 6,975 non-failed trials), B) we filtered the signal with a 3Hz low-pass filter; C) we marked the approximate time at which the ro-tation started (a threshold detection at 5% of the range of movement, which we calltrotation_star t), D) we marked the
approximate time at which the rotation ended (trotation_end–
the point at which participants had come to within 5% of their final rotation), and E) for back wall targets, we detected whether the rotation was done clockwise or anti-clockwise. Due to the design of our experiment it was possible that trotation_star t would be earlier thantnoticed(Section 5)3.
An ANOVA ofpre-movement time(trotation_star t−tnotice), with technique and target as fixed factors and participant as random factor showed a significant main effect of tech-nique (F(4,117) = 66.947,p < 0.001,η2p = 0.696), target
(F(15,446.6) =4.348,p < 0.001,η2
p =0.127), and a
signif-icant interaction (F(60,1858.6) = 6.862,p < 0.001,η2
p =
0.181). Figure 9 shows that the time it takes people to start moving roughly corresponds to the performance of the tech-niques, except for the baseline, which took longer. All pair-wise comparisons were significant (p <0.005), except Point vs. Radar (p=0.465).
The same ANOVA onhead turning time(trotation_end − trotation_star t) also showed main effects of technique (F(4,
116) = 22.361,p < 0.001,η2
p = 0.435), target location
(F(15,444.3) = 45.318,p < 0.001,η2p = 0.605) and a sig-nificant interaction (F(60,1838.6)=4.219,p <0.001,η2p =
3This means that participants pressed the ’noticed’ button after they started
0.121). Figure 9 shows the same pattern, except that peo-ple turned faster with the Radar than with any of the other techniques.
Finally, a repeated-measures ANOVA of the proportion of turns (for targets in the back wall) that were done through the shortest path (one measure per participant), with technique as within-subjects factor, showed a main effect of technique (F(4,1.9) = 175.098,p < 0.001,ηp2 = 0.858). As expected, without any guiding technique participants made an ineffi-cient turn about 50% of the time. All other techniques except for Radar showed almost completely efficient turns for back targets (see Figure 9).
7 DISCUSSION
In the following sections we summarise the main findings for each of the guiding techniques and relate these findings to the dimensions of the framework presented earlier; we then discuss the generalisability of our results and directions for future research.
Summary by Technique
Wedge.The Wedge was the fastest technique (750ms faster
than Baseline, and 15ms faster than Flashing), and had a low subjective workload. In terms of the framework, the main advantages of Wedge appeared to be its directness and resolution (i.e., it was easy for participants to find the target without cognitive effort or visual search), and its relatively large size (making it easy to see and follow).
Point.The Point technique provides a useful comparison
to the two Wedge variants for evaluating the usefulness of adaptivity (i.e., changing based on the user’s head direction). Point’s performance was relatively poor overall, and our observations suggest that adaptivity may have slowed the technique down. In some Point trials, participants appeared to move more slowly as they tracked the moving dot - even though it was the dot that tracked the participant (i.e., they could have moved as quickly as they wanted). In contrast, the static representation of the Wedge seemed to provide greater stability for ballistic turning motions. It is interesting to note that the Wedge variant tested in the pre-study (Wedge Trim, which adaptively diminished the trailing edge of the wedge as the participant turned) was slower than the plain Wedge, further suggesting that adaptivity is not useful for guiding. However, one potential advantage of Point is that it uses far fewer pixels than Wedge or Flashing, and therefore it may be suitable for multi-user situations where reducing others’ distraction is a primary requirement.
Flashing.The Flashing technique also performed well (in
second place to Wedge), and its performance is likely at-tributable to its large size and simplicity. Despite its obvious noticeability, Flashing probably required additional cognitive
and perceptual effort because it used a mapped information variable (green for a distance of one wall, magenta for a two-wall distance) and because it did not precisely indicate the target. In situations where the target is not highlighted, users could have difficulty determining where in the wall the target is located. The size of Flashing also makes it un-suitable for situations where distraction must be minimised (e.g., Flashing would be unusable for multi-user settings).
Radar.The Radar view was quite different from the other
techniques, in that it presented a separate reference frame (World-In-Miniature) for interpreting the target’s location. This need for interpretation is likely one cause for its slightly slower performance (faster than Point, but slower than Flash-ing and Wedge); another is that the Radar was unable to precisely convey the target’s location (meaning that partici-pants moved faster to the wall, but had to look for the target once they had turned); a third is that the fixed location of the radar on the wall appeared to often lead participants to turn the wrong way. This effect could potentially be addressed by moving the radar to the appropriate side of the focus wall -but there are other advantages to having a spatially-stable representation that can be learned and quickly checked with a glance. Finally, the asymmetry and location to the side of the front wall could have have resulted in longer average times. Further studies will be needed to explore these issues. Overall, however, the Radar is a reasonable general solution, in that it performed well and is not highly distracting.
Although there are differences between the guiding tech-niques, it is important to note that all of them performed significantly better than the baseline. Therefore, the decision about which technique is best can be guided by the task requirements and other characteristics of the setting, such as whether there are other people in the room.
Other Findings
Our per-wall analysis shows that the ceiling is a slower loca-tion to find targets without guidance, and a localoca-tion that is slower to guide attention to. This, combined with previous results in the domain of input [42] suggests that content that requires frequent access should not be placed in the back part of the ceiling. Nevertheless, due to its size and lack of use, the ceiling remains a potentially useful unexploited part of the available display real estate in FCDs.
0.9 0.95 1 1.05 1.1 1.15 1.2 1.25 1.3
0.96s 1.01s
0.92s 1.13s
1.24s
Baseline Point Radar Flashing
Wedge 35
45 55 65 75 85 95 105
42.73% 67.78%
98% 99.06%
99.67%
Baseline Point Radar Flashing Wedge 0
0.1 0.2 0.3 0.4 0.5 0.6
Baseline Point Radar Flashing Wedge
0.08s 0.13s
0.18s 0.2s
0.52s
Pr
e-M
ov
em
en
t T
im
e (
s)
He
ad
Tu
rn
in
g T
ime
(s
)
Ef
fici
en
t T
ur
ns
(%
[image:10.612.60.558.91.194.2])
Figure 9: The means and 95% confidence intervals for pre-movement time (left), head turning time (center) and efficient turning percentage (right) with each technique.
times of the Radar in the pre-study. Further consideration of this problem of perspective and representation might open up interesting new solutions that are also relevant in other subareas such as VR and AR (see, e.g., [50]).
Completion times were different in some techniques for targets in the left and the right walls. Left-right asymmetry is not uncommon in HCI and motor studies and can be due to a range of different causes, including human laterality and the location of input control on one hand.
Generalisability, Limitations and Future Work As the first empirical measurements of guiding techniques for FCDs, our studies simplified the space to a simple rectan-gular room without landmarks other than the plain geome-try of the room. Although we believe that the more complex space geometries (e.g., L-shaped rooms) and visually crowded spaces of the real world will only increase the benefit of us-ing guidus-ing techniques, the specific effects of objects and landmarks for the different techniques and design decisions described in our framework will require further study.
The framework also highlights that, in real UIs, the task will not only require guiding, but simultaneous notification and, in some cases, allowing the user to decide whether to let the system guide them elsewhere. In this study we focused solely on the guidance process. We explicitly avoided explor-ing the effect of different techniques on reaction times to notifications and we did not investigate the possible interac-tions that the technique designs could potentially have across both notification and guidance. Although we speculate that the two phases are largely independent, determining this empirically will require new experiments explicitly designed for this purpose. Interactions between the different stages and subparts of the task will demand experimental designs that are environmentally closer to actual tasks performed in real-world rooms with FCD systems. However, as a conse-quence of our focus on guidance, the reported results will also be useful for designs with tasks that do not include no-tification (e.g., following a“link” from one document in the room to a different location in the space).
We also plan to further explore several specific issues raised by our study. First, it will be useful to pinpoint the exact sources of the advantages we observed. Second, we will investigate how the techniques can be adjusted to make them more or less subtle (e.g., using a narrower triangle for the Wedge), giving us more control over intrusiveness. Third, we will refine the techniques for use in collaborative settings, and test both effectiveness and distraction with multiple peo-ple in the room. Fourth, we will consider other designs and placements of the Radar, and compare the tradeoff between a display that is more informative about the stimulus, and one that remains in a reliable spatial location. Finally, we will test our techniques with other visual technologies such as the HoloLens AR system.
8 CONCLUSION
Many of the digital objects in a full-coverage display envi-ronment may be behind the user, and therefore out of view. When these objects need attention, it can be difficult for the system to notify the user and lead them to the correct object at the back of the environment. Although much research has been done on notification in general, little is known about how best to direct people to out-of-view locations in FCDs. To address this problem, we designed four attention-guiding techniques that take different approaches on several different design dimensions. We evaluated these techniques in a con-trolled study that simulated a realistic attention-demanding task in an FCD. The study showed that the Wedge technique performed best, but also showed how the fundamental dif-ferences between the guiding techniques led to several per-formance differences. Our findings provide designers with useful new information that can improve the effectiveness and usability of interactive full-coverage environments.
REFERENCES
[2] Mark Altosaar, Roel Vertegaal, Changuk Sohn, and Daniel Cheng. 2006. AuraOrb: Social Notification Appliance. InCHI ’06 Extended Abstracts on Human Factors in Computing Systems (CHI EA ’06). ACM, New York, NY, USA, 381–386. https://doi.org/10.1145/1125451.1125533 [3] Mark Altosaar, Roel Vertegaal, Changuk Sohn, and Daniel Cheng.
2006. AuraOrb: Using Social Awareness Cues in the Design of Pro-gressive Notification Appliances. InProceedings of the 18th Australia Conference on Computer-Human Interaction: Design: Activities, Artefacts and Environments (OZCHI ’06). ACM, New York, NY, USA, 159–166. https://doi.org/10.1145/1228175.1228204
[4] Richard Bates, M. Donegan, H. O. Istance, J. P. Hansen, and K.-J. Räihä. 2007. Introducing COGAIN: communication by gaze interaction. Uni-versal Access in the Information Society6, 2 (01 Sep 2007), 159–166. https://doi.org/10.1007/s10209-007-0077-9
[5] Patrick Baudisch and Ruth Rosenholtz. 2003. Halo: A Technique for Visualizing Off-screen Objects. InProceedings of the SIGCHI Conference on Human Factors in Computing Systems (CHI ’03). ACM, New York, NY, USA, 481–488. https://doi.org/10.1145/642611.642695
[6] Stefano Burigat and Luca Chittaro. 2007. Navigation in 3D Virtual Environments: Effects of User Experience and Location-pointing Nav-igation Aids.Int. J. Hum.-Comput. Stud.65, 11 (Nov. 2007), 945–958. https://doi.org/10.1016/j.ijhcs.2007.07.003
[7] Andreas Butz, Michael Schneider, and Mira Spassova. 2004. Search-Light – A Search-Lightweight Search Function for Pervasive Environments. InPervasive Computing, Alois Ferscha and Friedemann Mattern (Eds.). Springer Berlin Heidelberg, Berlin, Heidelberg, 351–356. https: //doi.org/10.1007/978-3-540-24646-6_26
[8] Christopher S. Campbell and Peter Tarasewich. 2004. Designing Visual Notification Cues for Mobile Devices. InCHI ’04 Extended Abstracts on Human Factors in Computing Systems (CHI EA ’04). ACM, New York, NY, USA, 1199–1202. https://doi.org/10.1145/985921.986023 [9] Marta G. Carcedo, Soon Hau Chua, Simon Perrault, PawełWozniak,
Raj Joshi, Mohammad Obaid, Morten Fjeld, and Shengdong Zhao. 2016. HaptiColor: Interpolating Color Information As Haptic Feedback to Assist the Colorblind. InProceedings of the 2016 CHI Conference on Human Factors in Computing Systems (CHI ’16). ACM, New York, NY, USA, 3572–3583. https://doi.org/10.1145/2858036.2858220
[10] Angela Chang, Ben Resner, Brad Koerner, XingChen Wang, and Hi-roshi Ishii. 2001. LumiTouch: An Emotional Communication De-vice. InCHI ’01 Extended Abstracts on Human Factors in Computing Systems (CHI EA ’01). ACM, New York, NY, USA, 313–314. https: //doi.org/10.1145/634067.634252
[11] Luca Chittaro and Stefano Burigat. 2004. 3D Location-pointing As a Navigation Aid in Virtual Environments. InProceedings of the Working Conference on Advanced Visual Interfaces (AVI ’04). ACM, New York, NY, USA, 267–274. https://doi.org/10.1145/989863.989910
[12] Carolina Cruz-Neira, Daniel J. Sandin, Thomas A. DeFanti, Robert V. Kenyon, and John C. Hart. 1992. The CAVE: Audio Visual Experience Automatic Virtual Environment. Commun. ACM35, 6 (June 1992), 64–72. https://doi.org/10.1145/129888.129892
[13] Andreas Rene Fender, Hrvoje Benko, and Andy Wilson. 2017. Mee-tAlive: Room-Scale Omni-Directional Display System for Multi-User Content and Control Sharing. InProceedings of the 2017 ACM Interna-tional Conference on Interactive Surfaces and Spaces (ISS ’17). ACM, New York, NY, USA, 106–115. https://doi.org/10.1145/3132272.3134117 [14] Jutta Fortmann, Vanessa Cobus, Wilko Heuten, and Susanne Boll. 2014.
WaterJewel: Be Aware of Your Daily Servings of Water with an LED-illuminated Bracelet. InProceedings of the 8th International Conference on Pervasive Computing Technologies for Healthcare (PervasiveHealth ’14). ICST (Institute for Computer Sciences, Social-Informatics and Telecommunications Engineering), ICST, Brussels, Belgium, Belgium, 195–196. https://doi.org/10.4108/icst.pervasivehealth.2014.255270
[15] Jutta Fortmann, Heiko Müller, Susanne Boll, and Wilko Heuten. 2013. Illumee: Aesthetic Light Bracelet As a Wearable Information Display for Everyday Life. InProceedings of the 2013 ACM Conference on Per-vasive and Ubiquitous Computing Adjunct Publication (UbiComp ’13 Adjunct). ACM, New York, NY, USA, 393–396. https://doi.org/10.1145/ 2494091.2495970
[16] Jutta Fortmann, Heiko Müller, Wilko Heuten, and Susanne Boll. 2014. How to Present Information on Wrist-worn Point-light Displays. In
Proceedings of the 8th Nordic Conference on Human-Computer Interac-tion: Fun, Fast, Foundational (NordiCHI ’14). ACM, New York, NY, USA, 955–958. https://doi.org/10.1145/2639189.2670249
[17] Hind Gacem, Gilles Bailly, James Eagan, and Eric Lecolinet. 2015. Find-ing Objects Faster in Dense Environments UsFind-ing a Projection Aug-mented Robotic Arm. InHuman-Computer Interaction – INTERACT 2015, Julio Abascal, Simone Barbosa, Mirko Fetter, Tom Gross, Philippe Palanque, and Marco Winckler (Eds.). Springer International Publish-ing, Cham, 221–238. https://doi.org/10.1007/978-3-319-22698-9_15 [18] Richard Langton Gregory, John Zachary Young, and Hugh
Christo-pher Longuet-Higgins. 1968. Perceptual illusions and brain models.
Proceedings of the Royal Society of London B: Biological Sciences171, 1024, 279–296. https://doi.org/10.1098/rspb.1968.0071
[19] Uwe Gruenefeld, Abdallah El Ali, Wilko Heuten, and Susanne Boll. 2017. Visualizing Out-of-view Objects in Head-mounted Augmented Reality. InProceedings of the 19th International Conference on Human-Computer Interaction with Mobile Devices and Services (MobileHCI ’17). ACM, New York, NY, USA, Article 81, 7 pages. https://doi.org/10.1145/ 3098279.3122124
[20] Uwe Gruenefeld, Dag Ennenga, Abdallah El Ali, Wilko Heuten, and Su-sanne Boll. 2017. EyeSee360: Designing a Visualization Technique for Out-of-view Objects in Head-mounted Augmented Reality. In Proceed-ings of the 5th Symposium on Spatial User Interaction (SUI ’17). ACM, New York, NY, USA, 109–118. https://doi.org/10.1145/3131277.3132175 [21] Sean Gustafson, Patrick Baudisch, Carl Gutwin, and Pourang Irani. 2008. Wedge: Clutter-free Visualization of Off-screen Locations. In
Proceedings of the SIGCHI Conference on Human Factors in Computing Systems (CHI ’08). ACM, New York, NY, USA, 787–796. https://doi. org/10.1145/1357054.1357179
[22] Sean G. Gustafson and Pourang P. Irani. 2007. Comparing Visualiza-tions for Tracking Off-screen Moving Targets. InCHI ’07 Extended Ab-stracts on Human Factors in Computing Systems (CHI EA ’07). ACM, New York, NY, USA, 2399–2404. https://doi.org/10.1145/1240866.1241014 [23] Carl Gutwin, Andy Cockburn, and Ashley Coveney. 2017.
Periph-eral Popout: The Influence of Visual Angle and Stimulus Intensity on Popout Effects. InProceedings of the 2017 CHI Conference on Human Factors in Computing Systems (CHI ’17). ACM, New York, NY, USA, 208–219. https://doi.org/10.1145/3025453.3025984
[24] Mark Hancock, Miguel Nacenta, Carl Gutwin, and Sheelagh Carpen-dale. 2009. The Effects of Changing Projection Geometry on the Interpretation of 3D Orientation on Tabletops. InProceedings of the ACM International Conference on Interactive Tabletops and Surfaces (ITS ’09). ACM, New York, NY, USA, 157–164. https://doi.org/10.1145/ 1731903.1731934
[27] Brad Johanson, Armando Fox, and Terry Winograd. 2002. The In-teractive Workspaces Project: Experiences with Ubiquitous Com-puting Rooms. IEEE Pervasive Computing1, 2 (April 2002), 67–74. https://doi.org/10.1109/MPRV.2002.1012339
[28] Brett R. Jones, Hrvoje Benko, Eyal Ofek, and Andrew D. Wilson. 2013. IllumiRoom: Peripheral Projected Illusions for Interactive Experiences. InACM SIGGRAPH 2013 Emerging Technologies (SIGGRAPH ’13). ACM, New York, NY, USA, Article 7, 1 pages. https://doi.org/10.1145/2503368. 2503375
[29] Lee Jones, John McClelland, Phonesavanh Thongsouksanoumane, and Audrey Girouard. 2017. Ambient Notifications with Shape Changing Circuits in Peripheral Locations. InProceedings of the 2017 ACM Inter-national Conference on Interactive Surfaces and Spaces (ISS ’17). ACM, New York, NY, USA, 405–408. https://doi.org/10.1145/3132272.3132291 [30] Kazuki Kobayashi and Seiji Yamada. 2013. Shape Changing Device for Notification. InProceedings of the Adjunct Publication of the 26th Annual ACM Symposium on User Interface Software and Technology (UIST ’13 Adjunct). ACM, New York, NY, USA, 71–72. https://doi.org/ 10.1145/2508468.2514715
[31] Magic Leap. 2018. Magic Leap One: Creator Edition | Magic Leap. https://www.magicleap.com/magic-leap-one
[32] Yen-Chen Lin, Yung-Ju Chang, Hou-Ning Hu, Hsien-Tzu Cheng, Chi-Wen Huang, and Min Sun. 2017. Tell Me Where to Look: Investigating Ways for Assisting Focus in 360◦Video. InProceedings of the 2017 CHI Conference on Human Factors in Computing Systems (CHI ’17). ACM, New York, NY, USA, 2535–2545. https://doi.org/10.1145/3025453. 3025757
[33] Yung-Ta Lin, Yi-Chi Liao, Shan-Yuan Teng, Yi-Ju Chung, Liwei Chan, and Bing-Yu Chen. 2017. Outside-In: Visualizing Out-of-Sight Regions-of-Interest in a 360◦Video Using Spatial Picture-in-Picture Previews. InProceedings of the 30th Annual ACM Symposium on User Interface Software and Technology (UIST ’17). ACM, New York, NY, USA, 255–265. https://doi.org/10.1145/3126594.3126656
[34] Paul P. Maglio and Christopher S. Campbell. 2000. Tradeoffs in Display-ing Peripheral Information. InProceedings of the SIGCHI Conference on Human Factors in Computing Systems (CHI ’00). ACM, New York, NY, USA, 241–248. https://doi.org/10.1145/332040.332438
[35] Shizuko Matsuzoe, Shan Jiang, Miwa Ueki, and Keiju Okabayashi. 2017. Intuitive Visualization Method for Locating Off-screen Objects Inspired by Motion Perception in Peripheral Vision. InProceedings of the 8th Augmented Human International Conference (AH ’17). ACM, New York, NY, USA, Article 29, 4 pages. https://doi.org/10.1145/3041164.3041198 [36] Andrii Matviienko, Andreas Löcken, Abdallah El Ali, Wilko Heuten, and Susanne Boll. 2016. NaviLight: Investigating Ambient Light Dis-plays for Turn-by-turn Navigation in Cars. InProceedings of the 18th International Conference on Human-Computer Interaction with Mobile Devices and Services (MobileHCI ’16). ACM, New York, NY, USA, 283– 294. https://doi.org/10.1145/2935334.2935359
[37] Microsoft. 2018. Microsoft HoloLens | The Leader in Mixed Reality Technology. https://www.microsoft.com/en-us/hololens
[38] Heiko Müller, Andreas Löcken, Wilko Heuten, and Susanne Boll. 2014. Sparkle: An Ambient Light Display for Dynamic Off-screen Points of Interest. InProceedings of the 8th Nordic Conference on Human-Computer Interaction: Fun, Fast, Foundational (NordiCHI ’14). ACM, New York, NY, USA, 51–60. https://doi.org/10.1145/2639189.2639205 [39] Miguel A. Nacenta, Dzmitry Aliakseyeu, Sriram Subramanian, and Carl Gutwin. 2005. A Comparison of Techniques for Multi-display Reaching. InProceedings of the SIGCHI Conference on Human Factors in Computing Systems (CHI ’05). ACM, New York, NY, USA, 371–380. https://doi.org/10.1145/1054972.1055024
[40] Miguel A. Nacenta, Mark Hancock, Carl Gutwin, and Sheelagh Carpen-dale. 2016. The Effects of Changing Projection Geometry on Perception
of 3D Objects on and Around Tabletops.ACM Trans. Comput.-Hum. Interact.23, 2, Article 11 (May 2016), 54 pages. https://doi.org/10.1145/ 2845081
[41] Miguel A. Nacenta, Satoshi Sakurai, Tokuo Yamaguchi, Yohei Miki, Yuichi Itoh, Yoshifumi Kitamura, Sriram Subramanian, and Carl Gutwin. 2007. E-conic: A Perspective-aware Interface for Multi-display Environments. InProceedings of the 20th Annual ACM Symposium on User Interface Software and Technology (UIST ’07). ACM, New York, NY, USA, 279–288. https://doi.org/10.1145/1294211.1294260
[42] Julian Petford, Miguel A. Nacenta, and Carl Gutwin. 2018. Pointing All Around You: Selection Performance of Mouse and Ray-Cast Pointing in Full-Coverage Displays. InProceedings of the 2018 CHI Conference on Human Factors in Computing Systems (CHI ’18). ACM, New York, NY, USA, Article 533, 14 pages. https://doi.org/10.1145/3173574.3174107 [43] Julian Petford, Miguel A. Nacenta, Carl Gutwin, Joseph Eremondi, and Cody Ede. 2016. The ASPECTA Toolkit: Affordable Full Coverage Displays. InProceedings of the 5th ACM International Symposium on Pervasive Displays (PerDis ’16). ACM, New York, NY, USA, 87–105. https://doi.org/10.1145/2914920.2915006
[44] Ioannis Politis, Stephen Brewster, and Frank Pollick. 2015. Language-based Multimodal Displays for the Handover of Control in Au-tonomous Cars. InProceedings of the 7th International Conference on Automotive User Interfaces and Interactive Vehicular Applications (Au-tomotiveUI ’15). ACM, New York, NY, USA, 3–10. https://doi.org/10. 1145/2799250.2799262
[45] Luis C. Populin. 2008. Human sound localization: measurements in untrained, head-unrestrained subjects using gaze as a pointer.
Experimental Brain Research190, 1 (01 Sep 2008), 11–30. https: //doi.org/10.1007/s00221-008-1445-2
[46] Kathrin Probst, Michael Haller, Kentaro Yasu, Maki Sugimoto, and Masahiko Inami. 2013. Move-it Sticky Notes Providing Active Physical Feedback Through Motion. InProceedings of the 8th International Con-ference on Tangible, Embedded and Embodied Interaction (TEI ’14). ACM, New York, NY, USA, 29–36. https://doi.org/10.1145/2540930.2540932 [47] Matti Rantanen, Antti Oulasvirta, Jan Blom, Sauli Tiitta, and Martti Mäntylä. 2004. InfoRadar: Group and Public Messaging in the Mobile Context. InProceedings of the Third Nordic Conference on Human-computer Interaction (NordiCHI ’04). ACM, New York, NY, USA, 131– 140. https://doi.org/10.1145/1028014.1028035
[48] Ramesh Raskar, Greg Welch, Matt Cutts, Adam Lake, Lev Stesin, and Henry Fuchs. 1998. The Office of the Future: A Unified Approach to Image-based Modeling and Spatially Immersive Displays. In Pro-ceedings of the 25th Annual Conference on Computer Graphics and Interactive Techniques (SIGGRAPH ’98). ACM, New York, NY, USA, 179–188. https://doi.org/10.1145/280814.280861
[49] Jun Rekimoto and Masanori Saitoh. 1999. Augmented Surfaces: A Spatially Continuous Work Space for Hybrid Computing Environ-ments. InProceedings of the SIGCHI Conference on Human Factors in Computing Systems (CHI ’99). ACM, New York, NY, USA, 378–385. https://doi.org/10.1145/302979.303113
[50] Massimo Scolari. 2012.Oblique drawing: A history of anti-perspective. MIT press.
[51] Saqib Shah. 2016. Facebook now lets you guide viewers around your 360-degree video. https://www.digitaltrends.com/social-media/ facebook-360-video-tools-analytics/
[52] A. Sheikh. 2016. Directing attention in 360-degree video. IET Conference Proceedings(January 2016), 29 (9 .)–29 (9 .)(1). https: //doi.org/10.1049/ibc.2016.0029
//doi.org/10.1145/2535597.2535608
[54] Richard Stoakley, Matthew J. Conway, and Randy Pausch. 1995. Virtual Reality on a WIM: Interactive Worlds in Miniature. InProceedings of the SIGCHI Conference on Human Factors in Computing Systems (CHI ’95). ACM Press/Addison-Wesley Publishing Co., New York, NY, USA, 265–272. https://doi.org/10.1145/223904.223938
[55] Norbert A. Streitz, Jörg Gei, Torsten Holmer, Shin’ichi Konomi, Chris-tian Müller-Tomfelde, Wolfgang Reischl, Petra Rexroth, Peter Seitz, and Ralf Steinmetz. 1999. i-LAND: An Interactive Landscape for Cre-ativity and Innovation. InProceedings of the SIGCHI Conference on Human Factors in Computing Systems (CHI ’99). ACM, New York, NY, USA, 120–127. https://doi.org/10.1145/302979.303010
[56] Peter Tarasewich, Christopher S. Campbell, Tian Xia, and Myra Dide-les. 2003. Evaluation of Visual Notification Cues for Ubiquitous Computing. InUbiComp 2003: Ubiquitous Computing, Anind K. Dey, Albrecht Schmidt, and Joseph F. McCarthy (Eds.). Springer Berlin Heidelberg, Berlin, Heidelberg, 349–366. https://doi.org/10.1007/ 978-3-540-39653-6_27
[57] Matthias Trapp, Lars Schneider, Christine Lehmann, Norman Holz, and Jurgen Dollner. 2011. Strategies for Visualising 3D Points-of-interest on Mobile Devices.J. Locat. Based Serv.5, 2 (June 2011), 79–99. https://doi.org/10.1080/17489725.2011.579579
[58] Maarten van Dantzich, Daniel Robbins, Eric Horvitz, and Mary Cz-erwinski. 2002. Scope: Providing Awareness of Multiple Notifica-tions at a Glance. InProceedings of the Working Conference on Ad-vanced Visual Interfaces (AVI ’02). ACM, New York, NY, USA, 267–281. https://doi.org/10.1145/1556262.1556306
[59] Gina Venolia, Laura Dabbish, JJ Cadiz, and Anoop Gupta. 2001. Support-ing Email Workflow. Technical Report. 8 pages. https://www.microsoft. com/en-us/research/publication/supporting-email-workflow/ [60] John Vilk, David Molnar, Benjamin Livshits, Eyal Ofek, Chris Rossbach,
Alexander Moshchuk, Helen J. Wang, and Ran Gal. 2015. SurroundWeb: Mitigating Privacy Concerns in a 3D Web Browser. InProceedings of the 2015 IEEE Symposium on Security and Privacy (SP ’15). IEEE Computer Society, Washington, DC, USA, 431–446. https://doi.org/10.1109/SP. 2015.33
[61] Amanda Williams, Shelly Farnham, and Scott Counts. 2006. Explor-ing Wearable Ambient Displays for Social Awareness. InCHI ’06 Ex-tended Abstracts on Human Factors in Computing Systems (CHI EA ’06). ACM, New York, NY, USA, 1529–1534. https://doi.org/10.1145/ 1125451.1125731
[62] Andrew D. Wilson and Hrvoje Benko. 2016. Projected Augmented Reality with the RoomAlive Toolkit. InProceedings of the 2016 ACM International Conference on Interactive Surfaces and Spaces (ISS ’16). ACM, New York, NY, USA, 517–520. https://doi.org/10.1145/2992154. 2996362
[63] Robert Xiao, Miguel A. Nacenta, Regan L. Mandryk, Andy Cock-burn, and Carl Gutwin. 2011. Ubiquitous Cursor: A Comparison of Direct and Indirect Pointing Feedback in Multi-display Environ-ments. InProceedings of Graphics Interface 2011 (GI ’11). Canadian Human-Computer Communications Society, School of Computer Sci-ence, University of Waterloo, Waterloo, Ontario, Canada, 135–142. http://dl.acm.org/citation.cfm?id=1992917.1992939
[64] Polle T. Zellweger, Jock D. Mackinlay, Lance Good, Mark Stefik, and Patrick Baudisch. 2003. City Lights: Contextual Views in Minimal Space. InCHI ’03 Extended Abstracts on Human Factors in Computing Systems (CHI EA ’03). ACM, New York, NY, USA, 838–839. https: //doi.org/10.1145/765891.766022