warwick.ac.uk/lib-publications
Manuscript version: Author’s Accepted Manuscript
The version presented in WRAP is the author’s accepted manuscript and may differ from the
published version or Version of Record.
Persistent WRAP URL:
http://wrap.warwick.ac.uk/106499
How to cite:
Please refer to published version for the most recent bibliographic citation information.
If a published version is known of, the repository item page linked to above, will contain
details on accessing it.
Copyright and reuse:
The Warwick Research Archive Portal (WRAP) makes this work by researchers of the
University of Warwick available open access under the following conditions.
Copyright © and all moral rights to the version of the paper presented here belong to the
individual author(s) and/or other copyright owners. To the extent reasonable and
practicable the material made available in WRAP has been checked for eligibility before
being made available.
Copies of full items can be used for personal research or study, educational, or not-for-profit
purposes without prior permission or charge. Provided that the authors, title and full
bibliographic details are credited, a hyperlink and/or URL is given for the original metadata
page and the content is not changed in any way.
Publisher’s statement:
Please refer to the repository item page, publisher’s statement section, for further
information.
Constraining the presence of giant planets in two-belt
debris disk systems with VLT/SPHERE direct imaging
and dynamical arguments
Elisabeth Matthews
1
?
, Sasha Hinkley
1
, Arthur Vigan
2
, Grant Kennedy
3
,
Ben Sutlieff
1
, Dawn Wickenden
1
, Sam Treves
1
, Trevor David
4
, Tiffany Meshkat
5
,
4
,
Dimitri Mawet
4
,
6
, Farisa Morales
4
, Andrew Shannon
7
,
8
, Karl Stapelfeldt
4
1University of Exeter, Physics Department, Stocker Road, Exeter, EX4 4QL, UK
2Aix Marseille Universit´e, CNRS, LAM (Laboratoire d’Astrophysique de Marseille) UMR 7326, 13388 Marseille, France 3Department of Physics, University of Warwick, Gibbet Hill Road, Coventry CV4 7AL, UK
4Jet Propulsion Laboratory, California Institute of Technology, 4800 Oak Grove Drive, Pasadena, CA 91109, USA 5IPAC, Caltech, M/C 100-22, 1200 East California Boulevard, Pasadena, CA 91125, USA
6Department of Astronomy, California Institute of Technology, 1200 E. California Boulevard, MC 249-17, Pasadena, CA 91125, USA 7Department of Astronomy and Astrophysics, 525 Davey Laboratory, Pennsylvania State University, University Park, PA 16802, USA 8Center for Exoplanets and Habitable Worlds, The Pennsylvania State University, State College, PA 16802, USA
ABSTRACT
Giant, wide-separation planets often lie in the gap between multiple, distinct rings of circumstellar debris: this is the case for the HR 8799 and HD 95086 systems, and even the solar system where the Asteroid and Kuiper belts enclose the four gas and ice giants. In the case that a debris disk, inferred from an infrared excess in the SED, is best modelled as two distinct temperatures, we infer the presence of two spatially separated rings of debris. Giant planets may well exist between these two belts of debris, and indeed could be responsible for the formation of the gap between these belts. We observe 24 such two-belt systems using the VLT/SPHERE high contrast imager, and interpret our results under the assumption that the gap is indeed formed by one or more giant planets. A theoretical minimum mass for each planet can then be calculated, based on the predicted dynamical timescales to clear debris. The typical dynamical lower limit is ∼0.2MJ in this work, and in some cases exceeds 1MJ. Direct imaging data, meanwhile, is typically sensitive to planets down to ∼3.6MJ at 1”, and 1.7MJ in the best case. Together, these two limits tightly constrain the possible planetary systems present around each target, many of which will be detectable with the next generation of high-contrast imagers.
Key words: stars: planetary systems – planet-disc interactions – circumstellar matter
1 INTRODUCTION
Directly imaged planets are rare. This has been demon-strated by numerous surveys over the last decade: NaCo (Chauvin et al. 2015), the Lyot project (Leconte et al. 2010), GDPS (Lafreni`ere et al. 2007), IDPS (Galicher et al. 2016), SEEDS (Brandt et al. 2014), NICI (Biller et al. 2013;
Nielsen et al. 2013; Wahhaj et al. 2013) and others. In a meta-analysis of several deep imaging surveys,Bowler(2016) found an overall occurrence rate of0.6+−00..75% for companions in the range 5-13MJ and 30-300 AU.Galicher et al.(2016), meanwhile, use a slightly wider parameter space of 0.5-14MJ and 20-300 AU, and find an occurrence rate of1.05+−21..8070%.
? E-mail: [email protected]
Directly imaged planets are rare in the modest region of parameter space that can be probed, i.e. the most massive planets at the widest of separations.
The latest generation of direct imagers (notably SPHERE and GPI, see Beuzit et al. 2008; Macintosh et al. 2014, respectively) are sensitive to lower masses of wide-separation planets that were previously inaccessi-ble to direct imaging. These instruments are proving to have excellent high contrast abilities, and the GPIES and SPHERE/SHINE surveys are initially consistent with the low occurrence rates for wide-separation planets within the region where direct imaging is sensitive, i.e. massive plan-ets in the Jupiter-mass regime, separated by tens of AU from their host stars. Only a few planets have been iden-tified with these instruments so far: the GPIES team de-tected a planet around the β-Pictoris member 51 Eridani
(Macintosh et al. 2015;De Rosa et al. 2015), while a planet around the Sco-Cen star HIP 65426 has been detected by the SPHERE/SHINE team (Chauvin et al. 2017). An exo-planet PDS 70b was very recently identified with SPHERE, in a gap within the transitional disk of this object (Keppler et al. 2018).
In contrast to this relatively small number of planet detections, great success has been had with both SPHERE and GPI in detecting and characterizing debris dust sys-tems in scattered light (e.g.Currie et al. 2015;Kasper et al. 2015; Draper et al. 2016;Wahhaj et al. 2016; Feldt et al. 2017; Bonnefoy et al. 2017; Matthews et al. 2017). These systems are of particular interest since the presence of dust in a system may correlate with the presence of planets. Dust is transient, being blown out of systems by stellar winds or falling onto the stellar surface via the Poynting-Robertson effect. Therefore, if dust is observed to be present it must be constantly regenerated via planetesimal collisions. Planetesi-mals are the building blocks of planets, and so their presence is a useful indicator that planets may also have been able to form in a certain system. Even further, the presence of one or more giant planets in a system may perturb the orbits of these planetesimals, further increasing the rate of dust pro-duction (Mustill & Wyatt 2009). Those systems that host massive, wide-orbit planets might therefore also show evi-dence for particularly high quantities of dust.
Many of the known directly imaged planets reside in highly dusty systems. For example, the massive debris disk around β-Pictoris was first imaged by Smith & Terrile
(1984), and a massive planet was subsequently detected by
Lagrange et al.(2009). It is worth noting however that this correlation does not itself imply an underlying link between debris disks and planetary systems, since many directly im-aged planets have been discovered in surveys deliberately targeting a biased selection of highly dusty disks. Nonethe-less,Meshkat et al.(2017) found that there is a statistically significant excess (at the 88% confidence level) of planets around highly dusty stars, compared to the occurence rates in a control sample, for early type stars.
These dusty systems also allow the study of the dy-namical interactions of dust and planets. A sharp disk edge or a gap between two belts of debris dust can be formed by the gravitational influence of a giant planet. This has been observed in the HR 8799 system (Marois et al. 2008,
2010) which hosts four known planets, with radii between 14 AU and 68 AU, and two distinct debris belts at ∼9 AU and beyond ∼95 AU (Reidemeister et al. 2009; Su et al. 2009;Matthews et al. 2014). HD 95086 shows similar sys-tem architecture, with two distinct debris belts (Su et al. 2015) and one known planet (Rameau et al. 2013) lying be-tween them. Su et al.(2015) present possible architectures for this system with up to four planets clearing the gap be-tween these debris belts, the inner three being below current detection limits. Even our own solar system is in this config-uration, with the Asteroid and Kuiper belts enclosing four large, wide-separation gas and ice giants.
Systems in this two-belt configuration can be detected by observations of an infrared excess: if this infrared excess is best modelled as two distinct temperatures, as is the case for both HR 8799 and HD 95086, we infer that there are two temperatures of dust and therefore probably rings of dust at two radii (see e.g.Kennedy & Wyatt 2014). These two-belt
systems are unique in that there is spatial information sug-gestingwhere in the system planets are likely to be found. By assuming that the debris gap is formed by the gravita-tional clearing of one or more giant planets, we conclude that the planets in these systems should lie between the inner and outer debris belt radii, as inferred from infrared SED fitting. Under the assumption that planets are equal mass and typ-ically separated by∼20 mutual Hill radii, it is even possible to deduce the predicted location of each individual planet in a multi-planet system, based on the number of planets we expect. The mutual Hill radius is defined as
RH=
a1+a2
2 ×
m1+m2
3M? 13
(1)
for planets with massesm1andm2, and semi-major axesa1 and a2. For transiting planets observed with Kepler, Fang
& Margot (2013) found a typical planet-planet separation of 21.7±9.5RH. While there is no guarantee that massive, wide-separation planets will behave as close-in planets do, we note that a significantly closer spacing is likely unsta-ble. The HR 8799 planets are separated by as little as 3-4 mutual Hill radii, but the system is only stable due to the special dynamical configuration of the planets with several mean motion resonances (Fabrycky & Murray-Clay 2010;
Go´zdziewski & Migaszewski 2014).
As well as using disk structure to predict the locations of planets, it is possible to use dynamical arguments to con-strain exoplanet masses. By assuming several equal mass planets spread across a debris gap,Shannon et al. (2016) found that the clearing time scales with the planet mass and the width of the debris gap. For a system with widely spaced debris belts and giant planets, this timescale is of order millions of years, and as such is similar to the life-time of the system. By imposing that the clearing life-time be less than the stellar age, it is possible to calculate the mini-mum mass of each planet in the system that would facilitate clearing of the observed debris gap. This constraint can be combined with upper mass limits based on direct imaging analysis, so as to place tight limits on the possible planetary configurations in these multi-belt systems.
In this work, we survey 24 systems with previously pub-lished evidence for debris disks segregated into two distinct belts. We search for evidence for the planets that might be responsible for sculpting these debris disks, and test how tightly the undetected planetary systems can be constrained. Section2describes our target selection, and our observations and data reduction are discussed in sections3and4 respec-tively. The contrast limits and candidate companion identi-fication are given in section5, and we discuss our results in section6.
2 TARGET SELECTION
Morales et al. (2011), Ballering et al. (2013), Kennedy & Wyatt (2014) and Morales et al. (2016), and so we search for any disagreement between these literature sources. In Table 1 we list the literature references for each target, and specify which works find each target as having either one or two temperatures. We flag all those targets where there is disagreement in the literature as less certain. We then visually inspect the SEDs of targets for which there is only one literature source, and additionally flag the targets HD 120326 and HD 143675 as less certain. In both of these cases, no infrared excess is detected beyond the wavelength of theSpitzer InfraRed Spectrograph (5.2-38µm), and so it is hard to robustly infer a two-temperature disk. Our final target list includes 14 targets that host two-temperature de-bris disks, and 10 targets that likely host two-temperature debris disks, where this debris structure is less certain. All of the targets we observe are presented as having two temper-atures inChen et al.(2014), and so for consistency we use the temperature fits of that work in our subsequent analysis, with further details given in Section5.2.
The final target list consists of 24 stars with some ev-idence for the presence of two belts. As part of the selec-tion criteria, we included only stars with high parallaxes and young ages, since these targets allow the detection of planets at the closest physical separations to their host star, and at the lowest masses. The nearest OB2 association, Scorpius-Centaurus (de Zeeuw et al. 1999, hereafter Sco-Cen) is a particularly promising region for these studies since it is close (∼140pc) and young (∼10-16Myr, Pecaut & Mamajek 2016). A significant fraction (58%) of our targets are selected from this region. All of our targets have indicators of youth, mostly based on their association memberships, as detailed in Section5.4. Target properties are listed in Table1.
3 OBSERVATIONS
Each of the targets was observed with the SPHERE planet-finding instrument on the VLT (Beuzit et al. 2008). Data were collected in the dual imaging IRDIFS mode, which splits the light into two subsystems: a differential imager and spectrograph (IRDIS; Dohlen et al. 2008), and an integral field spectrometer (IFS;Claudi et al. 2008). For this work we used IRDIS in dual-band imaging mode (DBI;Vigan et al. 2010) with the H23 filter pair (λ= 1588.8 nm,∆λ= 53.1 nm andλ= 1667.1 nm,∆λ= 55.6 nm), and the IFS was used in the YJ mode, which spans the range 0.95-1.35µm and has 39 distinct wavelength channels (Zurlo et al. 2014; Mesa et al. 2015). Plate scales are 12.255 mas/pix for IRDIS and 7.46 mas/pix for the IFS (Maire et al. 2016), and we use the N_ALC_YJH_S coronagraphic mask, which has an inner working angle of∼0.1500.
Each target was initially observed for a total integration time of ∼2000s, split into individual exposures between 2s and 64s. The individual exposure times were tailored based on the brightness and zenith distance of the target stars. The observations were carried out in pupil-stabilized mode to al-low angular differential imaging (ADI;Marois et al. 2006) to be performed. We also collected flux calibration frames, with the coronagraph removed, and star position calibration frames (waffle frames), where a sinusoidal pattern is applied to the deformable mirror to create four starspot images, one
in each corner of the image. These allow the stellar posi-tion to be accurately measured behind the occulting mask. Flux and center calibrations were collected for each target, immediately before or after the main science observations.
For a subset of our target stars, follow-up observations were collected. These allow differentiation between back-ground stars and co-moving companions based on whether the candidate shows common proper motion with the host. Follow-up observations generally had shorter exposure times, tailored to the specific candidates we were aiming to re-detect. Details of all observations (both initial and follow-up) used in this work are given in Table3.
4 DATA REDUCTION
4.1 Pre-processing
4.1.1 IRDIS
Pre-processing of the SPHERE/IRDIS data was performed using the CPL (Common Pipeline Library) provided by ESO. Master dark and flat frames were created, and the star position behind the coronagraph was calibrated using the center calibration frames. Each data frame was indepen-dently reduced by applying the master dark and flat frames, and then realigned taking into account the star center posi-tion calibraposi-tion and the dither posiposi-tion for each frame.
4.1.2 IFS
Integral Field Spectrograph (IFS) data reduction was per-formed followingVigan et al.(2015). Basic calibrations were first created using the ESO data reduction and handling pipeline (DRH, Pavlov et al. 2008): master dark and flat fields, IFS spectral position calibrations, initial wavelength calibrations and an IFU flat-field were all created. We then used a custom pipeline to calculate accurate time and paral-lactic angles for each image, and to normalise the data based on the direct integration time and neutral density filters for each observation. The pipeline also performs bad pixel cor-rection and cross-talk corcor-rection, and the DRH is then used to interpolate these frames spectrally and spatially. To com-plete the initial cleaning and calibration of the frames, we finally perform a sigma-clipping routine to remove remaining bad pixels, and a correction of the wavelength calibration. Full details of these cleaning and calibration steps are given inVigan et al.(2015).
4.2 Principal Component Analysis
After the initial cleaning and calibration of the data, we use Principal Component Analysis (PCA, see e.g.Soummer et al. 2012;Amara & Quanz 2012, our own implementation) to remove stellar speckle noise. The same process is car-ried out on both the IRDIS and the IFS data. We perform a full-frame PCA, taking into account each timestep (typically
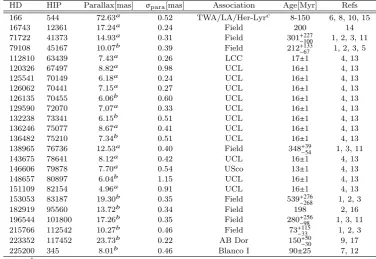
Table 1.Target stars. Distances are fromGaia (Gaia Collaboration et al. 2016a,b) where available, and Hipparcos (Perryman et al. 1997) otherwise. USco, UCL, LCC indicate the Upper Scorpius, Upper Centaurus-Lupus, and Lower Centaurus-Crux regions of Sco-Cen respectively, while LA is the local association. Age determination is discussed in Section5.4.
HD HIP Parallax[mas] σpara[mas] Association Age[Myr] Refs
166 544 72.63a 0.52 TWA/LA/Her-Lyrc 8-150 6, 8, 10, 15
16743 12361 17.24a 0.24 Field 200 14
71722 41373 14.93a 0.31 Field 301+227
−100 1, 2, 3, 11
79108 45167 10.07b 0.39 Field 212+133
−67 1, 2, 3, 5
112810 63439 7.43a 0.26 LCC 17±1 4, 13
120326 67497 8.82a 0.98 UCL 16±1 4, 13
125541 70149 6.18a 0.24 UCL 16±1 4, 13
126062 70441 7.15a 0.27 UCL 16±1 4, 13
126135 70455 6.06b 0.60 UCL 16±1 4, 13
129590 72070 7.07a 0.33 UCL 16±1 4, 13
132238 73341 6.15b 0.51 UCL 16±1 4, 13
136246 75077 8.67a 0.41 UCL 16±1 4, 13
136482 75210 7.34b 0.51 UCL 16±1 4, 13
138965 76736 12.53a 0.40 Field 348+−3954 1, 3, 11
143675 78641 8.12a 0.42 UCL 16±1 4, 13
146606 79878 7.70a 0.54 USco 13±1 4, 13
148657 80897 6.04b 1.15 UCL 16±1 4, 13
151109 82154 4.96a 0.91 UCL 16±1 4, 13
153053 83187 19.30b 0.35 Field 539+276
−268 1, 2, 3
182919 95560 13.72b 0.34 Field 198 2, 16
196544 101800 17.26b 0.35 Field 280+256
−98 1, 3, 11
215766 112542 10.27b 0.46 Field 73+115
−33 1, 2, 3
223352 117452 23.73b 0.22 AB Dor 150+−5030 9, 17
225200 345 8.01b 0.46 Blanco I 90±25 7, 12
Note.a Gaiadistance,b Hipparcos distance,c There is conflicting literature for this target, discussed in Section5.4.
References.(1)Brandt & Huang(2015); (2)Chen et al.(2014); (3)David & Hillenbrand(2015); (4)de Zeeuw et al.(1999); (5)Gerbaldi et al.(1999); (6)L´opez-Santiago et al.(2006); (7)Lynga & Wramdemark(1984); (8)Maldonado et al.(2010); (9)Mamajek(2016); (10)
Nakajima & Morino(2012); (11)Nielsen et al.(2013); (12)Panagi & O’dell(1997); (13)Pecaut et al.(2012); (14)Rhee et al.(2007); (15)Tetzlaff et al.(2011); (16)Zorec & Royer(2012a); (17)Zuckerman et al.(2011).
on the similarities between each individual image: speck-les appear at the same location in each scaled image, while on-sky signals (planets, debris disks or background stars) appear at different positions with time since the field is ro-tating, and with wavelength due to the image scaling. The PCA processed images are then rescaled back to their orig-inal plate scales, and the parallactic angle for each image is used to align the North axis of each time step. The individ-ual images are finally co-added to give a single, broadband reduced image for each target. Following the same process but co-adding by time only, we also create a cube of reduced images at each individual wavelength. This allows a compar-ison of H2 and H3 magnitudes in the case of IRDIS data, and spectral extraction across the YJ bands in the case of IFS data.
The aggressiveness of the PCA algorithm is tuneable: removing more principal components before co-adding the images removes more of the scattered starlight, but also re-duces the throughput of the planetary signal. We aim to achieve the optimum balance between removing starlight and preserving companion signal, so as to detect the faintest possible planets and place the most stringent contrast lim-its. To do this, we perform several PCA reductions with the same code, where we remove between 1 principal component and approximately one-third of the total available principal components, at which point a planetary signal is almost en-tirely removed. Each of these different reductions is used in our subsequent analysis when identifying candidate compan-ions and calculating contrast curves.
4.3 Candidate Companion Identification & Verification
Candidate companions were identified by visual inspection of both the IRDIS and the IFS data, and each target was visually inspected by at least two individuals to confirm that no candidates were missed. This process is repeated at several PCA reduction strengths, as described above. Since SPHERE data are very high quality and most of the can-didates are in the wide field where the data is read-noise limited, we include all visually identified candidates in our analysis rather than applying a sigma cut-off. Candidates within a 2” square, centred on the host star, are shown in Figure1.
IRDIS observations are used to calculate astrometry of each candidate companion relative to its host star. To do this, the pixel position of each candidate and the stel-lar position behind the occulting mask are measured, and we assume an error of 0.2 pixels in the determination of each. Following the ESO User Manual1, we use a plate scale of 12.255±0.021mas/pix and a true north correc-tion of -1.700±0.076◦ for data before December 2015, and -1.75±0.08◦ for data after February 2016. The additional pupil IFS offset (135.99±0.11◦) is also applied, as well as an additional ‘epsilon’ correction, due to a missynchroni-sation problem at the telescope (see the User Manual for
1 6th & 7th release, see https://www.eso.org/sci/facilities/paranal/
1"
HD 120326 HD 126135 HD 136482
HD 138965 HD 148657 HD 151109
[image:6.595.68.513.101.547.2]HD 153053 HD 182919
Figure 1.PCA reduced images for a selection of targets from the survey. All survey targets with companions closer than 2” are shown. Each image is 4” square, and candidates within this field of view are highlighted with arrows. The HD 126135 candidate is a likely speckle, as detailed in Section5.5. The arcsecond scale bar applies to all images, the colorbar is identical for each thumbnail, and North is oriented upwards in each case.
details). For our data, we find that this correction is consis-tently smaller than 0.1◦. We also correct for the anamorphic distortion of the chip before performing astrometry. The ep-silon and anamorphic distortion corrections are applied to each individual frame, before the images are combined. The measured separation and position angle of each candidate are listed in Table4.
We use several methods to distinguish between genuine companions and background objects: we refer to previous literature, use common proper motion testing where there are multiple epochs of SPHERE data, and study the H2-H3 colors for candidates with an absolute magnitude fainter than 15 in the H2 filter. A negative H2-H3 color indicated the presence of methane, which we expect for sufficiently low mass companions but not for distant background stars. For
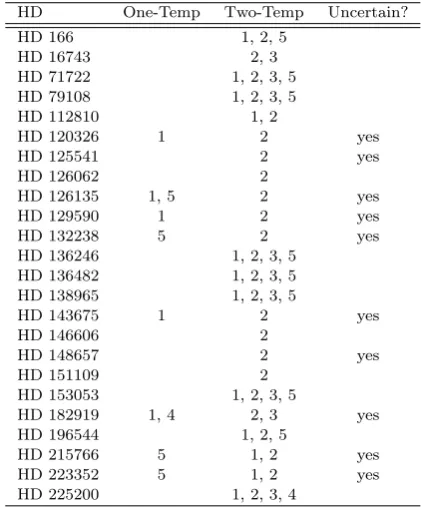
Table 2.Literature SED fits of each target as either one or two temperature disks. SinceMorales et al.(2011) andMorales et al.
(2016) use similar methodology we do not count these as indepen-dent, but useMorales et al.(2016) where available andMorales et al.(2011) otherwise. Note also thatKennedy & Wyatt(2014) do not present any one-temperature SED fits. In the final column, we list the targets for which we consider the two-belt nature to be more uncertain.
HD One-Temp Two-Temp Uncertain?
HD 166 1, 2, 5
HD 16743 2, 3
HD 71722 1, 2, 3, 5
HD 79108 1, 2, 3, 5
HD 112810 1, 2
HD 120326 1 2 yes
HD 125541 2 yes
HD 126062 2
HD 126135 1, 5 2 yes
HD 129590 1 2 yes
HD 132238 5 2 yes
HD 136246 1, 2, 3, 5
HD 136482 1, 2, 3, 5
HD 138965 1, 2, 3, 5
HD 143675 1 2 yes
HD 146606 2
HD 148657 2 yes
HD 151109 2
HD 153053 1, 2, 3, 5
HD 182919 1, 4 2, 3 yes
HD 196544 1, 2, 5
HD 215766 5 1, 2 yes
HD 223352 5 1, 2 yes
HD 225200 1, 2, 3, 4
References.(1)Ballering et al.(2013); (2)Chen et al.(2014); (3)
Kennedy & Wyatt(2014); (4)Morales et al.(2011); (5)Morales et al.(2016).
For the 13 candidate companions that have been previ-ously determined to be background objects, we plot relative astrometry against the published astrometry in Figure2. We consistently see close agreement with the predicted positions for candidates inNielsen et al.(2013), and in each case con-firm their conclusion that these are background objects. For the candidate around HD 125541 that was previously pub-lished in Janson et al. (2013), we note a systematic offset of∼80mas in the candidate astrometry between their work and our measurements. It is not immediately clear what the cause of this difference is, but since the candidate is rel-atively bright (∆H2=8.6mag) we suggest that it is a non-infinite background object with non-zero proper motion. The 7 candidate companions to HD 120326 were previously de-tected inBonnefoy et al. (2017), but due to the short time baseline between their observations and ours we do not at-tempt to create CPM plots for this target. Two candidate companions to HD 223352 have been previously detected in several works (De Rosa et al. 2011;Rameau et al. 2013;
Galicher et al. 2016), and confirmed to be co-moving. These companions are discussed in more detail in Section5.5.
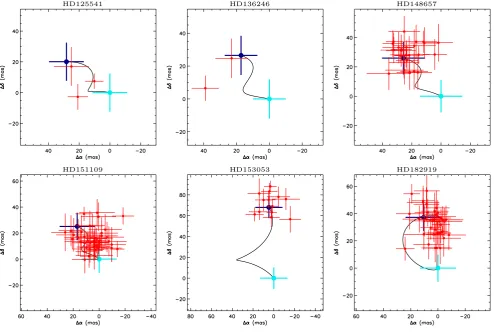
For 6 targets, we have multiple epochs of SPHERE data. In these cases we create multi-candidate common proper mo-tion plots (see Figure3), where the motion of each candidate relative to its host is presented simultaneously. A reference track, demonstrating the predicted motion of an infinitely distant background star relative to the primary is also
plot-ted. HD 148657 and HD 153053 demonstrate the expected outcome for a target with a large number of candidate com-panions: the final positions of the various candidates (in red) are clustered around the predicted final position (dark blue), with some statistical spread. In these cases it is clear that each of the plotted companions shows a good match to the background hypothesis. In the case of HD 151109, how-ever, the measured final positions of candidates are clustered around a point in between the initial (light blue) and pre-dicted final (dark blue) positions. This is indicative of some systematic error: either (a) the host star position is incor-rectly calibrated behind the coronagraphic mask, (b) there is a slight error in calibration of the telescope angle or (c) the proper motion and parallax of this object in theGaia cat-alog (Gaia Collaboration et al. 2016a,b) are not accurate. This systematic uncertainty can be probed by considering the candidates simultaneously, sinceallthe candidates show this shift from the expected final position, and it is clear that not all the candidates are genuine companions. We sug-gest instead that any candidates with significantly outlying proper motion relative to the other candidates should be considered as co-moving companions, rather than any can-didates which show a small proper motion between the two epochs. For HD 151109, therefore, all the candidates appear to be background objects. For a subset of targets with faint enough MH2 for the H2-H3 colors to differentiate between companions and background objects, we find H2-H3 colors close to zero, further supporting this conclusion. In cases like this the entire set of candidates reveals additional in-formation about systematics: although an individual CPM diagram might suggest a co-moving companion, comparing the entire set of candidate in this way allows more accurate conclusion to be drawn about the true nature of candidates.
4.4 Contrast Limits
For each of the targets, contrast limits are calculated via in-jection of fake candidates. Several scaled images of the PSF calibration frame are inserted into the raw data at a variety of offsets and position angles, and the full reduction process repeated. A total of 20 scaled PSF images are inserted into each IFS frame, and 60 into each IRDIS frame. In each case, the minimum separation between fake planets is 100mas, to avoid contamination between the separate injections. The injections are repeated at five different position angles, and at several different magnitudes. The contrast quoted in this work is the mean 5σ detection across the five fake planet candidates at each separation. To account for the small num-ber of resolution elements at small inner working angles, the correction term presented inMawet et al.(2014) is applied. By using this method we ensure the planetary throughput of the algorithm is accurately captured.
This process is performed for each of our PCA reduc-tions with different numbers of PCA components removed, and the contrast quoted is that of the most favorable re-duction. By testing the contrast at a variety of reduction strengths, we ensure that we remove the optimum number of PCA modes to balance removing sufficient starlight, while minimizing the extent to which the planetary signal is self-subtracted for each individual dataset.
us-Table 3.SPHERE observations of target stars. The rotation column indicates the total rotation of the field, between the first and the last images. Note that the listed exposure times refer to each individual science image in the observation sequence.
IRDIS IFS
Target UT Date Nimages Exp. Time[s] Rot[deg] Nimages Exp Time[s] Rot[deg]
HD 166 2015 Jul 19 768 2 11.2 180 4 8.9
HD 16743 2016 Sep 19 64 32 17.8 63 32 17.8
HD 71722 2015 Apr 25 192 8 15.1 82 16 13.1
HD 79108 2015 Apr 09 240 8 19.2 94 16 18.5
HD 112810 2016 May 02 80 32 21.8 40 64 22.9
HD 120326 2016 Jun 04 80 32 21.6 40 64 22.6
HD 125541 2015 Apr 16 64 32 29.9 62 32 29.7
2016 Jun 04 16 32 6.9 8 64 6.7
HD 126062 2016 Jul 23 80 32 23.9 40 64 25.2
HD 126135 2016 Apr 07 512 4 34.0 448 4 35.2
2018 Mar 17 64 32 24.8 32 64 26.5
HD 129590 2016 May 04 80 32 35.1 40 64 36.9
HD 132238 2016 Apr 07 128 16 29.1 124 16 29.3
2018 Mar 17 64 8 7.6 17 32 8.1
HD 136246 2015 Apr 14 192 8 88.3 228 8 97.8
2016 Apr 03 256 4 25.7 228 4 26.8
HD 136482 2015 Apr 15 96 16 35.1 67 16 24.9
HD 138965 2015 Apr 15 240 8 12.2 31 32 6.2
HD 143675 2015 Jul 11 96 16 36.8 91 16 35.6
HD 146606 2016 Jul 02 304 8 15.8 150 16 17.7
HD 148657 2015 Apr 20 96 16 34.5 89 16 33.3
2016 Jun 05 16 32 8.6 8 64 8.4
HD 151109 2015 Apr 15 96 16 31.9 91 16 30.8
2016 Jun 04 16 32 8.0 8 64 7.9
HD 153053 2015 Apr 23 96 16 13.6 45 32 13.0
2016 Apr 09 64 32 15.4 64 32 15.7
HD 182919 2016 Apr 14 128 16 12.1 64 32 12.2
2017 Jul 15 48 32 8.3 24 64 8.9
HD 196544 2015 May 29 48 32 11.0 69 8 13.7
HD 215766 2015 Jun 20 192 8 28.1 228 8 38.0
HD 223352 2015 Jul 16 320 4 65.1 196 8 82.9
[image:8.595.98.493.130.476.2]HD 225200 2015 Jul 18 64 24 31.3 60 32 35.3
Table 4.Candidate companion astrometry and magnitudes for the survey. A total of 178 candidates were detected, of which 157 are background (BG) and a further 18 are likely background objects (?BG) based on their separation from the host star and color analysis. 2 objects are previously detected companions (C) and one object is a likely speckle (S?). Further detail on candidate designation is given in Section4.3.Only a portion of the table is shown here - the entirety will be included in the online journal as supplementary material.
Star Epoch Date No. ∆H (mag) Sep(”) σsep PA σPA Reference Status
HD 71722 2015-04-25 1 11.4 2818.2 6.0 260.37 0.15 N13 BG
HD 71722 2015-04-25 2 11.2 5915.2 10.8 3.47 0.14 N13 BG
HD 79108 2015-04-09 1 13.3 5248.5 9.7 89.50 0.14 – ?BG
HD 122810 2016-05-02 1 14.6 3512.9 7.0 262.04 0.15 – ?BG
HD 122810 2016-05-02 2 7.8 5682.9 10.4 311.36 0.14 – ?BG
HD 122810 2016-05-02 3 11.3 5788.2 10.6 357.93 0.14 – ?BG
HD 122810 2016-05-02 4 13.8 5859.7 10.7 126.75 0.14 – ?BG
HD 122810 2016-05-02 5 – 6188.0 11.2 284.11 0.14 – ?BG
Note.TF = candidate too faint to be redetected, OS = candidate off-screen in this epoch.
References.(B17)Bonnefoy et al.(2017); (dR11)De Rosa et al.(2011); (G16)Galicher et al.(2016); (J13)Janson et al.(2013); (N13)
Nielsen et al.(2013); (R13)Rameau et al.(2013).
ing the COND models (Baraffe et al. 2003) for temperatures below 1700K and DUSTY models (Chabrier et al. 2000) oth-erwise (as in e.g.Janson et al. 2013). For simplicity, we use only the SPHERE/IRDIS data in calculating these mass lim-its. The majority of conversions use the COND models, due to the high sensitivity of the SPHERE instrument.
5 RESULTS
5.1 Achieved contrast
[image:8.595.97.491.534.631.2]HD71722 # 1 HD71722 # 2 HD125541 # 1 HD136482 # 1
HD136482 # 2 HD136482 # 3 HD136482 # 4 HD136482 # 5
HD138965 # 2 HD138965 # 3 HD138965 # 4 HD196544 # 1
[image:9.595.49.544.104.600.2]HD196544 # 2 HD223352 # 1 HD223352 # 2
Figure 2.Astrometry for all candidates with archival data. Archival data are taken fromNielsen et al.(2013);Janson et al. (2013);
Rameau et al.(2013);Galicher et al.(2016). Darker points are measured, and lighter points show the predicted position for a background object at each epoch, with the black lines showing the path a stationary background object would take. In several cases there is imperfect agreement with the background hypothesis, possibly due to non-zero motion of the background objects. Although we see a systematic offset betweenJanson et al.(2013) and our astrometry for HD 125541, discussed further in Section4.3, we agree with their conclusion that this is a background object. For HD 223352, we only plot a subset of archival astrometry for clarity, and the two candidates are previously confirmed companions, as discussed in Section5.5and Table6.
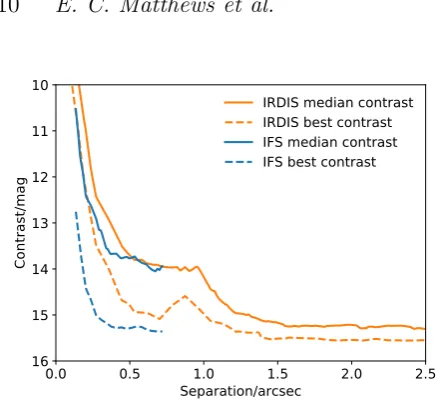
are presented in AppendixB. We are able to reach contrasts of∼15 magnitudes at 0.500in the most favorable systems.
5.2 Disk Radii
HD125541 HD136246 HD148657
[image:10.595.43.538.106.438.2]HD151109 HD153053 HD182919
Figure 3.Multi-candidate common proper motion plots for targets where we have multiple epochs of SPHERE data. The predicted background motion for a candidate in each case follows the black line from the light to the dark blue point, and the measured final positions of each candidate are plotted in red relative to the light blue point. The complete astrometry is included in Table 4 and individual common proper motion plots for each candidate are included in AppendixA.
10
12
14
16
Contrast/mag
0
2
4
6
8
10
12
14
Number of Targets
0.25"
10
12
14
16
Contrast/mag
0.5"
10
12
14
16
Contrast/mag
1.0"
IRDIS
IFS
Figure 4.Histograms of our survey contrast, at a separation of 0.25”, 0.5” and 1.0”. Orange and blue lines represent the IRDIS and IFS data respectively.
target SEDs can be modelled almost as well with a single temperature excess as with two temperatures. For the pur-poses of this paper, we proceed under the assumption that these two-temperature systems host two debris belts and dis-cuss the planetary configurations for this case. If these are in fact single debris belt systems, there are clearly a range of
additional planetary configurations which are not considered in this work.
For consistency, we use the temperature values found in
[image:10.595.84.506.514.647.2]0.0
0.5
1.0
1.5
2.0
2.5
Separation/arcsec
10
11
12
13
14
15
16
Contrast/mag
IRDIS median contrast
IRDIS best contrast
IFS median contrast
IFS best contrast
Figure 5.Median and best contrasts achieved by our survey, for both the IFS and IRDIS subsystems. Only the initial observation (durations∼1h) of each target is included in this plot.
5.3 Resolved Disk Radii
For six of the targets in this survey, resolved disk images exist, and these targets are listed in Table 5. This allows some verification of the calculated radii. Four of the targets have been resolved withHerschel (seeMorales et al. 2016), and in two of these cases, namely HD 71722 and HD 138965, we see close agreement with the calculated values. For the other two targets, there is a factor∼2 difference between the measured and calculated radii, which changes our calculated lower mass limits (see below) by a factor∼2.8.
Two of the targets, namely HD 120326 and HD 129590, are resolved with VLT/SPHERE at∼1.6µm. For HD 129590, the resolved radius shows very close agreement with the cal-culated radius for the inner dust belt. Given thatMatthews et al. (2017) found a very soft external power law for the dust ring, we suggest that the resolved disk corresponds to the inner dust belt, and that the soft power law is caused by an additional, fainter ring of dust at wider separation. For HD 120326,Bonnefoy et al.(2017) found evidence for both dust belts in scattered light, and both radii are listed below. The outer radius matches closely with the calculated value, and the inner radius is within a factor of 2. We note at this point that the calculated lower mass limits (see Section 6) depend only on the radius of the outer disk, although the position of the inner disk determines the number of planets at this mass that are required to fill the gap.
5.4 Age Determination
Where available, we use cluster membership to determine the ages of each target. 14 of the 24 targets are members of the Scorpius-Centaurus association, as determined byde Zeeuw et al. (1999), and we use the Pecaut et al. (2012) ages for each Sco-Cen subgroup. There is some disagreement about the membership of HD 166: it is listed as a member of either Hercules-Lyra (150-300Myr;L´opez-Santiago et al. 2006), the Local Association (20-150Myr;Maldonado et al. 2010) or the TW Hydrae association (8Myr; Nakajima & Morino 2012).Tetzlaff et al. (2011) also find a very young
age of 20.1±6.4Myr for this target using pre-main sequence evolutionary models. We choose to assign this target a range of ages, namely 8-150Myr, to reflect this range of literature ages, and in subsequent calculations represent this range as an age of 79±71Myr. HD 223352 is a member of the AB Dor moving group (Zuckerman et al. 2011), which has an age of 150+−50
30Myr (Mamajek 2016). HD 225200 is a member of Blanco I (Lynga & Wramdemark 1984), which has an age of 90±25Myr (Panagi & O’dell 1997).
The remaining targets are field stars, and so ages are harder to determine accurately. Each is nonetheless likely to be young, given the presence of high volumes of circumstel-lar dust. For these targets we use previously performed age determinations. HD 71722, HD 79108 and HD 196544 all show close agreement between several literature sources (see Table1), and in these cases we use the Bayesian ages from
David & Hillenbrand(2015, here on DH15). For HD 138965 and HD 215766, there is some slight discrepancy between DH15 andBrandt & Huang (2015), with the best fit ages varying by a factor of∼3. For consistency, we use the DH15 ages here too, but note that there is more uncertainty. For HD 153053, the DH15 Bayesian age appears discrepantly lower than both the DH15 interpolated age and the ages pre-sented byBrandt & Huang(2015) andChen et al.(2014), and so we use the Brandt age. Finally, there is limited lit-erature for both HD 16743 and HD 182919 and so we use
Rhee et al.(2007) and Zorec & Royer(2012b) respectively, but note that these age designations are more uncertain. In these two cases, no uncertainties are quoted with the litera-ture ages.
5.5 Candidate Companions to Individual Targets
HD 166:This target was previously studied byLafreni`ere et al.(2007) as part of the GDPS, and no candidates were identified. Even with our improved contrast limits, we do not find any candidates around HD 166.
HD 16743:No candidates are identified around HD 16743. HD 71722:Both the candidates presented inNielsen et al.
(2013) as background stars are redetected in this work, and our astrometry is consistent with that ofNielsen et al.(2013) for the background hypothesis. No further candidates are identified.
HD 79108:For this target, we identify a single candidate at a separation of 5.25” andMH2=14.5. This is too bright for H2-H3 color analysis to be conclusive, but the physical pro-jected separation of 521 AU strongly suggests a background object.
HD 112810: Five widely separated candidates are identi-fied (>3.5”). All are likely background objects based on their separation. Additionally, the disk was detected in scattered light for the first time (Matthews et al., in prep).
HD 120326: A debris disk was imaged around this tar-get inBonnefoy et al.(2017). We redetect this debris disk, and detect seven of the ten candidate companions found in that work. An eigth candidate appears on the very edge of the detector where astrometric measurements are no longer reliable, and we choose to ignore this candidate. The final two candidates listed inBonnefoy et al.(2017) are off the edge of our detector, due to the camera rotation. Our data were collected two months after those in Bonnefoy et al.
[image:11.595.44.263.80.282.2]Table 5.Measured and calculated radii for disks where at least one belt of debris has been resolved. The upper group of targets have been resolved with theHerschelspace telescope, and for these we list only the calculated outer radius, which corresponds well for two targets and is a factor of 2 off for two targets. The lower group have been resolved with VLT/SPHERE. In this case we list both calculated radii: for HD 129590 the resolved disk is likely the inner band of dust, while for HD 120326 both bands of dust are tentatively detected inBonnefoy et al.(2017), with the outer closely matching the calculated value. Note that only the outer disk radius is used in the calculation of a lower mass limit.
Target λ Resolved Radius / AU Calculated Radius / AU Reference
HD 166 70µm 29±3 76+−1210 Morales et al. 2016
100µm 36±3 Morales et al. 2016
HD 71722 100µm 139±27 128+20
−16 Morales et al. 2016
HD 138965 100µm 187±6 191+−3830 Morales et al. 2016
HD 153053 100µm 186±12 306+81
−68 Morales et al. 2016
HD 120326 1.6µm 58.6±3, 130±8 33.0−+22..84,134+−2419 Bonnefoy et al. 2017
HD 129590 1.6µm 59.3±0.2 60.2+1.3
−1.3,103+ 451
−3 Matthews et al. 2017
would move 11.2mas relative to the host star. Although this number is larger than the nominal SPHERE astrometric ac-curacy of 5mas, it is too small to allow us to clearly differ-entiate the companion and background hypotheses, and we do not create common proper motion plots for this target.
Bonnefoy et al.(2017) conclude that all of these candidates are background objects based on their colors, and on pre-vious detections of several of the candidates in HST/STIS data (Padgett & Stapelfeldt 2016).
HD 125541:This candidate was observed twice, with four candidates detected in the first epoch, and three of these redetected in the second epoch. Candidate #1 was previ-ously detected inJanson et al.(2013) and confirmed to be a background object. We detect significantly less than the ex-pected proper motion between our two observational epochs. Given the systematic differences with Janson et al.(2013) and the relative brightness of the candidate, this is likely a nearby background object, with non-zero proper motion. Candidates #2 and #4 both show significant motion be-tween our two observational epochs, suggesting that they are background objects. Candidate #3 is only detected in one epoch, at MH2=16.1. At this very faint magnitude, an H2-H3 color of 0.08 and a separation of 4.86”=786 AU imply that this is a background object.
HD 126062: Three faint, wide separation candidates are identified around this target. With only one epoch of data, we are unable to use proper motion to confirm whether the candidates are genuine companions or background objects. Based on the wide separation, faint absolute magnitude and low H2-H3 color of each candidate, all three are assumed to be background objects.
HD 126135:In a first epoch of data, we find a bright candi-date very close to the coronagraph edge (separation 137mas, see Figure 1). At this close separation it is hard to distin-guish companions and speckle noise, but the candidate is resilient to the number of principal components subtracted, and appears to have self-subtraction wings. The candidate appears in the IRDIS but not the IFS data, suggesting that it is either an extremely red object or a speckle.
In a second epoch of data the candidate is not recovered. Although it is possible that this is a genuine low-mass com-panion, it is most likely a particularly persistent speckle,
and further follow-up is required to confirm the nature of this object.
HD 129590: The debris disk around this target was de-tected in scattered light for the first time (see Matthews et al. 2017). In addition, one candidate was identified at 5.67”, corresponding to a physical projected separation of 752 AU. At this wide separation, the candidate has a low probability of being associated with the host star. The can-didate is positioned North of the debris disk, which has a position angle of 122◦ and an inclination of 75◦ (Matthews et al. 2017). A bound candidate in this position would either be significantly further than this 752 AU separation, or sig-nificantly misaligned with the disk, further supporting our assumption that this is a background star and not a bound companion.
HD 132238:A single candidate is observed at a separation of 4.29”. The candidate has MH2=15.3 and H2-H3=0.05, and shows good agreement with the predicted motion of a background object between two epochs, and so we conclude that it is a background object.
HD 136246:Two candidates are identified, and both are redetected in a second epoch of data. Although the astro-metric measurement of candidate #1 is displaced from the predicted position in epoch 2, the candidate moves signif-icantly from the initial position. Since a companion would show almost no motion relative to the host in this period, this is likely a background star with non-zero proper motion. As such, we conclude that both candidates are background stars.
HD 136482: Six candidates are identified around HD 136482. Five of these have been previously identified by
Nielsen et al.(2013), and an additional candidate at 5.95” is found below the contrast limit in that work. Based on the projected separation and H2-H3 color of this candidate, it is a background object. We do not detect the 6th candidate listed inNielsen et al.(2013) since it is outside the SPHERE field of view.
HD 138965:Four candidates are detected, three of which are also listed in N13 as background objects. Our candidate #1 is below the detection limit of N13, withMH2=15.2. For this candidate H2-H3=0.05, and so the candidate is a likely background object.
Since all are faint (contrast 11.2 mag or higher) and at wide separation (>3.89”=468 AU), each candidate has a low like-lihood of being bound, and so we did not collect follow-up data for this candidate. Candidates #1, #2 and #3 are all fainter than 15th magnitude in H2 and have H2-H3 colors of 0.21, -0.11 and 0.34, and so we conclude all three are background objects. Candidate #4 is too bright for H2-H3 color to differentiate between a background and a compan-ion, but at a projected separation of 5.39”= 664 AU this object is highly likely to be a background star.
HD 146606: A single, faint candidate is identified at a separation of 4.7”, and at this wide separation is a likely background object.
HD 148657: This target is just 6.8◦ from the galactic plane, and so there is a rich field of background objects. We identify a total of 29 candidates in our first epoch of data, 26 of which are redetected in a second epoch and con-firmed to be background objects based on CPM and color analysis. The remaining three candidates are too faint to be identified in the second epoch. These three candidates are at relatively wide projected separations (161, 547 and 799 AU), and based on their faint H2 magnitudes and small H2-H3 colors, we conclude that all three are background objects.
HD 151109: We detect a total of 49 candidates around HD 151109, which is 4◦from the galactic plane. 44 of these are redetected in a follow-up observation, and the remain-ing 5 are too faint to be detected in the second epoch. As discussed in Section4.3above, the candidates we detect are systematically shifted by a smaller distance than would be expected based on the proper motion of this target. Based on the systematically similar motion of the set of candidates we conclude they are all likely background stars. The sub-set of candidates faint enough that H2-H3 color can be used to differentiate companions and background objects all have colors close to zero, confirming this assumption. The 5 can-didates detected only in the first epoch are also highly likely to be background objects, based on their wide separation, faint absolute magnitude and small H2-H3 colors.
HD 153053: For this target, 14 candidates are identified and 13 of these are redetected in a second epoch of data and confirmed to be background objects. The final candidate, at a separation of 5.60”, is outside the field of view in the second epoch of data, due to the orientation of the ccamera. Based on the wide separation of this candidate, it is a likely background object.
HD 182919:A total of 40 candidates are detected around this target, which is 1.7◦from the galactic plane. In a second epoch of data, we redetect 38 of these 40 candidates. As can be seen in Figure 3, there is some scatter in final position relative to the predicted final positions for each candidate. We nonetheless conclude based on the proper motion, ab-solute magnitude, color and separation of each candidate that these are all background objects. The two candidates that appear only in the first epoch are also assumed to be background objects, based on their wide separation, faint absolute magnitude and small H2-H3 colors.
HD 196544: The two background objects identified in
Nielsen et al.(2013) are redetected, and no new candidates are found.
HD 215766: No candidates are detected around this tar-get.
HD 223352: This target was first identified as a tertiary
system inDe Rosa et al.(2011), and redetected byRameau et al.(2013) andGalicher et al.(2016). We detect the com-panions HIP 117452Ba and HIP 117452Bb as listed in De Rosa et al.(2011), but do not find any evidence for addi-tional companions orbiting the primary, even with our im-proved contrast limits. Orbital motion of the binary pair relative to each other and to the primary is clearly detected relative to previous publications, and preliminary orbit fit-ting is now possible. This is beyond the scope of the current work, but we collate all published astrometry for the triple system in Table6.Zuckerman et al.(2011) list HD 223352 as a triple system, with a close binary and a tertiary object, HD 223340, an early-K-type at a separation of∼75”. In this work and the other works referenced in Table6, we resolve the binary ofZuckerman et al.(2011) asthreedistinct stars, meaning this system is in fact aquadruple system with an A0 primary, orbited by a close binary pair at∼3.5” and ad-ditionally by a K-type star at∼75”.
The binary pair is significantly more widely spaced than the debris gap: at ∼3.5”, it has a projected separation of 147 AU. We would therefore still expect a close-in planetary system between the two debris belts (at 4.6 AU and 41 AU) to be responsible for the dust clearing.
HD 225200:No candidates are detected around this tar-get.
6 ANALYSIS
The mass/radius parameter space for planets orbiting these 24 systems discussed in this work can now be tightly con-strained by combining our VLT/SPHERE observations with dynamical arguments. Is is therefore possible to make infer-ences about the putative planetary systems hiding within the debris gaps.
Mass limits are calculated using the SPHERE/IRDIS contrast limits as described in Section4.4: the COND models (Baraffe et al. 2003) are used for temperatures below 1700K and the DUSTY models (Chabrier et al. 2000) otherwise. These mass limits are shown in Figures6and7. For these mass limits, the confidence interval is calculated based solely on the age of the system. As discussed above in Section5.4, for two targets (HD 16743 and HD 182929) we were only able to find literature ages without uncertainties quoted, and as such are also unable to calculate uncertainties in our mass limits. For the 14 Sco-Cen targets in our sample, the ages are well determined (Pecaut et al. 2012) and so our uncertainties in mass limit are small.
Also plotted in Figures6and7are the minimum masses of planets required to clear the inferred debris gaps, based on the N-body simulations ofShannon et al.(2016). The quoted mass is the minimum massper planet, with uncertainties cal-culated based on the age of the system and the uncertainty in the disk radius. In all cases except for HD 129590, we infer that the system must be in a multi-planet configura-tion: the theoretical mass for a single planet to clear the gap is large (&50MJ in each case, Quillen 2006; Morrison
& Malhotra 2015).Quillen(2006) found this clearing mass to be consistent for eccentricities.0.3.Nesvold & Kuchner
Table 6.Astrometry for the two close companions of HD223352. The third companion, an early-K star at∼75”, (Zuckerman et al. 2011) is outside the field of view.
Date Sep (”) σsep PA σPA Reference
HD223352Ba
2008-10-12 3.66 0.04 237.3 – Galicher et al. 2016
2009-08-30 3.7 0.1 237.3 0.4 De Rosa et al. 2011
2009-12-31 3.67 0.04 237.3 – Galicher et al. 2016
2012-12-07 3.667 0.009 237.8 0.8 Rameau et al. 2013
2015-07-18 3.7141 0.0073 238.06 0.14 This work
HD223352Bb
2008-10-12 3.50 0.04 238.6 – Galicher et al. 2016
2009-08-30 3.5 0.1 238.5 0.5 De Rosa et al. 2011
2009-12-31 3.48 0.04 239.0 – Galicher et al. 2016
2012-12-07 3.402 0.009 238.6 0.98 Rameau et al. 2013
2015-07-18 3.3738 0.0068 239.13 0.15 This work
[image:15.595.49.534.327.682.2]The minimum mass calculation relies on the assumption that planets are spaced by∼20 mutual Hill radii. To demon-strate the impact of this choice of spacing, we additionally plot the lower mass limits for a spacing of 16RH, as given inShannon et al.(2016). The number of Hill radii between each planet has a relatively small effect on the dynamical constraints. For a planet spacing>20RH, the predicted mass for each planet is higher than in the 20RH case, and so the lower limits that we plot remain valid.
In a small number of cases, the planet masses inferred from Shannon et al. (2016) are sufficiently high that the value of RH approaches a significant fraction of the star-planet spacing. In this case, for star-planets to be spaced byK RH, the second planet will be at semi-major axisa2=a1+K RH. Substituting for equation1, the semi-major axis is given by
a2 1−
K
2
m1+m2
3M? 13!
=a1 1+
K
2
m1+m2
3M? 13!
, (2)
which only gives a positive value for the semi-major axis when
m1+m2 <
24M?
K3 . (3)
At this point, the very definition of mutual Hill radii means that for a specified planet mass, there is a certain maximum value of K, the number of RH between each planet. Alter-natively, for a given K, there is a maximum mass of planets that fulfils equation3. For a solar mass star, and equal mass planets with K=20, this condition is reached at a planet mass of 1.43MJ.
For a small number of the targets in this work, the masses inferred from Shannon et al. (2016) are sufficiently high that this limit is reached, and equal-mass planets can-not be separated by 20 mutual Hill radii. For these targets, we instead calculate the lower limits for a spacing of 16RH. These are highlighted in blue in Figure7. When the number (K) of Hill radii between each target is changed, the clearing time appears to scale as K3, so we tentatively also calculate a clearing time limit for a 12RH spacing as 0.42×the limit for 16RH. This is an unusually close inter-planet spacing, and for all of the targets in our survey a value of K=12 predicts a clearing mass that satisfies equation3, and so a spacing of 12RH is reasonable.
We separate the targets for which there is doubt about the two-belt nature of the debris, and plot these in Figure
7. Our analysis is only valid if these are genuine two-belt systems.
By combining the observational upper and theoretical lower mass constraints in this way, only a small region of parameter space is left unconstrained. In some cases the re-gion between the upper and lower mass constraints is less than an order of magnitude, with lower mass limits exceed-ing 1MJ for systems with the widest debris disks and at the youngest ages. For all targets except HD 129590, we infer a multi-planet system based on the large theoretical clearing masses. In such a multi-planet system, the widest separation planet will have a physical separation close to that of the outer debris belt, where our direct imaging limits are relatively tight. Geometrical arguments mean that the planet will only appear at such a wide projected separation in a subset of cases, but this outermost planet is nonetheless
constrained to a relatively small mass range, especially for targets where ALMA orHerscheldata constrains the system inclination.
In our survey of 24 targets, no exoplanetary mass com-panions were detected. For context, Meshkat et al.(2017) found occurrence rates of 6.27% (68% confidence interval 3.68-9.76%) in a debris disk sample of planets between 5-20MJ and 10-1000 AU. Although our sample is too small for a detailed statistical analysis to be instructive, a non-detection in a sample of 24 stars is not inconsistent with the debris disk occurrence rate found in that work, since one would expect some companions might be geometrically unfavorably aligned, or below our detection limits. Our non-detections are also consistent with the lower occurence rate of ∼1% found in unbiased samples by both Bowler (2016) andGalicher et al.(2016). The results of this survey are not incompatible with the theory that planets are carving wide debris gaps, since in each case our direct imaging upper mass limits are higher than the theoretical lower mass limits that we calculate. However, in several cases there is only a small mass range remaining where the planets could be massive enough to clear the observed gap, and yet sufficiently small and faint to remain undetected.
It is possible that the inferred gaps in these systems are not in fact caused by the presence of planets. An alternative cause of such a two-belt debris structure is that the belts form at the positions of molecular snow lines (see e.g. Bal-lering et al. 2017;Matr`a et al. 2018), with the inner belt po-sitioned at a water snow line and the outer belt at a CO snow line. The correlation found inKennedy & Wyatt(2014) be-tween the outer disk temperature and the stellar luminosity suggests that the dust location does not consistently match with a condensation temperature. However, in an optically thick disk the snow line positions would be determined by the mid plane temperature and so this correlation does not exclude the possibility of a more complex relationship be-tween condensation positions and the formation of two-belt debris disks, and more work is needed to understand this possibility. It is also possible that the two temperatures in these debris disks do not correspond to two distinct radii of debris, as addressed in detail inKennedy & Wyatt(2014). However, the existence of the HR 8799 and HD 95086 sys-tems where planets are known to reside in two-temperature debris disks and the solar system where planets are known to reside between two belts of debris implies that planets are a valid explanation for the formation of this debris structure in at least a subset of cases.
The very youngest systems are the most effective targets for a study like this one: in these cases the parameter space can be most tightly constrained. The ratio between the up-per and lower limits for the younger, more distant Sco-Cen stars in this survey is much smaller than that for the older, closer targets. For these younger, more distant targets, ex-oplanets are more luminous (see e.g. Chabrier et al. 2000;
Baraffe et al. 2003), although at these further distances the same absolute magnitude corresponds to a fainter apparent magnitude. Crucially, though, the lower limits inferred from
7 CONCLUSIONS
In this work, we have imaged 24 debris disk hosting stars us-ing the VLT/SPHERE instrument in IRDIFS mode. These targets were specifically selected as those that are likely to host multiple, segregated debris belts enclosing a debris gap. It is inferred that a system of one or more planets is respon-sible for the clearing of this wide debris gaps, as is the case for the solar system and for exoplanet hosts HR 8799 and HD 95086. We identify a total of 178 candidates. Two of these have been previously identified as companions, and the remainder are found to be background or likely back-ground objects based on previous literature, common proper motion analysis, and the magnitude, color and separation of each candidate. Our survey reaches a typical contrast of ∼13mag at 0.25” and ∼15mag at 1.0”. These contrasts are converted to mass limits for each target. We addition-ally calculate theminimum required mass for planets in the system to have cleared the observed debris gap. Combin-ing our upper and lower mass limits, we are able to tightly constrain the unexplored parameter space around these sys-tems: typically, planets must be at least∼0.2MJto clear the observed gap based on dynamical arguments, and in some cases the dynamical limit exceeds 1MJ. Direct imaging data from VLT/SPHERE, meanwhile, is sensitive to planets of
∼3.6MJ for a typical target in our survey, and 1.7MJ in the best case. Several of the inferred planetary systems will likely be detectable with the next generation of high contrast im-agers.
ACKNOWLEDGEMENTS
EM thanks the University of Exeter for support through a Ph.D. studentship. GMK is supported by the Royal Society as a Royal Society University Research Fellow. AS is par-tially supported by funding from the Center for Exoplanets and Habitable Worlds. The Center for Exoplanets and Hab-itable Worlds is supported by the Pennsylvania State Uni-versity, the Eberly College of Science, and the Pennsylvania Space Grant Consortium.
This work is based on observations made with ESO Telescopes at the La Silla Paranal Observatory under pro-gramme IDs 095.C-0549, 095.C-0838, 0949, 097.C-1019, 099.C-0734. This work has made use of data from the European Space Agency (ESA) mission Gaia (http: //www.cosmos.esa.int/gaia), processed by theGaiaData Processing and Analysis Consortium (DPAC,http://www. cosmos.esa.int/web/gaia/dpac/consortium). Funding for the DPAC has been provided by national institutions, in particular the institutions participating in the Gaia Multi-lateral Agreement. This research has made use of the SIM-BAD database, operated at CDS, Strasbourg, France.
REFERENCES
Amara A., Quanz S. P., 2012, MNRAS, 427, 948
Ballering N. P., Rieke G. H., Su K. Y. L., Montiel E., 2013, ApJ, 775, 55
Ballering N. P., Rieke G. H., Su K. Y. L., G´asp´ar A., 2017,ApJ,
845, 120
Baraffe I., Chabrier G., Barman T. S., Allard F., Hauschildt P. H., 2003, A&A, 402, 701
Beuzit J.-L., et al., 2008, SPIE, 7014, 701418 Biller B. A., et al., 2013, ApJ, 777, 160 Bonnefoy M., et al., 2017, A&A, 597, L7 Bowler B. P., 2016, PASP, 128, 102001 Brandt T. D., Huang C. X., 2015, ApJ, 807, 58 Brandt T. D., et al., 2014, ApJ, 794, 159
Chabrier G., Baraffe I., Allard F., Hauschildt P., 2000, ApJ, 542, 464
Chauvin G., et al., 2015, A&A, 573, A127 Chauvin G., et al., 2017, A&A, 605, L9
Chen C. H., Mittal T., Kuchner M., Forrest W. J., Lisse C. M., Manoj P., Sargent B. A., Watson D. M., 2014, ApJS, 211, 25 Claudi R. U., et al., 2008, SPIE, 7014, 70143
Currie T., Lisse C. M., Kuchner M., Madhusudhan N., Kenyon S. J., Thalmann C., Carson J., Debes J., 2015, ApJ, 807, L7 David T. J., Hillenbrand L. A., 2015, ApJ, 804, 146
De Rosa R. J., et al., 2011, MNRAS, 415, 854 De Rosa R. J., et al., 2015, ApJ, 814, L3 Dohlen K., et al., 2008, SPIE, 7014, 70143 Draper Z. H., et al., 2016, ApJ, 826, 147
Fabrycky D. C., Murray-Clay R. A., 2010, ApJ, 710, 1408 Fang J., Margot J.-L., 2013, ApJ, 767, 115
Feldt M., et al., 2017, A&A, 601, A7
Gaia Collaboration et al., 2016a, A&A, 595, A1 Gaia Collaboration et al., 2016b, A&A, 595, A2 Galicher R., et al., 2016, A&A, 594, A63
Gerbaldi M., Faraggiana R., Burnage R., Delmas F., G´omez A. E., Grenier S., 1999, A&AS, 137, 273
Go´zdziewski K., Migaszewski C., 2014, MNRAS, 440, 3140 Janson M., et al., 2013, ApJ, 773, 73
Kasper M., Apai D., Wagner K., Robberto M., 2015, ApJ, 812, L33
Kennedy G. M., Wyatt M. C., 2014, MNRAS, 444, 3164 Keppler M., et al., 2018, preprint, (arXiv:1806.11568) Lafreni`ere D., et al., 2007, ApJ, 670, 1367
Lagrange A.-M., et al., 2009, A&A, 493, L21 Leconte J., et al., 2010, ApJ, 716, 1551
L´opez-Santiago J., Montes D., Crespo-Chac´on I., Fern´ andez-Figueroa M. J., 2006, ApJ, 643, 1160
Lynga G., Wramdemark S., 1984, A&A, 132, 58 Macintosh B., et al., 2014, PNAS, 111, 12661 Macintosh B., et al., 2015, Science, 350, 64 Maire A.-L., et al., 2016, SPIE, 9908, 990834
Maldonado J., Mart´ınez-Arn´aiz R. M., Eiroa C., Montes D., Mon-tesinos B., 2010, A&A, 521, A12
Mamajek E. E., 2016, IAU Proc., 314, 21
Marois C., Lafreni`ere D., Doyon R., Macintosh B., Nadeau D., 2006, ApJ, 641, 556
Marois C., Macintosh B., Barman T., Zuckerman B., Song I., Patience J., Lafreni`ere D., Doyon R., 2008, Science, 322, 1348 Marois C., Zuckerman B., Konopacky Q. M., Macintosh B.,
Bar-man T., 2010, Nature, 468, 1080
Matr`a L., Marino S., Kennedy G. M., Wyatt M. C., ¨Oberg K. I., Wilner D. J., 2018,ApJ,859, 72
Matthews B., Kennedy G., Sibthorpe B., Booth M., Wyatt M., Broekhoven-Fiene H., Macintosh B., Marois C., 2014, ApJ, 780, 97
Matthews E., et al., 2017, ApJ, 843, L12 Mawet D., et al., 2014, ApJ, 792, 97 Mesa D., et al., 2015, A&A, 576, A121 Meshkat T., et al., 2017, AJ, 154, 245
Morales F. Y., Rieke G. H., Werner M. W., Bryden G., Stapelfeldt K. R., Su K. Y. L., 2011, ApJ, 730, L29
Morales F. Y., Bryden G., Werner M. W., Stapelfeldt K. R., 2016, ApJ, 831, 97
Mustill A. J., Wyatt M. C., 2009, MNRAS, 399, 1403 Nakajima T., Morino J.-I., 2012, AJ, 143, 2
Nesvold E. R., Kuchner M. J., 2015, ApJ, 798, 83 Nielsen E. L., et al., 2013, ApJ, 776, 4
Padgett D., Stapelfeldt K., 2016, IAU Proc., 314, 175 Panagi P. M., O’dell M. A., 1997, A&AS, 121
Pavlov A., M¨oller-Nilsson O., Feldt M., Henning T., Beuzit J.-L., Mouillet D., 2008, SPIE, 7019, 701939
Pawellek N., Krivov A. V., 2015, MNRAS, 454, 3207 Pecaut M. J., Mamajek E. E., 2016, MNRAS, 461, 794 Pecaut M. J., Mamajek E. E., Bubar E. J., 2012, ApJ, 746, 154 Perryman M. A. C., et al., 1997, A&A, 323
Quillen A. C., 2006, MNRAS, 372, L14 Rameau J., et al., 2013, ApJ, 779, L26
Reidemeister M., Krivov A. V., Schmidt T. O. B., Fiedler S., M¨uller S., L¨ohne T., Neuh¨auser R., 2009, A&A, 503, 247 Rhee J. H., Song I., Zuckerman B., McElwain M., 2007, ApJ, 660,
1556
Shannon A., Bonsor A., Kral Q., Matthews E., 2016, MNRAS, 462, L116
Smith B. A., Terrile R. J., 1984, Science, 226, 1421 Soummer R., Pueyo L., Larkin J., 2012, ApJ, 755, L28 Su K. Y. L., et al., 2009, ApJ, 705, 314
Su K. Y. L., Morrison S., Malhotra R., Smith P. S., Balog Z., Rieke G. H., 2015, ApJ, 799, 146
Tetzlaff N., Neuh¨auser R., Hohle M. M., 2011, MNRAS, 410, 190 Vigan A., Moutou C., Langlois M., Allard F., Boccaletti A.,
Car-billet M., Mouillet D., Smith I., 2010, MNRAS, 407, 71 Vigan A., Gry C., Salter G., Mesa D., Homeier D., Moutou C.,
Allard F., 2015, MNRAS, 454, 129 Wahhaj Z., et al., 2013, ApJ, 773, 179 Wahhaj Z., et al., 2016, A&A, 596, L4 Zorec J., Royer F., 2012a, A&A, 537, A120 Zorec J., Royer F., 2012b, A&A, 537, A120
Zuckerman B., Rhee J. H., Song I., Bessell M. S., 2011, ApJ, 732, 61
Zurlo A., et al., 2014, A&A, 572, A85
HD71722 # 1 HD71722 # 2 HD125541 # 1
HD125541 # 2 HD125541 # 4 HD132238 # 1 HD136246 # 1
HD136246 # 2 HD136482 # 1 HD136482 # 2 HD136482 # 3
HD136482 # 4 HD136482 # 5 HD138965 # 2 HD138965 # 3
APPENDIX A: COMMON PROPER MOTION PLOTS
HD138965 # 4 HD148657 # 2 HD148657 # 3 HD148657 # 4
HD148657 # 5 HD148657 # 6 HD148657 # 7 HD148657 # 8
HD148657 # 10 HD148657 # 11 HD148657 # 12 HD148657 # 13
HD148657 # 14 HD148657 # 15 HD148657 # 16 HD148657 # 17
HD148657 # 23 HD148657 # 24 HD148657 # 25 HD148657 # 26
HD148657 # 27 HD148657 # 28 HD148657 # 29 HD151109 # 1
HD151109 # 2 HD151109 # 4 HD151109 # 5 HD151109 # 6
HD151109 # 7 HD151109 # 8 HD151109 # 10 HD151109 # 11
HD151109 # 16 HD151109 # 17 HD151109 # 18 HD151109 # 20
HD151109 # 21 HD151109 # 22 HD151109 # 23 HD151109 # 25
HD151109 # 26 HD151109 # 27 HD151109 # 28 HD151109 # 29
HD151109 # 30 HD151109 # 31 HD151109 # 32 HD151109 # 33
HD151109 # 38 HD151109 # 39 HD151109 # 40 HD151109 # 41
HD151109 # 42 HD151109 # 43 HD151109 # 44 HD151109 # 45
HD151109 # 46 HD151109 # 48 HD151109 # 49 HD153053 # 1
HD153053 # 2 HD153053 # 3 HD153053 # 4 HD153053 # 5
HD153053 # 10 HD153053 # 11 HD153053 # 12 HD153053 # 14
HD182919 # 1 HD182919 # 2 HD182919 # 3 HD182919 # 4
HD182919 # 5 HD182919 # 6 HD182919 # 7 HD182919 # 9
HD182919 # 10 HD182919 # 11 HD182919 # 12 HD182919 # 13
HD182919 # 18 HD182919 # 19 HD182919 # 20 HD182919 # 21
HD182919 # 22 HD182919 # 23 HD182919 # 24 HD182919 # 25
HD182919 # 26 HD182919 # 27 HD182919 # 28 HD182919 # 29
HD182919 # 30 HD182919 # 31 HD182919 # 32 HD182919 # 33
HD182919 # 39 HD182919 # 40 HD196544 # 1 HD196544 # 2