tion
Jamshed Anwar, Dirk Zahn
PII: S0169-409X(17)30198-9 DOI: doi:10.1016/j.addr.2017.09.017
Reference: ADR 13187
To appear in: Advanced Drug Delivery Reviews
Received date: 2 June 2017 Revised date: 27 August 2017 Accepted date: 7 September 2017
Please cite this article as: Jamshed Anwar, Dirk Zahn, Polymorphic Phase Transitions: Macroscopic Theory and Molecular Simulation, Advanced Drug Delivery Reviews (2017), doi:10.1016/j.addr.2017.09.017
ACCEPTED MANUSCRIPT
1
Polymorphic Phase Transitions: Macroscopic Theory and Molecular
Simulation
Jamshed Anwara,*, Dirk Zahnb,*
a
Chemical Theory and Computation, Department of Chemistry, Lancaster University, Lancaster
LA1 4YB, United Kingdom
b
Lehrstuhl für Theoretische Chemie / Computer-Chemie-Centrum,
Friedrich-Alexander-Universität Erlangen-Nürnberg, Nägelsbachstr. 25, 91052 Erlangen, Germany
ACCEPTED MANUSCRIPT
2
Abstract
Transformations in the solid state are of considerable interest, both for fundamental reasons and
because they underpin important technological applications. The interest spans a wide spectrum
of disciplines and application domains. For pharmaceuticals, a common issue is unexpected
polymorphic transformation of the drug or excipient during processing or on storage, which can
result in product failure. A more ambitious goal is that of exploiting the advantages of metastable
polymorphs (e.g. higher solubility and dissolution rate) while ensuring their stability with respect
to solid state transformation. To address these issues and to advance technology, there is an
urgent need for significant insights that can only come from a detailed molecular level
understanding of the involved processes. Whilst experimental approaches at best yield time- and
space-averaged structural information, molecular simulation offers unprecedented, time-resolved
molecular-level resolution of the processes taking place. This review aims to provide a
comprehensive and critical account of state-of-the-art methods for modelling polymorph stability
and transitions between solid phases. This is flanked by revisiting the associated macroscopic
theoretical framework for phase transitions, including their classification, proposed molecular
mechanisms, and kinetics. The simulation methods are presented in tutorial form, focusing on
their application to phase transition phenomena. We describe molecular simulation studies for
crystal structure prediction and polymorph screening, phase coexistence and phase diagrams,
simulations of crystal-crystal transitions of various types (displacive/martensitic, reconstructive
and diffusive), effects of defects, and phase stability and transitions at the nanoscale. Our
selection of literature is intended to illustrate significant insights, concepts and understanding, as
well as the current scope of using molecular simulations for understanding polymorphic
transitions in an accessible way, rather than claiming completeness. With exciting prospects in
both simulation methods development and enhancements in computer hardware, we are on the
verge of accessing an unprecedented capability for designing and developing dosage forms and
drug delivery systems in silico, including tackling challenges in polymorph control on a rational
ACCEPTED MANUSCRIPT
3
Contents
1. Introduction
2. Crystal polymorphism and phase stability
3. Polymorphic phase transitions
3.1 Classification
3.2 Molecular mechanisms
3.3 Kinetics
4. Molecular simulation of polymorphic phase transitions
4.1Molecular simulation methodology
4.2Simulating phase transitions
5 Molecular simulations of phase stability and transitions
5.1 Crystal structure prediction and polymorph screening
5.2 Coexistence and phase diagrams
5.3 Displacive/martensitic transformations
5.4 Reconstructive transformations
5.5 Diffusive transitions
5.6 Effects of defects
5.7 Phase stability and transitions at the nanoscale
5.8 Kinetics from simulations
6. Future perspective
ACCEPTED MANUSCRIPT
4
1
Introduction
Crystal to crystal phase transitions are of considerable scientific interest and industrial
importance. The interest spans numerous fields and application domains that include Earth
sciences [1,2], materials science [3-5], biomineralisation [6-8], explosives [9], and
pharmaceuticals [10,11]. For pharmaceuticals, drug substances and formulation excipients can
exist in different solid forms, with particular form(s) having advantages over others in terms of
efficacy, ease of manufacture, or stability on storage [12-17]. Such a selected form within a
formulation may transform to another on storage or during manufacture with potentially
disastrous consequences including loss of efficacy [15-17]. An infamous example is that of the
protease inhibitor Norvir® (retonovir) developed for the treatment of HIV-1, for which the
second, a previously unobserved polymorph precipitated in the soft gelatin capsule resulting in a
product recall [18]. Indeed, the issue is recognised by the major product licensing authorities,
whose guidelines recommend that the polymorphism of all new drug entities is thoroughly
investigated [19,20].
Phase transitions in crystals of drugs and excipients have been studied extensively [10,11], with
the focus being largely on causal factors, characterization of the phases, and to a lesser extent
kinetics. However, despite this interest, our understanding of the mechanisms by which such
transitions occur and the factors that govern the kinetics is still relatively rudimentary. In
particular, we do not have a handle on the molecular level processes occurring during the phase
transitions. Experimental approaches at best (e.g. X-ray or neutron diffraction) yield time and
space-averaged structural information, which for polymorphic forms implies primarily the
coordinates of the starting (parent) and the final (daughter) crystalline form. The molecular
processes occurring during nucleation or at the transition interface are generally inaccessible.
This lack of molecular level understanding is limiting the development of strategy and rational
approaches that could potentially lead to significant technological impact e.g. reliable
stabilization of metastable forms that offer benefits such as enhanced bioavailability or ease of
processing.
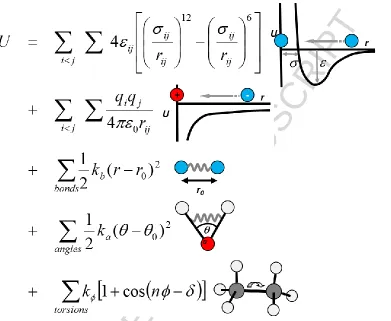
Computer simulation, more precisely, molecular simulation, offers the required molecular
resolution to make the critical molecular processes in phase transitions accessible [21-23]. The
ACCEPTED MANUSCRIPT
5
characterized. These forces enable the simulation of the molecular trajectories to yield
effectively a molecular-resolution microscope, albeit based on simulation. Molecular simulation
is now transforming our understanding of phase transition phenomena as we illustrate below.
The simulations promise molecular level insights that will rationalize experimental observations,
predict phase stability and transition kinetics, and enable the development of a robust theoretical
framework that could drive advances in pharmaceutical technology.
The review is concerned primarily with the understanding of polymorph phase stability and
phase transitions in the solid state. The emphasis is on molecular crystals, given that drug
molecules are mostly organic. We also, however, refer to simulations on ionic or inorganic
systems wherever they offer generic inferences and studies on molecular systems are lacking. In
particular, the interest lies in the molecular level processes that characterize how transitions are
initiated and propagate. We set out to develop a coherent understanding of polymorph phase
stability and phase transitions, including their classification, mechanisms, and kinetics. The
literature on phase transitions is vast, disparate, and continually expanding, and insights and
developments in one (sub)discipline rarely carry over into another. This is not surprising given
that phase transitions in solids are a ubiquitous phenomenon, exhibited by a spectrum of
materials. Here we identify and develop unifying concepts with a view to providing a better
understanding of the nature of phase transitions. The discussion is focused on first-order phase
transitions given their applicability to polymorphic phase transitions.
We should add that whilst we favour the term phase transition rather than phase transformation,
we believe the current consensus assumes the two terms to be synonymous and consequently we
employ as such. We do not review the literature in any comprehensive way, but rather use the
literature to discuss or highlight molecular insights, or illustrate a particular issue or behavior.
Notable reviews or monographs on phase transitions in solids include: the classic text of
Christian [24] though focused on metals and alloys; the more general monographs of Rao and
Rao [25], Toledano and Dmitriev [26], Mnyukh [27], and Fultz [5]; pharmaceutically-focused
review by Morris et. al. [10]; and reviews with an emphasis on transformation mechanisms by
Herbstein [28], James and Hane [29] on martensitic transformations, and that by Dove [30] on
displacive transitions in minerals. Particularly insightful are the review papers by Ubbelohde
ACCEPTED MANUSCRIPT
6
2
Crystal polymorphism and phase stability
Crystal polymorphism is defined as the ability of a substance, of a constant chemical
composition, to exist in more than one crystalline structure. In its broadest definition, the concept
includes all possible differences in the crystalline structure with the exception of homogeneous
deformation, but excludes solvates and amorphous modifications. Structurally, the different
modifications, or polymorphs, differ in the arrangement of the atoms or atomic groups in a space
lattice. These differences may be slight, involving only reorientation of identical atomic groups
on the same lattice, or total with little or no relationship between either the connectivity of
atomic groups (which may have entirely different coordination numbers) or the lattices.
Polymorphism is particularly abundant for molecular compounds which, in addition to
differences in the packing of the molecules, may also exhibit conformational differences that
include different resonance structures and rotation of moieties around a single bond [36].
Polymorphs of a given compound, whilst having identical chemical properties (though they may
differ in terms of solid state reactivity) can differ markedly in their physical properties.
Properties affected include solubility, melting point, hardness, density, chemical stability, crystal
morphology and various optical and electrical characteristics [12,13,15,37, and references in
therein]. [Polymorph energy levels of within a few tenths of kJ/mol are anything but rare. Very
abundant and very important, critical and relevant to pharma]
The phenomenon of polymorphism is ubiquitous [38] and its importance in pharmaceutical
development is well recognised. Use of an appropriate polymorph can enhance the rate and
extent of absorption of the drug into the bloodstream, improve the chemical or physical stability
of the product, or ease the necessary processing involved in the manufacture of the
pharmaceutical product [12,13,15, and references therein].
A significant proportion of problems of product instability occur as a result of polymorphic
phase transitions. On storage or processing, the selected polymorph transforms to a more stable
form. Examples of problems encountered include reduction in syringeability of injectable
products, caking of suspensions, grittiness in creams and ointments (which may cause these
products to be not only cosmetically unacceptable but also painful on application), crystal growth
ACCEPTED MANUSCRIPT
7
that their use in the summer becomes impractical [12,13,39,40]. The new phase may exhibit a
different solubility and hence dissolution kinetics, which in turn may adversely affect the
bioavailability. Clearly, to avoid such issues, the appropriate choice of polymorph would be that
which is thermodynamically stable under the conditions of storage experienced by the product.
However, this is at odds with the often-desired need to increase the solubility of the drug with a
view to enhancing its bioavailability, which can be met by a thermodynamically metastable
form. Moreover, the conflicting storage versus bioavailability issues may be complicated by
processing, for instance it has been demonstrated that the pressures normally employed in
tabletting can also induce phase transformations in drugs [41-43], as can milling [44].
Classical thermodynamics provides a general and sound basis for understanding structural phase
transformations, such as those exhibited by polymorphic forms. The Clausius-Clapeyron
equation, Gibbs phase rule [45] and the Gibbs free energy function G all satisfactorily predict the
important features exhibited by such transformations. In thermodynamics, a spontaneous
reaction is defined as one that has a natural tendency to proceed without the assistance of any
external potential, and is therefore feasible. Note, however, that nothing is implied in this
definition about the mechanism and any associated energy barriers, and thus the rate at which the
reaction proceeds. Spontaneous reactions are characterised by a negative change in the Gibbs
free energy function which is given by
S T V p U
G
(1)
where T is the absolute temperature, S is the entropy, U is the internal energy, p the pressure and
V volume.
It follows that under any given set of conditions of temperature and pressure, of the many
possible phases, only the one with the lowest value of G will be thermodynamically stable. All
other phases, under the same set of conditions, will be unstable and would tend to transform to
the stable phase.
The Gibbs free energy surface G(p,T), therefore, provides a convenient means for examining the
respective stability of different phases. Such a free energy profile but as a function only of
temperature (with pressure fixed at ambient) is shown for a hypothetical dimorphic system in
ACCEPTED MANUSCRIPT
8
phases are in equilibrium with each other and can co-exist. At these points G = 0 for a
transition between the phases. The conditions at the intersection points, that is, temperature and
pressure, are referred to as the transition conditions, since any departure from them results in one
of the phases becoming thermodynamically stable, provoking the transformation of the other
phases to this one. For the system in Figure 1 the transition temperature is TI-II. Below this
temperature, Form II has the lower free energy and is thus the stable phase. Above TI-II, Form I
becomes the thermodynamically stable phase.
In general, polymorphic transformations do not occur at exactly the transition conditions but
show hysteresis, that is, a difference in the transition temperature or pressure depending on
whether the transformation is in the forward or the reverse direction [46,32,47]. Hysteresis
results because of kinetic barriers to nucleation of the new phase [24,25]. At conditions close to
the transition point, the energy barriers to nucleation may be considerable. The rate of
transformation within the time period of the experiment is then too low as to be imperceptible to
measurement. It is only when the conditions depart further away from the transition point that the
transformation becomes sufficiently fast so as to be measurable. The extent of the transition
barrier varies from substance to substance depending on the changes involved in the crystal
structure on transformation. The extent of hysteresis in turn depends exponentially on the barrier
and the rate at which the thermodynamic conditions (temperature, pressure etc.) are changed
within a given experiment. For barriers less than kT (where k is the Boltzmann constant and T
ACCEPTED MANUSCRIPT
[image:10.612.72.428.74.541.2]9
Figure 1. Top: free-energy surface of a hypothetical enantiotropic dimorphic system as a
function of temperature. Bottom: Hysteresis of the I↔II transition when crossing the
transition temperature TI-II. The II-I and I-II transitions observed upon heating (red curve)
and cooling (blue) respectively, are subject to nucleation barriers and thus experience
kinetic trapping. Note that the centre of the hysteresis loop, commonly taken as the
experimental transition temperature, needs not to coincide with the thermodynamic
ACCEPTED MANUSCRIPT
10
Polymorphic transitions are often also observed to be irreversible [12,25]. Throughout the
conditions studied the transformation might be observed to proceed only in one direction. This
may be because the reverse rate is too slow, or because the G surfaces of the phases concerned
do not intersect and the one and same phase remains thermodynamically stable throughout right
up to its melting point. If the latter is the cause, then the transformation is referred to as
monotropic, in contrast to thermodynamically reversible transformations which are called
enantiotropic [48,49]. Monotropic transformations are not subject to a transition temperature, but
are controlled by kinetic factors. These transformations accordingly occur as a function of both
temperature and time.
Forms that are thermodynamically unstable but can be isolated are termed metastable.
Metastable forms once isolated can be quite stable; an extreme example being the diamond phase
of carbon, since the diamond→graphite transition occurs at a rate of practically zero. The degree
of metastability depends on the energy barriers to phase transition, which depend on the changes
involved in bonding to form a nucleus of the stable form within the parent lattice.
3
Polymorphic phase transformations
3.1 Classification
Classification schemes which have been found to be particularly useful are those proposed by
Ehrenfest [50], Buerger [51-53], and Ubbelohde [32,35]. Ehrenfest's classification is based on
the behaviour of thermodynamic quantities, such as entropy, volume and heat capacity, at the
transition point. The transitions are classed in terms of 'nth order' where n is an integer given by
the lowest derivative of Gibbs free energy G with respect to temperature T and pressure p, which
shows a discontinuous change at the transition. Thus, a first order transition is defined as one in
which a discontinuity occurs in the first derivative of the free energy. These derivatives
correspond to entropy S (or latent heat of transition) and volume V respectively, viz.
G T p G T p
Gmin I , , II , (2)
point transition at
0
ACCEPTED MANUSCRIPT
11 0 ; T H S T G T G S S T G p p II II I pI (3)
T II II I T I p G V V p G
(4)
Second order transitions do not involve entropy or volume changes, but are characterised by
discontinuities in the second derivatives of free energy, that is heat capacity Cp, thermal
expansivity , and compressibility β, whilst having continuous first derivatives.
T II II II I I T I T I p G V V p V p G 2 2 2 2
(5)
T p G V V T V T p G II II II I I p I I 2 2
(6)
p II II p I p p I p I T G T C T C T S T G 2 2 2 2
(7)
Third and higher order transitions can be defined in principle by differentiating further.
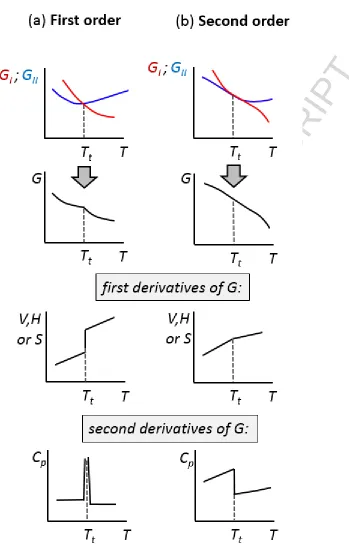
The changes in the thermodynamic properties (as a function of temperature) at the transition
point for first and second order phase transitions are shown in Figure 2. First order transitions
show discontinuities in volume, enthalpy and entropy, and have infinite heat capacity at the
transition. The heat capacity is infinite at the transition because it is given by the derivative of
enthalpy with respect to temperature, that is, Cp H/T, and the enthalpy shows a
discontinuous change (Equation 3). Physically, the energy added to the system is utilised in
driving the transition rather than on raising the temperature, and hence it represents the latent
ACCEPTED MANUSCRIPT
[image:13.612.80.429.74.633.2]12
Figure 2. Variation of thermodynamic properties at the transition temperature Tt for first
and second order phase transitions. The blue and red curves reflect the free energy of the
ACCEPTED MANUSCRIPT
13
For second order transitions the gradient of Gibbs free energy is continuous, and the entropy and
volume of the systems do not change. Since there is no entropy of transition ∆S, neither is there
any enthalpy of transition ∆H. The important discontinuous thermodynamic function for second
order transitions is that of heat capacity (see Figure 2).
It is difficult to visualise the nature of the free energy surface of second order transitions. Since
the gradients (the first derivatives) of the free energy are continuous, the gradients of the free
energy surfaces of the phases concerned are equal at the transition point. Hence, the surfaces
cross at a sharp transition point as with first order transitions, but instead partially overlap at a
transition regime (see Figure 2).
The scheme of Buerger is based on structural relationships between the crystal structures of the
phases concerned. Transformations are classified on the basis of structural changes involving
primary (nearest neighbours) or higher (next nearest neighbours) coordination, changes in type
of bonding, and whether disorder is involved. An integral part of the scheme is the relationship
between the structural changes involved and energy barriers affecting the kinetics of the
transformations. The classification is given with examples in Table 1. Note the focus on
ACCEPTED MANUSCRIPT
[image:15.612.68.497.96.504.2]14
Table 1. Classification of phase transformations according to Buerger [51]
Type of transition Transition velocity Example
First-coordination
transformations
(a) Reconstructive sluggish calcite-aragonite (CaCO3)
(b) Dilatational rapid caesium chloride (CsCl)
Second-coordination
transformations
(a) Reconstructive sluggish quartz-cristobalite-tridymite (SiO2)
(b) Displacive rapid high-low in SiO2
Transformations
involving disorder
(a) Orientational rapid ferroelectric-paraelectric NH4H2PO4
(b) Substitutional sluggish
Transformations of
bond type
sluggish grey-white tin
If the crystal structures are not similar, and the change from one structure to the other involves
significant re-organisation of the atomic (molecules) species, requiring (inter-species) bonds to
be broken and new ones to be formed, the transformation is considered to be reconstructive.
Since bond breaking is involved, Buerger expects the energy barriers for such transformations to
be high and the transformation rate to be sluggish.
Transformations involving subtler structural change in the first coordination are termed
dilatation. Here no bonds are broken and the transformation is thought to occur by mere
differential dilatation of the whole structure. Transformations of CsCl, NH4Cl and NH4Br, which
are all relatively simple structures, are considered to occur by this mechanism. According to
ACCEPTED MANUSCRIPT
15
considered to be relatively small and the transformation rate (at a given driving force) to be
rapid.
Transformations involving only the second coordination and where the crystal structures of the
phases concerned are similar, such that going from one phase to another does not require
breaking or making of bonds but rather distortion of bond angles and distances, are classified as
displacive. Again, since only minor structural changes are involved, the energy barriers are
considered by Buerger to be small.
Buerger's final category is that in which the crystal forms concerned differ greatly in the nature
of bonding. Examples are polymorphs of tin (grey and white), where the character changes from
semiconducting to metallic, and carbon (diamond-graphite), where the change is from an
insulator to a semiconductor. Note that both of these transformations involve major structural
changes and, therefore, could also be classified as reconstructive having large energy barriers.
Although Buerger's classification has become well established, it does appear to have some
significant drawbacks. Firstly, the classification appears to have been developed with ionic and
framework crystals in mind and mapping onto molecular crystals is not straightforward. For
instance, molecular crystals rarely exhibit meaningful second coordination shells. Nevertheless,
the terms displacive and reconstructive are now being used for phase transitions in molecular
crystals, the former when the structural differences between the phases are minor, and the latter
when the two phases differ in their hydrogen bonding networks. The use of the term
`mechanism', to describe the observed geometrical relationships (for example, distortion and
dilatation between the static crystal structures, is particularly unfortunate, being the cause of
much confusion. Its use has implied that the geometrical relationships actually describe the
structural changes taking place at the atomic/molecular level during a transition which we now
know not to be the case.
Ubbelohde [32-35] divided phase transitions into continuous and discontinuous. In continuous
transitions the crystal structure is expected to change smoothly and continuously from one form
to another. In discontinuous transitions the structural change involved is not smooth. Although
ACCEPTED MANUSCRIPT
16
to correspond to Ehrenfest's first order transitions and the continuous transitions to
order-disorder type transitions.
Another class of transitions often discussed separately is that of martensitic transformations [24].
Although various observations are associated with this class, there appears to be no clear
definition. Characteristics typically associated with martensitic transitions include velocity of
transition being of the order of propagation of sound and independent of temperature (athermal),
diffusionless and cooperative movement of atoms/molecules, definite orientational relationship
between the lattices of the phases concerned, extent of transformation being dependent on the
degree of cooling below the critical temperature, and transformation being affected by shear
stresses. Another key stated feature is macroscopic change of shape of the transformed region.
Some of these characteristics, however, are now being abandoned [24], and others do not offer
any clear distinction. The reduced criteria appear to be that martensitic transitions (i) are first
order, (ii) exhibit orientational relationships between the lattices, and (iii) and displacive shear of
the lattice upon transformation gives rise to shape-change in the material. Martensitic
transformations are observed in metals, alloys, and ceramics, and have significant technological
applications that include manufacture of transformation-toughened materials, smart materials
utilizing shape memory effects, and self-healing ceramics [29,54,55]. The term martensitic is
derived from the transformation of the austenite form of iron (containing a small amount of
carbon) by rapid quenching to yield the hard form of steel called martensite. A number of
molecular crystals are known to exhibit martensitic-type characteristics e.g. hexamethylbenzene
and DL-norleucine [56]. The transformation-induced shape change of martensitic materials
implies the conversion of chemical energy to mechanical activity i.e. work. On this basis,
thermosalient molecular crystals [15, and references therein; 57] (colloquially known as
‘jumping crystals’) in the act of jumping from a hot plate on transformation do mechanical work,
and hence these transformations would be considered to be martensitic.
So, how do polymorphic phase transitions fit into these classification schemes? The transitions
are invariably first order, and therefore local in nature occurring by nucleation and growth. They
may or may not exhibit an orientational relationship between the lattices of the phases
concerned. We do find the terms displacive and reconstructive useful, reflecting the nature of the
ACCEPTED MANUSCRIPT
17
We should add that until quite recently, structural concepts developed in the early last century
combined with intuition of atomic bonding was the only way to estimate whether the energy
barriers to nucleation were high or low. Using molecular simulations, as described below, we are
now able to characterise phase transitions by computing both atomic pathways and energy
profiles.
3.2 Molecular mechanisms
How do structural phase transitions occur at the molecular level? What actually happens to the
molecules in time and space? This implies the elucidation of the ‘reaction coordinate’ – the
mapping of the energetics and geometrical changes that occur in the course of a reaction, a
seminal development by Eyring in 1935 [58]. However, whilst the implementation of this
concept for solid-solid transformations is in principle straight-forward, in practice it is seriously
complicated by the large number of molecules (atoms) involved. This particularly holds for
molecular crystals which not only show displacements of molecular centres of masses, but also
rotation and deformation of the molecular entities.
Mechanistic studies based on Buerger's ideas involve comparisons of the crystal structures of
the polymorphs, and then a search for particular lattice transformations and molecular
translations and rotations which link the structures. The molecular translations and rotations are
then proposed as mechanisms for the transitions. A significant issue with this approach is that it
suggests that the transitions occur homogenously via the proposed molecular translations and
rotations throughout the bulk crystal. Such smooth transformation suggests that the free energy
surfaces of the two phases overlap within an extended regime, i.e. refers to second order
transitions (Figure 2)[59]. In contrast to this, first order transitions occur via nucleation and
phase growth, and molecular organization occurring at the reactive interface for these transitions
is unlikely to follow the structural changes proposed by Buerger-type analysis (see below in
Section 5). This is also reflected by the final state found after a first order phase transition, as
multiple nucleation events generally yield polycrystalline or domain structures with single
crystal to single crystal transitions being exceptions and typically limited to small or nanocrystals
ACCEPTED MANUSCRIPT
18
There is now overwhelming evidence that all solid-state transformations of the first order kind
occur heterogeneously by way of nucleation and growth [24]. Further, elegant experiments by
Mnyukh and co-workers [56,61-66], on single crystals of molecular compounds, have shown that
there is much similarity between the growth of a new phase in a solid-state transition and the
growth of a crystal from a liquid or a gaseous phase. The studies involved direct microscopic
observation, under maximum optical resolution, of single-crystal to single-crystal transitions,
coupled with Laue x-ray diffraction on a variety of molecular crystals. For each compound, the
crystals of the new phase (daughter), which grew within the parent crystals, exhibited facets with
low crystallographic indices that were, in general, irrational relative to the parent lattice. The
developing facets (representing the interface) also showed a series of steps such as those
normally observed in crystals growing from the liquid or the gaseous phase. In general, no
preferred orientation of the daughter crystals with respect to the parent lattice was observed, and
a certain degree of superheating and supercooling was always found to be necessary to induce
the transitions. This all strongly suggests that the mechanics of polymorphic phase transitions
are, in essence, similar to that of crystallisation but with the difference that the bulk medium for
the phase transitions is a crystalline lattice. For glutaric acid, the habit faces of the daughter
crystals have indeed been observed to be the same as those of crystals grown from the melt [62].
The theory of nucleation in solids developed by Turnbull [67] is essentially an extension, to
include effects of factors specific to condensed phases, of the theory proposed by Volmer and
Weber [68] and Becker and Doring [69] for homogeneous crystal nucleation from the melt. At
conditions just above the transition point, local fluctuations due to thermal agitation are thought
to cause some atoms (or molecules) of the initial phase to take up structural positions
corresponding to the product phase. The majority of these fluctuations result in the emerging
periodic structure being below a certain critical size, and hence show a net increase in Gibbs free
energy and are unstable. Only those fluctuations which lead to phase domains that exceed this
critical size are capable of continued existence and become the nuclei of the product phase (the
full thermodynamic account is given in Section 3.3). Growth of the new phase then reduces the
net Gibbs free energy and proceeds by relocation of the molecules at the interface from the initial
phase onto the nuclei. At the phase front, the molecular arrangements match neither the initial
ACCEPTED MANUSCRIPT
19
propagates such that the transition process continues until the entire crystal has transformed to
the new phase.
In real crystals, nucleation occurs at preferred sites such as edges, surfaces, grain boundaries,
stacking faults, dislocations and point defects. Such deviations from the ideal lattice can
considerably lower the necessary activation energy for the nucleation step. Indeed, these crystal
imperfections appear to be a necessary condition reducing the hysteresis of polymorphic
transitions. An extreme example illustrating this are high quality single crystals that only
transform after defects are introduced by mechanical means, for example, by pin pricks [65].
At the phase front (the region where active rearrangement is taking place) it is thought (e.g.
[63,25] that the process taking place is just simple relocation of the atoms/molecules from the
initial to the product phase, and that there is no intermediate amorphous layer, as had been
proposed by Hartshorne and co-workers [[70,71] and Bradley [72], but only a small gap (due to
the mismatch between the lattices of the initial and the product phase) which is on average
approximately half a molecular layer. The process is illustrated in Figure 3. The idea of the
amorphous interface was discounted because the observed rates of transformations could never
be reconciled with this postulate. In addition, results of experimental measurements and
theoretical calculations (using the atom-atom potential method) of the tensile strength of the
interface [65] have been found to be consistent with the above proposed mechanism, rather than
with the existence of an amorphous layer. However, recent molecular simulations reveal that the
molecular processes at the transformation interface do not always fall so neatly into this scheme.
Depending on the nature of bonding, interfaces can be sharp, extended, even diffusive [59,73].
ACCEPTED MANUSCRIPT
20
Figure 3. Proposed mechanism for the molecular rearrangement at the interface of a
polymorphic transformation. Molecules detach one by from the parent phase and attach
onto the surface of the emergent daughter phase. Energy considerations suggest that the
process of detachment and attachment would occur on a molecule per molecule basis. This
is akin to shifting a carpet by inducing a kink which is then propagated rather than
wholesale shift of the carpet which is much more challenging. (Reproduced with permission
from reference [127] J. Anwar, S. C. Tuble and J. Kendrick, J. Am. Chem. Soc., 2007, 129,
2542–2547; copyright 2007 American Chemical Society).
3.3 Kinetics
The rates at which polymorphic transitions occur vary enormously. Depending on the nucleation
barrier, transitions may be extremely rare as, for example, the diamond to graphite
transformation that occurs over geological timescales at ambient conditions. At the other
extreme, many compounds show transformations that are so spontaneous that time-resolved
experiments become challenging [74]. In developing the theoretical framework for kinetics, it is
necessary to make a clear distinction between the two stages of transformation, i.e. nucleation
and phase propagation, each of which is subject to a distinct energy barrier. Typically, the energy
barrier for propagation is much smaller than that for nucleation. Indeed, the barrier to nucleation
constitutes a conceptual maximum for the propagation energy barrier. As a consequence, phase
front propagation can be very fast, even at the speed of sound - which is that of (elastic) density
wave propagation in the crystal. An example of fast phase-front propagation in molecular
crystals is that exhibited by DL-norleucine, where the rate of advance of the interface can be of
the order of 10 cm/seconds even at very low superheating or supercooling [56].
The phase transition kinetics (for both nucleation and interface advance) have a certain
dependence on the extent of superheating or supercooling (see Figure 4). The implication is that
ACCEPTED MANUSCRIPT
21
poorly applicable. At temperatures very close to the transition temperature Tt, the net rate of
transition is negligible (be it because of the structure being inert or because of balancing of the
phase-front propagation in either direction). This temperature range over which the
transformation rate is low corresponds to the hysteresis in the observed transition temperature.
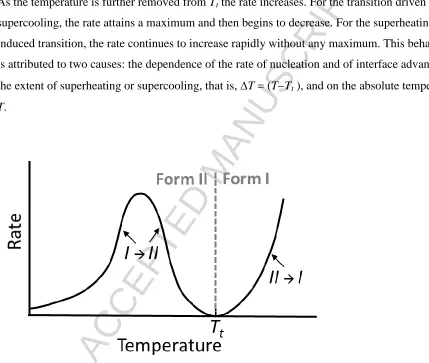
As the temperature is further removed from Tt the rate increases. For the transition driven by
supercooling, the rate attains a maximum and then begins to decrease. For the
superheating-induced transition, the rate continues to increase rapidly without any maximum. This behaviour
is attributed to two causes: the dependence of the rate of nucleation and of interface advance on
the extent of superheating or supercooling, that is, T = (TTt ), and on the absolute temperature
[image:22.612.75.504.160.523.2]T.
Figure 4. Temperature dependence of the transformation rate for the transformations
I→II and II→I as observed below or above Tt, respectively. Note that the overall rate is
mainly determined by that of nucleation, whilst interface advance for polymorphic phase
transformations is typically relatively fast.
First order phase transitions are initiated by local nucleation events, resulting in budding of new
phase domains, the nuclei, which then grow until the full crystal is transformed. The formation of
nuclei results in the creation of new surfaces and, if volume change is involved (which it
ACCEPTED MANUSCRIPT
22
change involved in the process of nucleation. The net free energy GN, therefore, does not
simply equate to the free energy change due to the formation of the new phase within the nuclei
Gbulk, but is the combination of this and the free energy change due to the generation of the new
interface Ginterface, and associated strains Gstrain [67]. For nucleation to occur, GN must be
negative.
strain interface
bulk G G
G
GN
(8)
The first term is negative while the second and third terms are positive. To a first approximation
the strain term may be ignored (or, more precisely, implicitly considered as part of the bulk and
interface terms). Indeed, it is intuitive to assume that a forming nucleus would adopt a shape
such that shear stresses at its surfaces cancel out. The actual shape of a forming phase domain
depends on the relation of parent and daughter lattices and may take the form of a cube, prism, or
a complex polyhedra. For the sake of simplicity, the nucleation theory discussed in the following
is elaborated for spherical nuclei. While nuclei in solid-solid transformation are typically not
spherical, this is still the most commonly used model. The general physics discussed below may
be transferred to all shapes as analogous expressions can be developed for any regular shape.
Then for a spherical nucleus of radius r the explicit form of GN is
3 2
4 3 4 r g r
GN V
(9a)
The corresponding expression for a cubic nucleus of dimension a would read:
3 2
6a g a
GN V (9b)
where gV is the bulk free energy per unit volume and is the surface free energy per unit area.
t I nucleus II I t II nucleus I II nucleus bulk V T T I II V G G T T II I V G G V GACCEPTED MANUSCRIPT
23
From the expression 9a, it is clear that for small radii r the second term (that due to the interface)
will dominate, and since its contribution is positive, GN will be positive. Consequently, any
embryo that might form with a radius below some critical size will be thermodynamically
unstable and hence will disperse. With increasing r, GN goes through a maximum at r = rc, the
critical radius, and then begins to decrease as the bulk free energy term begins to dominate. The
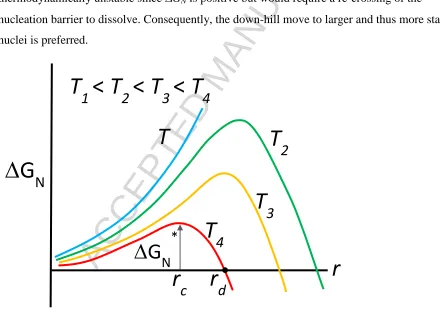
variation of GN as a function of the radius at a number of different temperatures is shown in
Figure 5. At r = rd , GN goes through zero and for r > rd it is negative. Nuclei with r > rd
become stable crystals. Embryos with r between rc and rd are metastable nuclei – they are
thermodynamically unstable since GN is positive but would require a re-crossing of the
nucleation barrier to dissolve. Consequently, the down-hill move to larger and thus more stable
[image:24.612.74.514.253.565.2]nuclei is preferred.
Figure 5. Variation of the free energy change for nucleation GN as a function of radius r at
various temperatures. GN* is the critical free energy characterizing a nucleus with a
critical radius rc.
r
G
N
T
T
2
T
3
T
4
T
1
<
T
2
<
T
3
<
T
4
G
N
*
ACCEPTED MANUSCRIPT
24
Expressions for the critical radius rc and the critical excess free energy GN* can be obtained by
using the necessary condition of GN/r = 0 and rearranging for rc:
V c
g r
2 (11)
and substituting this into Equation 9a
2 3 * 3 16 V N g G
(12)
To a first approximation the dependence of on temperature may be ignored. ∆gV, as it may be
seen below, whilst zero at Tt , is however proportional to (T-Tt) at other temperatures. At
temperature Tt
0
G GII GI H Tt S or, if written per volume unit,
0
h T s
V G g t nucleus V So, t t T h s T H
S
and (13)
Therefore, at any other temperature T (substituting into the Gibbs free energy function i.e.
Equation 1 and assuming H and S do not change with temperature – hence the reason for the
non-exact term)
T T
T h g T T T H T H T H G t t V t t t
ACCEPTED MANUSCRIPT
25 Substituting this into Equations 11 and 12 gives
T T
h T r t t c 2 (15)
2 2 2 3 * 3 16 T T h T G t t N (16)
where ∆h is the enthalpy change per unit volume of the phase transition.
Hence, the critical radius rc is inversely proportional to T =T-Tt. At temperatures close to Tt,
gV 0 and rc becomes infinitely large. Consequently, nucleation cannot occur at Tt. On
increasing T the magnitude of rc and the free energy barrier GN* decrease, resulting in an
increase, within a given time, in the population of embryos which go on to become stable nuclei.
The rate of nucleation, therefore, increases with increase in the degree of superheating or
supercooling.
Consider now the effect of absolute temperature on the nucleation rate. The rate of nucleation is
given by the product of the population of the critical-sized embryos that may be present and the
probability (frequency) of their conversion to the new phase. If the number of embryos present in
the parent phase are N0, then from Boltzmann statistics the number of these which are of critical
size (Nc ) can be approximated by
T k G N N B N c *
0exp (17)
where kB is the Boltzmann constant.
The conversion of critical-sized embryos to stable nuclei requires the transfer of at least one
atom or molecule across the interface onto the embryo. Such transfers or jumps are subject to the
activation energy G* of phase-front propagation. For the transformation of phase II to I, if the
ACCEPTED MANUSCRIPT
26
frequency growth step with which the atoms (or molecules) cross the interface and attach to the
embryo is given by
T k G B I II * step
growth exp
(18)
where is the lattice vibration frequency, and G*III is the free energy of activation for the
transfer of atoms (or molecules) of phase II to the emerging nuclei of phase I (see Figure 6).
The rate of post-critical nuclei formation (per unit volume per unit time) is the product of the
population of critical-sized embryos and their rate of conversion to stable nuclei and is therefore
given by T k G G N dt dN B I II N C * *
0exp (19)
where G*III reflects the kinetic barrier to phase propagation in the II I direction, whilst GN*
describes the thermodynamic disfavoring of forming a nucleus of critical size of the new phase.
The nucleation rate predicted by this expression as a function of temperature takes the form
shown in Figure 4. At Tt the rate is zero. In the temperature region below Tt it passes through a
maximum and then tends to zero at 0K. Above Tt the rate increases rapidly with temperature.
The cause of this characteristic variation is the temperature dependency of GN* described earlier
(Equation 16).
Once a post-critical nucleus is formed, the transformation kinetics then depend on the rate of
phase propagation (interface advance). The effect of temperature on the rate of phase
propagation can also obtained from transition state theory. Here we follow and build on the
formalism developed by Young [75] and Rao and Rao [25]. In full analogy to the above
discussion, the advance of the interface is considered to be via an atom-by-atom (or
molecule-by-molecule) transfer across the interface between the two phases, with the transfers or jumps
ACCEPTED MANUSCRIPT
27
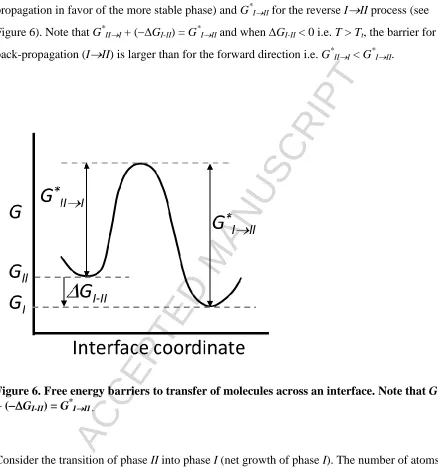
propagation in favor of the more stable phase) and G*III for the reverse III process (see
Figure 6). Note that G*III + (GI-II)= G*III and when GI-II < 0 i.e. T > Tt, the barrier for
back-propagation (III) is larger than for the forward direction i.e. G*III < G*III.
Figure 6. Free energy barriers to transfer of molecules across an interface. Note that G*III
+ (GI-II)= G*III .
Consider the transition of phase II into phase I (net growth of phase I). The number of atoms (or
molecules) transferred from phase II to I via the interface area A per unit time may be written as
T k G p
n A dt
dN
B I II II
I II II I
II
*
exp
(20)
where nII is the number of atoms (or molecules) per unit area of phase II at the interface, II is the
frequency of atom (molecule) vibration normal to the interface and pII→I is the probability that
[image:28.612.77.515.70.542.2]ACCEPTED MANUSCRIPT
28
Similarly, the number of atoms (or molecules) leaving phase I is given by
T k G G p n A T k G p n A dt dN B II I I II I II I I B II I I II I I II I * * exp exp (21)
The net transfer of atoms (molecules) into phase I is
T k G G p n A T k G p n A dt dN B II I I II I II I I B I II II I II II I * * exp exp
(22)
At phase coexistence, phase fronts may be subject to fluctuations, but no net growth of either
phase occurs. As ∆GI-II = 0 the two exponential terms become identical and the coexistence
condition reads: I II I I II I II II t
I at T T n p n p
dt
dN
0 (23)
In other terms, the differences in density n and vibrational frequency υ in phases I and II is
compensated by the different probabilities pIII and pIIIthat a spontaneous vibration locks into
a lattice site of phase I and II, respectively.
To rationalize this issue, consider for example the case of nI < nII. For a successful jump from
phase I to phase II, atoms (molecules) will need to leave a comparably large volume and lock
into a smaller one. For an individual jump across the interface, chances to reach a suitable lattice
site are thus pIII < pIII. However, the denser phase II offers more candidates for such jumps,
effectively balancing the net transformation rate at ∆G=0. It is intuitive to assume
I II I I II I II
IIp n p
n to hold as a good approximation beyond the phase coexistence line, i.e.
for ∆G≠0, and what follows will be based on this consideration.
The net speed of phase interface propagation may be deduced from the increase of a nucleus
ACCEPTED MANUSCRIPT
29 A N dt d A V dt d dt dx I I nucleus 1 (24)
where ρI is the number density of phase I. Using the above considerations, we get
T k G T k G p n T k G G p n T k G p n dt dx B II I B I II II I II II I B II I I II I II I I B I II II I II II I exp 1 exp 1 exp exp 1 * * *
(25)
which is commonly written as
T k G T k dt dx B II I exp1 (26)
where k(T) is the temperature-dependent rate constant for the atomic jump across the interface
triggered by the activation energy GII→I* for forward propagation of the phase front.
T k G T k B I II * exp const )
( (27)
This rate constant relationship is similar to the classical Arrhenius equation.
Equation (25) predicts that at Tt, since GI-II = 0 and exp(GI-II /kBT) = 1, the net speed of phase
front propagation is zero. At moderate favoring of the phase transition, G is negative but small
and exp(GI-II /kBT) < 1, hence the rate will also be low. With increasing thermodynamic driving
of the II→I transition, GI-II gets increasingly negative and G*III << G*III , thus leading to a
diminishing rate of back-propagation. For GI-II → -∞, exp(GI-II /kBT) = 0, and equation (25)
formally predicts a speed limit – which may be associated with the speed of sound within the
parent phase II, i.e. the maximum speed of any mechanical action applied to the solid.
If the transition is induced by supercooling, fast phase-front propagation driven by maximum G
ACCEPTED MANUSCRIPT
30
drop in temperature. The equation, therefore, predicts that with an increase in supercooling, there
is a maximum in the phase transformation rate followed by a decrease. The location of this
maximum depends on both, the thermodynamic favoring of the transition ∆G and the barrier to
phase front propagation G*, which in principle can be deduced from experiment using Equations
26 and 27. On the other hand, on superheating the rate of the transformation increases rapidly
with no maximum predicted, with both the thermodynamic potential Gand the
temperature-dependent rate constant k(T) acting in concert. An illustrative example of this kinetic behavior of
interface advance is exhibited in single crystals of p-dichlorobenzene as a function of T [61].
In typical kinetic studies of phase transitions, see e.g. [76], it is normally assumed that the effect
of temperature on the rate of interface advance is solely due to its effect on the rate constant as
given by the Arrhenius equation. From the foregoing discussion, it is clear that this is only true at
temperatures well away from Tt. This conclusion is indeed borne out in experimental studies, see
e.g. [77,78].
The characterisation of bulk kinetics of phase transitions in the solid state is fundamentally
different from that in the liquid or the gaseous phase. In the solid state the important
conventional concepts of concentration, order of reaction or molecularity have little or no
application. Instead, because of the relative immobility of the constituent atoms or molecules, the
kinetics are governed by topochemical factors (n, p and ν in Equation 20).
Ideally, in common with interface-controlled solid state reactions, the fundamental parameters in
solid phase transitions are the rate of nucleation characterized by the rate constant kN, the spatial
distribution of the formed nuclei, that is, whether the nuclei are confined to the surface or occur
throughout the bulk crystal, and the rate of subsequent advance of the formed interface,
characterized by the rate constant kG. The rate of interface advance may be anisotropic, being
characteristic for the different crystallographic directions in the crystal kG(hkl). Coupled to the
temperature-dependent rate constants are the temperature-independent activation energies EN*,
EG * (hkl)). Nucleation may be instantaneous, or its rate may follow a linear, exponential, or
another power law. The progress of interface advance is, to a first approximation, usually linear
with time, governed by a maximum speed given by that of sound along the corresponding
cystallographic direction [79]. Further, finite size effects may be crucial for materials that either
ACCEPTED MANUSCRIPT
31
In practice, the kinetics are often further complicated and not always quantitatively reproducible
[66]. Irreproducibility, in the main, stems from the variation in crystal perfection. Both
nucleation and the rate of interface advance are markedly dependent on defects in the crystal. In
a good quality crystal, that is, one with few defects, nucleation is difficult if not impossible. If,
however, certain defects are introduced artificially, for example, by means of pin pricks, then
nucleation at these defects is almost instantaneous even at very low superheating or
supercooling. Likewise, the rate of interface advance can also show considerable variation
depending on the quality of the crystal, and may not always be linear with time: it may increase
or decrease with time or on recycling, or show stop-start or rapid burst behavior. Such behaviour
is again attributed to defects. Acceleration of the rate of interface advance is thought to occur as
a result of defects accumulating ahead of the interface, whilst rapid-bursts, deceleration or
temporary stoppage are considered to be caused by the release of strain built up at the interface;
the rapid bursts occurring due to generation of defects ahead of the interface possibly initiating
additional nucleation sites, and stoppages because of disturbance of the proper contact between
the two forms at the interface – an example of the latter being stacking fault formation [74].
Work on single crystals of p-dichlorobenzene [61] has shown that the velocity of interface
advance can also be dependent on the number of cycles of transition that a crystal has undergone.
With an increasing number of transitions the velocity was observed to decrease. This was
explained as being due to depletion of defects with each cycle, the defects being consumed by
the interface and then released at the crystal surface. The velocity was also influenced by the
presence of other interfaces nearby; it increased greatly as the approach distance between the
interfaces became less than about 1.5mm. Buildup of defects at the interface and their transport
into the region between was proposed as the explanation.
Experimental determination of the kinetic parameters is best carried out on single crystals using
direct microscopic observation. This, however, may be either impossible because of a lack of
single crystals, or inappropriate when, for example, kinetic parameters are required for a
polycrystalline or a powdered sample. When single crystals are not available, the fundamental
kinetic parameters cannot be determined directly. Experimentally, only the overall rate in terms
of the fraction of material transformed (t,T) as a function of time and/or temperature is
ACCEPTED MANUSCRIPT
32
of extraction of the fundamental parameters for a given sample from the overall rate data
(time curve). The task is complicated further because the overall rate is strongly dependent on
the crystal morphology, crystal size and size distribution as well as crystal perfection. Moreover,
changes in shape, the degree of poly-crystallinity and even fragmentation may result from
polymorphic transitions themselves, thus complicating experimental reproducibility even further.
The modelling of solid state kinetic data to a large degree is a problem in solid geometry. In
developing an expression that describes the overall rate of a polymorphic transition one needs to
take into account: (i) crystal morphology, size and size distribution; (ii) spatial distribution of the
nuclei; (iii) appropriate nucleation rate law and corresponding rate constant; (iv) rate of interface
advance, which usually can be assumed to be linear with time but may be anisotropic, being
characteristic for the individual crystal facets of the new phase; and (v) correction for the
ingestion of potential nucleation sites and the contact/coalescence of the growing nuclei, which
results in reduction/loss of reactive interface as the reaction proceeds to completion.
The development of a generalised kinetic expression, therefore, is not a trivial task.
Consequently, a number of equations for specific cases have been developed [80-84]. Of these,
probably the most successful is that proposed by Avrami [80-82]. This takes the form
n
kt
1 exp
(27)
where k is the overall transformation rate constant, and 1 ≤ n ≤ 4 depending on the spatial
distribution and the rate of nucleation.
When dealing with powdered samples comprising very small particle size, the Avrami model
may not apply. The Avrami model assumes that potential nuclei of the new phase are randomly
distributed throughout the bulk of the crystal, and that these nuclei, once activated, grow
throughout the old phase until the transformation is complete. When a crystal is progressively
subdivided (i.e. comminuted or powdered), there comes a stage when there will be only a few
potential nuclei within each crystallite. As the rate of nucleation is considered to be proportional
to the number of potential nuclei present, the transformation will, therefore, become nucleation
ACCEPTED MANUSCRIPT
33
transformation due to any nucleation event will be constrained to the particular crystallite within
the powder.
Further, for powdered samples, the phase transformation often does not go to completion, with
the maximum fraction (max) transformed depending on the extent of superheating or
supercooling [85,86]. The cause here is that some of the crystallites do not have potential nuclei
that can be activated at the particular temperature of study, and hence the transformation does not
proceed to completion. Higher temperatures are able to activate the higher activation energy
nuclei, bringing additional crystallites into the transformation. Consequently, max depends on
the temperature, with higher temperatures leading to higher values ofmax [86,87]. Clearly, for
powder samples there is a need to incorporate a distribution of activation energies in the kinetic
model [86,88].
In summary, characterisation of the kinetics of polymorphic phase transformations, particularly
transformations in powders, is complex. For powders, usually only a single overall activation
energy can be estimated, and this by itself, because it contains contributions from nucleation
events and phase growth, conveys no rigorous mechanistic insight. In addition, because of
thermodynamic considerations the data will invariably depart from ideal Arrhenius behaviour,
especially at temperatures close to phase coexistence. Finally, the data may be irreproducible
from sample to sample, because of variation in crystallite size, shape, quality or history.
4
Molecular simulation of polymorphic phase transitions
4.1 Molecular simulation methodology
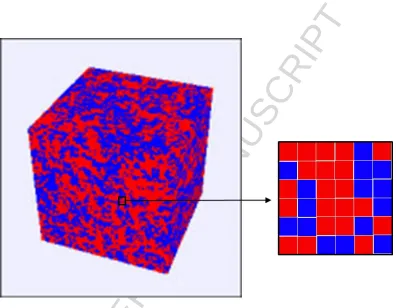
Possibly the simplest simulation approach to studying phase transition phenomena is the Ising
model and its generalization, the Potts model [23]. The Ising model consists of discrete elements
on a lattice that represent magnetic dipole moments of spins, with each element for instance
representing a crystallite/domain (Figure 7). The spin in each element can be either up or down
and would be influenced by the spin in its neighbouring (interacting) elements and any external

![Table 1. Classification of phase transformations according to Buerger [51]](https://thumb-us.123doks.com/thumbv2/123dok_us/9358950.438060/15.612.68.497.96.504/table-classification-phase-transformations-according-buerger.webp)