ISSN Online: 2327-5227 ISSN Print: 2327-5219
DOI: 10.4236/jcc.2018.61006 Dec. 29, 2017 56 Journal of Computer and Communications
Effects of JPEG Compression on Reading
Optical Watermarking Embedded by
Using Color-Difference Modulation
Kazutake Uehira, Hiroshi Unno
Department of Information Network and Communication, Kanagawa Institute of Technology, Atsugi, Japan
Abstract
In this paper, we evaluate the readability of optically written watermarking from an image compressed by JPEG. We previously proposed an optical wa-termarking technique that can protect the portrait rights of real objects. It produces a watermarking pattern in the illumination light by modulating col-or differences. The illumination light that contains such watermarking is pro-jected onto an object. An image of the object taken by a camera contains the same watermarking, which can be extracted by image processing. Therefore, this technique can protect the portrait rights of real objects. We conducted simulations of capturing an object image illuminated by watermarked light, compressing it by JPEG, and reading embedded information from the de-coded image. The simulation results showed that the accuracy in reading out embedded information decreases when captured images are compressed. However, for medium-level or low compression rates 100% accuracy can be expected by using the error correction technique.
Keywords
Digital Watermarking, Information Embedding, Portrait Rights
1. Introduction
The distribution of digital images is increasing as the Internet becomes broad-band and cloud services become popular. This has increased the importance of protecting the copyright of digital images distributed on the Internet because digital images can easily be copied in a way such that they are exactly like the original.
Digital watermarking is an effective way of protecting digital image copyrights How to cite this paper: Uehira, K. and
Unno, H. (2018) Effects of JPEG Compres-sion on Reading Optical Watermarking Embedded by Using Color-Difference Mo- dulation. Journal of Computer and Com-munications, 6, 56-64.
https://doi.org/10.4236/jcc.2018.61006
DOI: 10.4236/jcc.2018.61006 57 Journal of Computer and Communications from being illegally copied and various digital watermarking techniques for dig-ital images have been developed [1] [2] [3] [4].
Digital watermarking has also been used in printed images, where digital wa-termarking is embedded in the digital data before the images are printed [5] [6] [7]. This is to prevent the images from being copied from printed images by dig-ital cameras or scanners.
However, conventional digital watermarking rests on the premise that people
who want to protect the copyrights of their digital content, i.e., content creators
or content providers, have the original digital data and they can embed water-marking in the original digital data by digital processing.
However, this premise does not always hold. For example, it does not hold in the case that a person took a photo of a painting at a museum with a digital camera. Since recent digital cameras are highly advanced, captured images have very high levels of quality and if the painting is invaluable as a portrait, the cap-tured image of the painting also has high value. Therefore, the portrait rights of such paintings should be protected. However, images captured with digital cam-eras do not have watermarking in this case because they have been captured by visitors to museums who are not interested in protecting portrait rights.
We previously proposed a technique that could prevent the copyright or por-trait rights of images of real objects captured with a camera [8] [9]. It used illu-mination that contained invisible watermarking. As the illuillu-mination contained the watermarking, the captured images of objects that were illuminated by such illumination also contained watermarking. We demonstrated the feasibility of this technique producing watermarking by spatially modulating the brightness of the illumination. Moreover, we produced watermarking by modulating color differences in illumination and demonstrated that readability and invisibility of the embedded information in this method were superior to the brightness mod-ulation method [10].
DOI: 10.4236/jcc.2018.61006 58 Journal of Computer and Communications table text styles are provided. The formatter will need to create these compo-nents, incorporating the applicable criteria that follow.
2. Embedding Watermarking in Illumination by
Modulating Color Differences
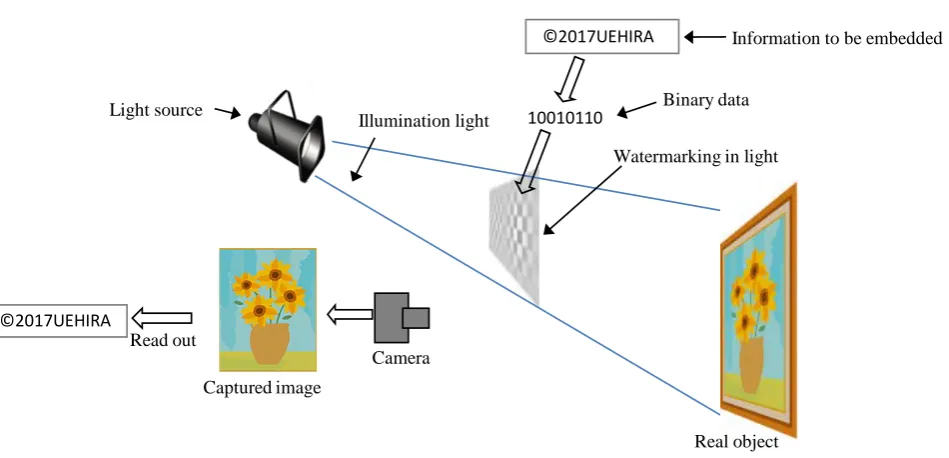
Figure 1 outlines the basic concept underlying our watermarking technique us-ing illumination light to embed a watermark. A real object is illuminated by projected light that contains an invisible watermark. A photograph taken of the object illuminated in this way would also contain the same watermark as that in the illumination light. The watermark can be extracted in the same way as that used in conventional digital watermarking techniques for digital images.
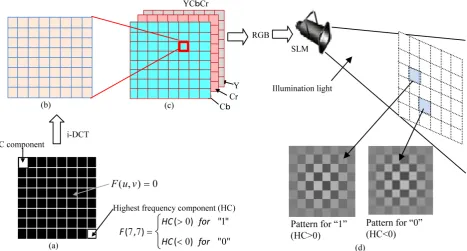
There are various ways of producing optical watermarking; Figure 2 illu-strates one of them. YCbCr (Y: luminance, Cb: chroma-blue, Cr: chroma-red) signal is used and among them the Cb component (a color difference signal) is modulated to produce the watermarking. The basic procedure for producing the watermarking is the same as that in we reported in our previous study, where we produced watermarking by modulating the brightness [9]. First, the whole image area that corresponds to the illumination area is divided into numerous blocks as shown in the figure. The initial data of the Cb component is produced as the frequency domain data for each block. Each block only has the highest frequency component (HC) in both the x and y directions. The absolute value of HCs is the magnitude of modulation. We express one-bit binary data as being embedded by
the sign of the HCs, i.e., if an HC is positive, it is expressed as “1” and if it is
negative, it is expressed as “0”.
[image:3.595.64.539.477.706.2]After setting HCs for all blocks, the frequency domain data for each block is converted into block image data in the space domain by inverse discrete cosine transformation (i-DCT), and all block images are combined into one image. The
Figure 1. Basic concept underlying proposed technique.
Information to be embedded
Read out
Captured image
Camera Light source
Illumination light 10010110
Binary data
Watermarking in light
©2017UEHIRA
©2017UEHIRA
DOI: 10.4236/jcc.2018.61006 59 Journal of Computer and Communications
Figure 2. Procedure for producing optical watermarking. (a) Block data of Cb in frequency; (b) Block image data in space domain; (c) Whole image data; (d) Watermarking patterns. These two patterns have opposite phases.
Y is a set constant value in the whole image area. This value gives averaged
brightness. The Cr component is set to zero in the whole image area. Finally, the YCbCr signal is converted to an RGB signal, input to a space light modulator (SLM), and changed to illumination light that illuminates real objects such as paintings. We were able to use a commercial projector as an SLM for this pur-pose. Figure 2(d) shows the two watermarking patterns in the light; these pat-terns are for the “1” and “0” of binary data. Both are highest-frequency patpat-terns but have opposite phases.
The captured image of the real object illuminated by the illumination light al-so has a high-frequency pattern in the Cb component image; that is, the cap-tured image also contains watermarking.
The watermarking pattern in the light and in the captured image cannot be seen by the human visual system because it is modulated at the highest frequen-cy and the amplitude of modulation is small.
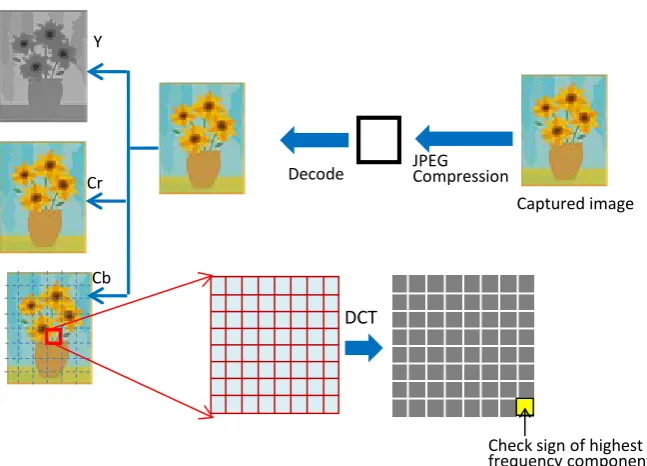
Figure 3 indicates the procedure from capturing the image to reading out the embedded watermarking. In practical use, captured images are usually com-pressed before being stored in the camera’s memory. However, this process de-creases the high frequency component and may decrease the accuracy in reading out the embedded watermarking.
DOI: 10.4236/jcc.2018.61006 60 Journal of Computer and Communications
Figure 3. Procedure from capturing image to reading out embedded watermarking.
checking the sign of the frequency component in which binary data are embed-ded for each block.
3. Simulation
We evaluated the effect of image compression on accuracy in reading out em-bedded watermarking by simulating the procedure of capturing object images, compressing the images, and reading out the embedded information. We used JPEG to compress the images.
3.1. Simulating Object Image Capturing
The image data, I(x,y), of an object captured with a camera is proportional to the
brightness of the object surface. The brightness, B(x,y), is obtained as a product
of the reflectance of the object surface, R(x,y), and the luminance of the
pro-jected light at the object surface, L(x,y), as
( )
,( ) ( )
,{
, 0}
B x y =R x y L x y +L (1)
where L0 is bias luminance such as that produced by room light.
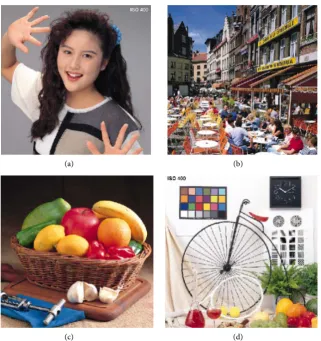
As objects we used standard images that had 512 × 512 pixels, as shown in Figure 4. That is, we used RGB pixel values of standard images as the reflectance
of the object surface, R(x,y), as shown in Equation (1). In order to execute
mul-tiplication on a pixel-by-pixel basis in the equation, we set the number of pixels in the pattern projected on the object to also be 512 × 512 pixels.
We first generated the data of the Cb component in the frequency domain for
L(x,y) in Equation (1), as shown in Figure 2(a). The data were generated for
each block. The signs of the highest frequency component (HC) for each block were determined depending on whether “1” or “0” was to be embedded in that
JPEG Compression
Captured image Decode
Cr Y
DCT
Cb
DOI: 10.4236/jcc.2018.61006 61 Journal of Computer and Communications
(a) (b)
[image:6.595.214.536.66.408.2]
(c) (d)
Figure 4. Images used as objects in simulation. (a) Image A; (b) Image B; (c) Image C; (d) Image D.
block. The same “1” and “0” numbers were randomly embedded. The magnitude of HC in the original data was changed from one to 10 as an experimental para-meter, while Y, Cr, and L0 were set to constant values of 200, 0, and 40. These values were the gray levels of image data whose maximum was 255.
The captured image, I(x,y), is proportional to B(x,y). However, according to
sampling theory, in order for I(x,y) to have the highest frequency component
that B(x,y) has, I(x,y) needs to have twice as many pixels in the vertical and
ho-rizontal directions as B(x,y). Therefore, we produced I(x,y) by doubling the
number of B(x,y) pixels vertically and horizontally. Therefore, the image had
1024 × 1024 pixels.
3.2. Simulating and Decoding Image Compression by JPEG
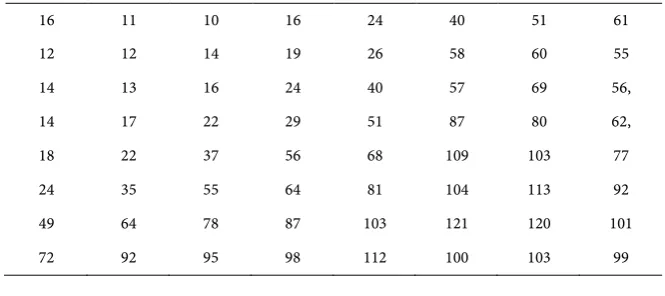
DOI: 10.4236/jcc.2018.61006 62 Journal of Computer and Communications numerical values called scale factors. Table 1 indicates the quantization table used in this simulation; scale factors of 1 to 10 were used. The larger the divisor for the frequency component is, the higher the compression rate becomes. Therefore, when the scale factor is one the divisor for the frequency components and the compression rate both have maximum values. On the other hand, when the scale factor is ten, the compression rate has a minimum value. We consider that accuracy in reading out the embedded information depends on the com-pression rate.
3.3. Simulation of Reading out Embedded Information
A decoded image was divided into 4096 (64 × 64) blocks. For each block, Cb components were converted into data in the frequency domain by the DCT.
Embedded data were read out by checking the sign of the (7,7) frequency component of the Cb for each block. The accuracy with which data was read out was evaluated on the basis of the percentage of data that was correctly read out from 4096 binary data.
4. Results and Discussion
Figure 5 shows the obtained simulation results on the accuracy with which the binary data was read out. As expected, they revealed that the accuracy was lower when images were compressed than when they were not. They also show that the
accuracy becomes lower as the scale factor becomes smaller (i.e., as the
compres-sion rate becomes higher).
It is desirable for the accuracy to reach 100% for HC under 10 because at that HC level watermarking is almost invisible when Cb is modulated [10]. However, it is difficult to reach 100% when an image is compressed.
[image:7.595.207.540.586.734.2]In cases where an error can be expected to occur when embedded information is read out, we can use the error correction technique. In fact we used this tech-nique in a previous study where we modulated the luminance [8]. In doing so, we embedded one binary data at three positions far from each other. When we read the data out, we used majority decision to determine the correct data if these three data are not the same. Using this technique, we were able to obtain
Table 1. Quantization table used in experiment.
16 11 10 16 24 40 51 61
12 12 14 19 26 58 60 55
14 13 16 24 40 57 69 56,
14 17 22 29 51 87 80 62,
18 22 37 56 68 109 103 77
24 35 55 64 81 104 113 92
49 64 78 87 103 121 120 101
DOI: 10.4236/jcc.2018.61006 63 Journal of Computer and Communications
(a) (b)
[image:8.595.63.536.63.481.2](c) (d)
Figure 5. Accuracy obtained in reading out binary data. Accuracy indicates percentage of data correctly read out from 4096 binary data. ( : no compression, : scale factor is 10, : scale factor is five, : scale factor is one) (a) Image A; (b) Image B; (c) Im-age C; (d) ImIm-age D.
100% accuracy in reading out embedded information even if it had been around 80% when error correction was not used. Therefore, we expected that in this study 100% accuracy could be achieved by using the error correction technique except for cases when the scale factor was one. A scale factor of one results in high compression rate and poor image quality. A scale factor of five results in medium level compression rate and medium level image quality, and a scale factor of 10 results in low compression rate and high image quality. Therefore, this technique can be used for medium-level and high quality images.
5. Conclusion
In this study, we evaluated the accuracy of reading out optically written water-marking from a captured image compressed by JPEG. We conducted
simula-Accu
ra
cy
(%
)
HC
Accu
ra
cy
(%
)
HC
Accu
ra
cy
(%
)
HC
Accu
ra
cy
(%
)
DOI: 10.4236/jcc.2018.61006 64 Journal of Computer and Communications tions of capturing an image of an object illuminated by the watermarked light, compressing it by JPEG, and reading out the embedded information from the decoded image. The simulation results showed that accuracy in reading out em-bedded information decreases when the captured image is compressed, but that for medium-level or low compression rates 100% accuracy can be expected by using the error correction technique.
Acknowledgements
This study was supported by the Japan Society for the Promotion of Science (JSPS) under Research Institute Grant No. 16H02820.
References
[1] Cox, I.J., Kilian, J., Leighton, F.T. and Shamoon, T. (1997) Secure Spread Spectrum Watermarking for Multimedia. IEEE Transactions on Image Processing, 6, 1673- 1687. https://doi.org/10.1109/83.650120
[2] Hsu, C.-T. and Wu, J.-L. (1999) Hidden Digital Watermarks in Images. IEEE
Transactions on Image Processing, 8, 58-68. https://doi.org/10.1109/83.736686
[3] Hartung, M. and Kutter, M. (1999) Multimedia Watermarking Techniques.
Pro-ceedings ofIEEE, 87, 1079-1107. https://doi.org/10.1109/5.771066
[4] Langelaar, G.C., Setyawan, I. and Lagendij, R.L. (2000) Watermarking Digital Image and Video Data. IEEE Signal Processing Magazine, 17, 20-46.
https://doi.org/10.1109/79.879337
[5] Mizumoto, T. and Matsui, K. (2002) Robustness Investigation of DCT Digital Wa-termark for Printing and Scanning. Trans. IEICE (A), J85-A, 451-459.
[6] Ejima, M. and Miyazaki, A. (1999) Digital Watermark Technique for Hard Copy Image. Trans. IEICE (A), J82-A, 1156-1159.
[7] Horiuchi, Y. and Muneyasu, M. (2004) Information Embedding to the Printing Images Based on DCT. Proceedings of ITC-CSCC2004, 7F3P50-1-4.
[8] Uehira, K. and Suzuki, M. (2008) Digital Watermarking Technique Using Bright-ness-Modulated Light. Proceedings of the IEEE ICME2008, 257-260.
[9] Ishikawa, Y., Uehira, K. and Yanaka, K. (2010) Practical Evaluation of Illumination Watermarking Technique Using Orthogonal Transforms. Journal of Display
Tech-nology, 6, 351-358. https://doi.org/10.1109/JDT.2010.2049336