Applying Bytecode Level Automatic Exploit
Generation to Embedded Systems
October 16, 2015
Matthew Ruffell
[email protected]
Department of Computer Science and Software Engineering
University of Canterbury, Christchurch, New Zealand
Supervisor: Dr DongSeong Kim
Abstract
Finding vulnerabilities in software is a difficult task, typically undertaken by experts. Developers have little of the required knowledge to find complex vulnerabilities in their software products before release. Automation of vulnerability discovery and proof of concept exploit generation is key to enable developers to check and fix software vulnerabilities in the development process. Research in this field is currently directed at automatically generating exploits for software developed for general purpose computers. Em-bedded systems occupy a significant portion of the market and lack typical security features found on gen-eral purpose computers. In this report, we implement automatic exploit generation for embedded systems firmwares, by extending an existing dynamic analysis framework called Avatar. We discuss several tech-niques to discover vulnerabilities and generate exploits, and evaluate our solution by generating exploits for three vulnerable firmwares written for a popular ARM Cortex-M3 microcontroller.
Acknowledgements
I would like to sincerely thank Jonas Zaddach for all his help with debugging complex issues that kept arising in Avatar. You may be on the other side of the world in France, but I greatly appreciated the email exchanges that offered clues into solving undebuggable situations.
I would like to thank DongSeong Kim, for his support through the year as my supervisor, especially as this was an ambitious project which required many whiteboard sessions discussing complex ideas.
Contents
1 Introduction 1
1.1 Motivation . . . 1
1.2 Project Goal and Restrictions . . . 2
1.3 Report Layout . . . 2
2 Background 3 2.1 Stack Buffer Overflow Exploits . . . 3
2.2 Dynamic Taint Analysis . . . 5
2.3 Symbolic Execution . . . 7
3 Related Work 9 3.1 Manual Vulnerability Analysis . . . 9
3.2 Automatic Vulnerability Analysis . . . 9
3.3 Source Based Automatic Exploit Generation . . . 10
3.4 Bytecode Based Automatic Exploit Generation . . . 10
3.5 Avatar Framework . . . 11
4 Design and Implementation 12 4.1 Avatar Framework . . . 12
4.1.1 S2E . . . 14
4.1.1.1 QEMU . . . 14
4.1.1.2 KLEE . . . 15
4.1.2 Architecture and Debugging Features . . . 15
4.2 Key Concepts and Methodology . . . 17
4.3 Implementation . . . 20
4.3.1 Avatar Configuration . . . 20
4.3.2 Natural Device Input Communication . . . 21
4.3.3 Exploit Generation . . . 22
5 Evaluation 23 5.1 Equipment Used . . . 23
5.2 Vulnerable Firmwares . . . 25
5.2.1 Small . . . 26
5.2.2 Medium . . . 27
5.2.3 Large . . . 27
5.3 Exploits Generated . . . 28
6 Discussion 29 6.1 Limitations . . . 29
6.2 Future Work . . . 30
7 Conclusion 31 Bibliography 33 A Appendix 34 A.1 Overview . . . 34
1
Introduction
1.1
Motivation
Finding vulnerabilities in a software system is a complex and difficult task. There is no question about the importance of finding vulnerabilities, as a vulnerability enables malicious actors to hijack program flow and execute their own code. Currently, many developers of software cannot search for vulnerabilities on their own. They must rely on highly specialised security researchers to analyse and produce proof of concept exploits. This is because finding vulnerabilities is a manual process that requires extensive skills and intri-cate knowledge of how software works on a low level. There are two intri-categories of vulnerability research: statically analysing program code, and dynamically executing a program and logging behaviour. Since most users only have access to binary distributions of their programs, the researcher is faced with a situa-tion where they must either statically read and analyse this binary disassembled into assembly language, or use black box techniques such as fuzzing [17] to dynamically execute and probe unknown binaries. This approach does not scale well as programs become larger and more complex, as reading raw assembly code and trying to gain a meaningful understanding of the code to find exploit vectors becomes infeasible. Sim-ilarly for dynamic analysis, no black box testing framework could possibly test all code flows throughout a program. This leads us to the idea of automating vulnerability discovery and automatically generating proof of concept exploits. If it becomes a simple process, then developers can also use these tools to find vulnerabilities, even before the program ships.
1. INTRODUCTION 1.2. PROJECT GOAL AND RESTRICTIONS
1.2
Project Goal and Restrictions
The aim of this project is to extend an existing dynamic analysis framework for embedded systems to implement automatic exploit generation. Ideally there should be limited human interaction in the vulnera-bility discovery and exploit generation process, to make the tool useful to non skilled developers. The tool should be able to analyse firmware bytecode, and should have no need for source code to be present. This ensures that the tool is useful to the widest audience, as most researchers have no direct access to source code of the firmware under analysis. All modifications to the existing framework should be scalable and easily extensible to a wide range of hardware and vulnerability classes.
To manage complexity for this project, we will only consider basic stack buffer overflow vulnerabilities. The firmwares used in evaluation will be small and simple, and the overall goal is to prove that automatic exploit generation is possible for simple firmwares running on a real world device.
1.3
Report Layout
2
Background
This chapter introduces concepts and techniques which are central to the problems we wish to solve and the mechanisms we used to solve them. This chapter provides a foundation of knowledge which is required to grasp future chapters. Namely, we introduce the Stack Buffer Overflow exploit class, Dynamic Taint Analysis and Symbolic Execution.
2.1
Stack Buffer Overflow Exploits
Stack buffer overflows are a class of exploit [28] which occur as a direct result of not checking array bound-aries when copying data. They are the most common vulnerability found in real world software and are also the most straightforward to exploit. Stack buffer overflows operate slightly differently on ARM ar-chitecture, so this section details how they work on an ARM Coretx-M3 microprocessor using the Thumb instruction set.
Memory is typically divided up into four different regions on microprocessors, being text, data, stack and peripherals. The text region stores program code or more specifically, the firmware under considera-tion. The data region contains initialised data such as static variables, and space for uninitialised data, also known as the heap. The peripheral region is used for memory-mapped peripheral devices.
The stack is a continuous block of memory that contains data. A register called the Stack Pointer (SP) points to the top of the stack, and the bottom of the stack is located at a fixed address. ARM architecture allows the stack to either grow upwards, towards higher memory addresses, or downwards, towards lower address. For the purposes of this report, the stack will grow downwards.
The stack is logically organised into stack frames which are pushed to the stack upon a call to a function, and popped from the stack when the function returns [22]. Stack frames contain variables and the return address local to a function. The return address is the value of the Program Counter (PC) at the time the function is called. Typically, parameters are also pushed to the stack frame, but on ARM architecture parameters are passed to functions using registers. Consider the following function:
c h a r * v u l n c p y ( c h a r * i n p u t ) { c h a r b u f f e r [ 2 0 ] ;
s t r c p y ( buffer , i n p u t ); r e t u r n b u f f e r ;
}
By compiling to assembly code, low level stack operations are visible:
0 0 0 0 0 bb8 < vulncpy >:
bb8 : b 5 0 0 p u s h { lr } ; P u s h old PC to s t a c k bba : 4 6 0 1 mov r1 , r0 ; M o v e i n p u t f r o m r0 to r1 bbc : f 1 a d 0 d14 sub . w sp , sp , #20 ; A l l o c a t e b u f f e r on s t a c k
bc0 : 4 6 6 8 mov r0 , sp ; Set r0 to b u f f e r
bc2 : f 0 0 0 f 8 2 7 bl c14 < strcpy > ; C a l l strcpy , r0 dest , r1 s o u r c e bc6 : 4 6 6 8 mov r0 , sp ; r0 h o l d s r e t u r n data , b u f f e r bc8 : b 0 0 5 add sp , #20 ; De - a l l o c a t e b u f f e r
2. BACKGROUND 2.1. STACK BUFFER OVERFLOW EXPLOITS
The first action a function must take is to push the value of the previous program counter to the stack frame. This is to ensure that control can be restored to the correct address after the function finishes. Since thePCis already set to the functions address, namely0xbb8, the value of the Link Register (LR) is used, as it contains the value of the program counter before the function call. This is unique to ARM, as Intel traditionally pushes thePCto the stack frame before loading the function address into thePC.
Thebuffer variable is allocated at line0xbbc, by subtracting 20 bytes from the current SP. Note that allocations must be word aligned. The Cortex-M3 is a 32 bit processor, which means that words must be allocated in 4 byte sections. Since 20 bytes is simply 5 words, there is no need to allocate additional bytes. After this operation the stack frame looks like the following:
top of s t a c k < v u l n c p y () f r a m e > < m a i n () f r a m e > b o t t o m of b u f f e r ret p r e v i o u s s t a c k f r a m e s s t a c k
< - - - [ ] [ ] [ ]
If the parameterinput is less than 20 bytes thenstrcpy()will successfully copy data into the newly createdbuffer. Afterwards theSPwill be increased by 20 bytes to effectively deallocatebuffer, and the function will terminate by popping the return address into thePC.
Stack buffer overflows occur when more data is copied to a buffer than was previously allocated, and the value of the return address is overwritten with attacker controlled code [22]. Consider the case where theinputparameter is a character array which is 25 bytes long. Strcpy()will copy data until it reaches a null byte in theinputarray, which will leave the stack in the following state:
top of s t a c k < v u l n c p y () f r a m e > < m a i n () f r a m e > b o t t o m of b u f f e r ret p r e v i o u s s t a c k f r a m e s s t a c k < - - - [ A A A A A A A A A A ] [ AA ] [ A ]
20 bytes will be copied intobuffer, with 4 bytes overwriting the return address. Additionally, 1 byte will be copied into the previous stack frame. When the function returns, the overwritten return address will be copied into thePCand that address executed as the next instruction. By overwriting the return address, an attacker effectively gains control of execution, also known as a control flow hijack [28]. Arbitrary ex-ecution can be gained by filling theinputarray with malicious machine code and overwriting the return address with the address of the start of thebufferarray. When the function returns, control will be passed to the start of thebuffer, and the malicious code executed [22].
This attack can be mitigated by using techniques such as Address Space Layout Randomisation (ASLR) [28] or Data Execution Protection (DEP / W⊕E) [28]. ASLR randomises the fixed stack address, which makes guessing thebufferaddress impossible, preventing the attacker from directing control to malicious code. DEP marks specific sections of memory as writeable or executable, but never both. This prevents attackers from being able to execute their shellcode after writing it. Unfortunately these techniques require an underlying operating system, as well as additional processor features, like a Memory Management Unit (MMU) [15]. Because of this, the majority of embedded systems use the same addresses for the fixed stack address, which means every time the firmware runs, the address layouts will be exactly the same. This has a side effect that the buffer in the example will always be allocated at the same address, which makes crafting shellcode simple. There are some proposed mitigations [15] that cater to the requirements of embedded systems, but these have not landed in real world toolchains.
2. BACKGROUND 2.2. DYNAMIC TAINT ANALYSIS
2.2
Dynamic Taint Analysis
The idea behind dynamic taint analysis is to monitor the flow of input through an application and assign quantitative taint values to variables depending on their source and operations applied throughout execu-tion. Depending on when taint values are observed, it is possible to decide how much influence an attacker has over certain variables.
For programs to be useful, they need to read and process input. Taint is introduced from inputs that can potentially hamper attacker controlled data, such as a network connection that is exposed to the world. Variables which hold data from taint sources are consideredtainted[26]. Not all input sources should be considered tainted however, as a trusted configuration file on disk would not introduce taint into the system. In this case, variables which hold clean data are considereduntainted[26]. Immediately two problems can arise. If a dynamic taint analysis system marks a variable as tainted when it was not obtained from a taint source, the variable isovertainted[26]. Similarly, if the variable is obtained from a taint source and is not marked as tainted, then the variable isundertainted[26]. Ensuring that variables are marked correctly is important. In attack detection scenarios, an overtainted variable may raise a false positive that data is influ-enced by an attacker when it really is not, and similarly an undertainted variable could potentially harbour malicious code and be a false negative.
Depending on the implementation, taint can either be binary (tainted or untainted), or quantitative. In quantitative implementations, different levels of taint can be assigned to variables derived from different taint sources. For example, data which has passed simple sanity checks and type checking would have a lower taint value than data that was stored unprocessed. Typically, most implementations will treat taint as binary for ease of implementing automatic taint analysis systems and for better runtime performance.
Taint can be propagated through the program by interaction between variables. Different operations can in-fluence taint levels differently. There are generally three types of operations: data movement instructions, data manipulation instructions and control flow instructions [21]. Data movement instructions include variable assignment, pushing and popping values from the stack and setting memory. Data manipulation instructions are typical arithmetic instructions such as addition, subtraction, exclusive or and multiplica-tion. Control flow instructions generally change the flow of the program, such asif-then,switch,while
andgoto. A taintpolicy[21, 26] determines how taint is propagated throughout the program, and differs by implementation. Taint policies are typically applied to assembly instructions, since application binaries are typically processed by taint analysis programs. A standard taint policy is the following:
Operation Type Examples Taint Decision
Data movement MOV, PUSH, POP, STR, LDR
Destination data will be tainted if any of the source data is tainted.
Data manipulation ADD, SUB, MUL, DIV, XOR
Resulting data will be tainted if any of the operand data is tainted.
Control flow JMP, B, BL, CMP No taint is propagated. Note: condition registers may be tainted by operations,
but data itself is not changed.
Table 2.1: A typical binary taint policy
2. BACKGROUND 2.2. DYNAMIC TAINT ANALYSIS
1 A = 5;
2 B = i n p u t ();
3 A = A + B ;
4 g o t o A ;
Figure 2.1: A simple program to demonstrate taint propagation
Taint propagation can be demonstrated by applying the taint policy from Table 2.1 to the program snippet from Figure 2.1. The program snippet contains all three operation types, and shows an example of a previously untainted static variable becoming tainted through an interaction with a tainted value. See Table 2.2 for a complete explanation.
Line Statement Operation Type Taint Decision
1 A = 5 Data movement Variable A is untainted, as static assignment has no taint source 2 B = input() Data movement Variable B is tainted, as input is a known taint source 3 A = A + B Data manipulation Variable A becomes tainted due to operation with tainted variable 4 goto A Control flow No taint introduced, however control is handed to tainted address
Table 2.2: Applying dynamic taint analysis to Figure 2.1
There are two main scenarios where dynamic taint analysis is useful. One is where a program under test can be instrumented and executed to completion, and a log produced detailing which variables are tainted and could be influenced by attacker provided data. This allows developers to easily find and fix variables that may have inadvertently shared operations with tainted data, when they should not have. The second is to implement an alarm which activates when a control flow instruction jumps to a tainted address [21]. Ap-plying this to the previous section, stack buffer overflows can be detected by dynamic taint analysis. Since an attacker controlled input array is copied into the local buffer which consequently overflows overwriting the return address, both the buffer and return address will be marked as tainted. When the function finishes and the return address popped into the program counter, the alarm will sound as a control flow instruction has jumped to a tainted and attacker influenced address. From there, the program could be halted or termi-nated since integrity is no longer assured.
There are downsides to using dynamic taint analysis exclusively. For one, it can only detect that a stack buffer overflow or similar exploit may have occurred when a control flow instruction jumps to a tainted address. The program may have been exploited previously at the start of the function [26], which could have enabled malicious actions to take place in the function body before the return address is popped. This happens because no alarm is raised when the return address is first overwritten, only when it is used to control program flow. Dynamic taint analysis is best used in conjunction with other techniques, such as symbolic execution.
2. BACKGROUND 2.3. SYMBOLIC EXECUTION
2.3
Symbolic Execution
Symbolic execution is a dynamic process to explore all paths throughout a given program. Symbolic inter-preters reduce a particular program path to a logical formula [26] which can be solved to find what inputs are required to satisfy the given path. Symbolic execution is not a new concept, as it was well explained in 1976 [19], however applications in the field of vulnerability detection and exploit generation have only become popular in the last five years.
A symbolic execution system is comprised upon a symbolic executionengineand a symbolicinterpreter. The symbolic execution engine keeps track of symbolic interpreters and maintains a tree like structure of paths interpreters have explored. This interpreter can execute a unmodified program in source or binary form, depending upon the implementation. A symbolic interpreter can mark sections of memory and vari-ables assymbolic[26]. Instead of variables having aconcrete[26] value, that is, having a specific value, like number = 5; a symbol is assigned to the variable instead. This enables the interpreter to construct a logical formula of execution for a given program path. At any time the symbolic interpreter can be halted, and a Satisfiability Modulo Theories (SMT) [13] solver can be queried to construct appropriate concrete values for symbolic variables. This effectively outputs the required inputs to place the program into that particular state. If we decide to halt execution upon an unsafe memory access, we can automatically gather inputs that place the program into a vulnerable state. This idea is critical to automatic exploit generation.
Symbolic execution explores all program paths by forking symbolic interpreters at each control flow struc-ture in the program [26]. By forking the symbolic interpreter process, each symbolic interpreter can main-tain their own state information for the particular path that they are exploring, while still sharing common symbols with other interpreters that were on the same path until the branch point. It may help to visualise by thinking of the tree maintained by the symbolic execution engine. The root node is the original inter-preter. At each control flow structure in the program, one or n interpreters are forked, and each node can be considered the fork point. The leaves in the tree would become the current interpreters. A common forking strategy for basic high level control flow structures are summarised in Table 2.3.
Control Flow Structure Forking Decision
if-then Fork one extra interpreter. One takes the true path, the other takes the false path
for / while Fork an interpreter for each loop iteration
[image:10.612.74.347.606.728.2]switch Fork n-1 interpreters, each interpreter takes one branch
Table 2.3: Symbolic execution interpreter forking strategies
Typically, the further through program execution a particular interpreter reaches, the tighter the conditions the logical formula of execution place upon the symbols in that path. This is because each successive con-trol flow statement typically introduces restrictions for a particular variable per path. For example, anif
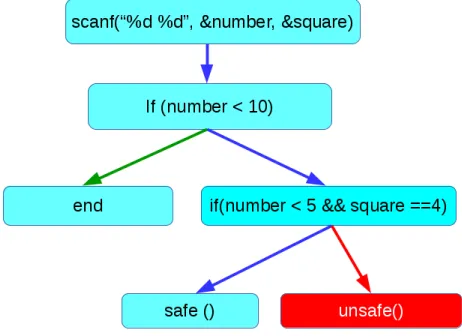
statement typically checks for equality or a less than greater than relationship. This additional check places additional constraints that a variable must satisfy for access to a given path. Consider the following:
1 int m a i n ( v o i d ) {
2 int number , s q u a r e ;
3 s c a n f ("% d % d " , & number , & s q u a r e );
4 if ( n u m b e r < 10) {
5 if ( n u m b e r < 5 && s q u a r e == 4) {
6 s a f e ();
7 } e l s e {
8 u n s a f e ();
9 }
10 }
2. BACKGROUND 2.3. SYMBOLIC EXECUTION
Figure 2.2: Trace of program execution with interpreters highlighted as different arrow colours
A single symbolic interpreter begins at line 2. On line 3,numberandsquareare assigned symbols e.g.,
α, β since they are user provided data. Line 4 is a control flow structure, and has two possible paths. An interpreter is forked, and one takes the true path, with a constraint thatα <10, and the other takes the false path, withα≥10. The interpreter taking the false path reaches the end, and terminates. The
true path interpreter reaches another control flow structure on line 5, and forks another interpreter. One takes the true path with a additional constraint thatα<5, andβ=4. The other takes the false path, with
additional constraints thatα≥5 andβ6=4. During the execution of this program, a total of 3 symbolic
interpreters were active, meaning that this program contains 3 possible paths. If a SMT solver is queried to generate concrete values for the third interpreter, i.e., the path that contains an unsafe memory access, it would find a value fornumberthat is less than 10, but greater than or equal to 5, and assignsquarea value which is not 4. These could be used as inputs on the next run of the program to place it in a vulnerable state.
Symbolic execution can rapidly attain state space explosion [26] due to the amount of interpreters that are forked upon control flow structures. Nestedwhileor forloops have the potential to quickly fork an exponential number of symbolic interpreters which quickly exhaust computing resources, particularly RAM. The symbolic execution engine can manage this issue by choosing different path selection strategies depending on resource usage or configuration. Three common path selection strategies are Depth First Search (DFS), Randomised and Concolic Testing [26]. DFS applies the standard DFS algorithm to the state tree managed by the symbolic execution engine. It is not usually used in practice because it can get stuck in non terminating loops, especially if a maximum depth is not specified. This causes other branches to not be explored resulting in poor code coverage. Randomised selects a leaf node from the state tree at random and continues execution of that interpreter, and halts the execution of others. Since the engine traverses the tree from the root node to select leaves, there is a bias towards shallow leaves, which means that execution may not get deep enough for satisfactory program analysis.
3
Related Work
This chapter presents a comprehensive survey of previous work undertaken in the field of vulnerability analysis and exploit generation. There are four main topics of interest: manual vulnerability analysis, automatic vulnerability analysis, source based exploit generation and bytecode based automatic exploit generation.
3.1
Manual Vulnerability Analysis
Manual vulnerability analysis is where a researcher manually disassembles and finds vulnerabilities in firmware binaries using traditional vulnerability discovery methods. Analysing even simple firmwares is time consuming and manual analysis is not easily scalable.
Cuiet al.[11] disassembled firmware binaries for the HP LaserJet printer line, and performed a firmware modification attack which implemented a rootkit that allowed them to remotely command and control printers and undertake data exfiltration from the host network. Through reverse engineering Cuiet al. dis-covered how to bypass quick sanity checks on software update implementations, which allowed them to install their modified firmware to the printer under attack. Since their firmware modifications was manu-ally implemented from manumanu-ally found attack vectors, it would take considerable effort to reproduce their research on a rival printing platform. Further, the techniques they used to discover vulnerabilities would be too complex for many developers to understand, meaning their research is only useful for experts in vulnerability research.
Weinmann [30] disassembled and manually reverse engineered several baseband processors from popu-lar mobile phones. Weinmann used tools such as bindiff to find signatures of common C library functions across different firmwares, and then used traditional vulnerability discovery mechanisms to locate and con-struct simple stack buffer overflow exploits. Testing was performed by sending crafted baseband messages from a local transceiver station, while the target device was being locally debugged. This research has the same flaws as Cuiet al., as manually searching for vulnerabilities is time consuming, difficult to reproduce and not accessible to anyone other than expert vulnerability researchers.
3.2
Automatic Vulnerability Analysis
Automatic vulnerability analysis is where researchers can provide firmware as an input to a program which can then automatically discover vulnerabilities without much effort expended by the researcher. Desirable features include scalability and output pinpointing the location of the discovered vulnerability.
3. RELATED WORK 3.3. SOURCE BASED AUTOMATIC EXPLOIT GENERATION
Mulliner et al. [20] implemented a tool which automatically fuzzed various mobile phones by sending randomly crafted SMS messages. The tool used a local transceiver station to send randomly crafted mes-sages to the mobile phone until the phone crashed, at which stage the message was recorded for future analysis. This experiment can easily be replicated by normal developers provided the tool, and can catch many random bugs easily and cheaply. However, vulnerability detection is not intelligent, and is limited to detecting simple faults which happen to crash the device. An intelligent fuzzing tool, TaintScope, has been built by Wanget al. [29], which bolsters fuzzing with dynamic taint analysis and symbolic execution to target fuzzing towards attacker controlled input. It enables more intelligent data mutation strategies to find vulnerabilities more efficiently, which resulted in finding 27 unknown vulnerabilities in popular real world software.
Davidsonet al. [12] implemented FIE, a tool that uses symbolic execution to verify memory safety for the MSP430 microcontroller. The tool was tested by scraping Github for projects that target the MSP430, and 21 bugs were found in 99 different programs. Symbolic execution is becoming popular a mechanism to verify memory safety, as researchers from Intel [4] have also started analysing their firmware for their processors with S2E [9]. Their goal is to build a tool which allows them to analyse and generate testcases for their most complex firmwares.
3.3
Source Based Automatic Exploit Generation
Source based automatic exploit generation tools can generate exploits with full knowledge of source code. Exploits generated are typically not very reliable as exploits may behave differently when applied to pro-gram binaries which are compiled and optimised by different compilers.
Avgerinoset al.[1] implemented AEG, the first end-to-end system for automatic exploit generation. AEG functions by first performing static analysis over the source code to gain information about the program. The program is then compiled to bytecode using GCC. Information gleaned from static analysis is used forpreconditionedsymbolic execution, which only explores paths that satisfy the precondition, and prunes paths that do not. Preconditions can be arbitrary, such as a known length of input processed, or a prefix ex-pression, such as HTTP GET. Typically, preconditions are selected for characteristics common to existing vulnerabilities, since it increases the likelihood that such a vulnerability will be discovered by symbolic execution. If a vulnerable state is found, then concrete inputs are generated by an SMT solver to place the program into a vulnerable state. The program is then dynamically ran using the concrete inputs, and information about stack and return addresses collected. These are then used to build shellcode, which along with the concrete inputs, create a functioning exploit. AEG supports two classes of vulnerabilities: stack buffer overflows (stack smashing, arc injection) and format string (stack smashing, arc injection). AEG generated 16 control flow hijack exploits for 14 popular open source projects, proving that automatic exploit generation for general purpose computers is indeed possible.
3.4
Bytecode Based Automatic Exploit Generation
Bytecode based automatic exploit generation tools can generate exploits from analysing binary program distributions. Exploits are typically reliable since they are generated specifically for the program binary, but may not necessarily evade memory protection techniques of host operating systems. All automatic exploit generation tools surveyed below target general purpose computers, as none have been created for embedded systems.
3. RELATED WORK 3.5. AVATAR FRAMEWORK
Schwartzet al. [27] built Q, a tool which can automatically build ROP [24] exploits for a given program binary. Dynamic taint analysis is performed in conjunction with symbolic execution to find vulnerable pro-gram states. If the vulnerability can be exploited by ROP, thengadgets[24] are located in the binary and a payload generated. What is impressive about Q, is that it contains a robust ROP compiler which can build missing gadget types out of other available gadgets. Q can also perform exploit hardening, which given an exploit which fails due to memory protection measures, such as ASLR or DEP, Q can output an exploit which evades those mitigations. A similar framework, Crax, by Huanget al. [18] uses program crash traces as input. Crash traces can be found from typical static or dynamic analysis tools such as fuzzers, or from normal use. Crash traces are then used as execution traces for concolic symbolic execution within the S2E [9] framework, and if the crash condition is exploitable, a exploit is produced. Crax also offers exploit hardening, and can mitigate the same memory protections as Q.
Chaet al. [8] developed Mayhem, a tool which automatically generates exploits for a given binary pro-gram, with no additional information required. Mayhem uses preconditioned symbolic execution operating in a hybrid execution mode, with a server running standard symbolic execution, and a client running con-colic symbolic execution. The client first starts executing the binary concretely and performs dynamic taint analysis. If a tainted input is used for control flow, then this is reported to the server. The server then Just-In-Time (JIT) compiles the program to an intermediate language and performs symbolic execution, using information gained from dynamic taint analysis. The server keeps track of the path formula, and also maintains an exploitability formula. The exploitability formula determines if an attacker can control the instruction pointer and execute a payload. At every tainted control flow instruction, the server queries the SMT solver to solve both the path and exploitability formula. By solving the path formula, states can be pruned intelligently avoiding state space explosion, and the exploitability formula determines if an exploit can be constructed. Mayhem was run over all binaries in the Debian Linux distribution, and over 13,000 bugs were found and 150 exploits generated [2].
3.5
Avatar Framework
Zaddachet al. [31] developed the Avatar framework to orchestrate dynamic analysis of firmware on em-bedded systems. Avatar solves the problem of emem-bedded systems having little memory and specialised peripheral devices by performing dynamic analysis inside of S2E [9] on the host computer, and forwarding all hardware requests to the target device for completion. The emulator QEMU [5], was extended to emu-late ARM processors, and utilises KLEE [7], a symbolic execution engine, to perform symbolic execution over the firmware being emulated. Several devices were evaluated to test the flexibility of the framework, by performing dynamic analysis of a cellular baseband processor, a hard disk controller and a wireless sensor node.
4
Design and Implementation
This chapter explains features implemented by the Avatar framework in detail, as its design and func-tionality significantly contribute to the overall of design of this research project. Key concepts behind the implementation of automatic exploit generation for embedded systems will be explained, as well as specific implementation details.4.1
Avatar Framework
Avatar [31] is an event driven dynamic analysis framework, designed to ease the task of performing com-plex dynamic analysis on embedded systems. Avatar uses an emulator running on a host computer in conjunction with a physical target device to solve issues such as the impracticality of performing symbolic execution on the target devices tightly constrained hardware. Avatar is designed to be modular and uses a plugin-like structure, meaning that different emulators and debuggers can easily be supported by writing simple wrappers. Additional extensions are also simple to implement as a plugin, which will get called upon a specific event. Avatar comes with concrete implementations of a wrapper for the S2E [9] emulator, and the popular OpenOCD target debugger, as well all the core functionality explained below.
On a high level, Avatar is responsible for executing the firmware under test inside an emulator and on the target device, always keeping the two in sync. If the emulator requests to read a memory location which does not exist inside the emulator, such as a peripheral device for memory-mapped IO, Avatar will forward the request to the target device. If the target device receives an input or interrupt, such as an ac-tion caused by environmental factors, this request needs to be forwarded to the emulator. These acac-tions allow the emulator to accurately represent the physical device without needing to implement or simulate specialised peripherals. Immediately, this raises questions about what device is the master, and what is the slave. The authors describe two usage scenarios, known as full-seperation mode and context switching.
4. DESIGN AND IMPLEMENTATION 4.1. AVATAR FRAMEWORK
Context switching[31] allows the researcher to begin execution of the firmware on the target device. The target device natively executes the firmware without any overheads incurred by communicating with Avatar, which is essential if the firmware contains time critical regions for peripheral initialisation, or other actions which must be performed in real time. Typically, the firmware is set to execute until a breakpoint is reached, near an interesting segment of code which the researcher wishes to more closely analyse. This also allows the researcher to quickly reach code segments of interest, without having to emulate the firmware from the absolute beginning. When a breakpoint is reached, execution is halted on the target device, and a con-text switch is performed. The entire state of the device (memory and registers) is then transferred to the emulator, which then resumes execution from where the device halted. Context switching can take place multiple times, as the researcher may need to view several iterations of the code segment of interest with values fetched via time critical operations. When this occurs, the emulator is halted, and any state that the emulator possess which was not kept in sync with the device (such as memory and registers) are copied to the target device. Execution then resumes from where the emulator was halted.
Avatar supports both software and hardware interrupts. Software interrupts are easy to handle, since the emulator is aware of their existence and executes their handlers immediately. Hardware interrupts how-ever, are raised by specific peripherals to indicate that a task has been completed, or an event has occurred. These need to be trapped in the target device and then forwarded to the emulator by Avatar. Normally, interrupts are a convenient signalling mechanism that informs the firmware that say, a message has been received over UART. In this case, it is a good idea to forward the interrupt to the emulator. However, there are some interrupts that can become a nuisance during emulation, such as the periodic interrupt generated by the system clock. These periodic interrupts can easily exhaust the bandwidth over the USB debugging channel to Avatar if the frequency is high enough. They can also cause actions to happen prematurely, as the frequency they are generated at is not necessarily the speed that the emulator is executing instructions at. In this case, these interrupts need to be suppressed. Avatar provides built in provisions to drop clock interrupts on the device, and instead generate them inside of the emulator. However, it can be hard to distinguish between many periodic interrupts, as ARM only specifies that an interrupt has occurred. This causes most ARM microprocessors to include a hardware multiplexer which queries all devices to find which device generated the interrupt. This is implemented on a Nested Vector Interrupt Controller (NVIC) on the particular ARM Cortex-M3 processor used in this research project, and to suppress interrupts, the code controlling the NVIC would have to be manually disassembled to identify the correct interrupt raised. To reduce complexity in this research project, interrupts of any kind was not implemented in firmwares used in evaluation for this very reason.
4. DESIGN AND IMPLEMENTATION 4.1. AVATAR FRAMEWORK
4.1.1 S2E
Avatar provides a concrete wrapper implementation to use the Selective Symbolic Execution (S2E) [9] framework as the emulator. S2E is a very flexible framework that supports emulating applications and firmwares in QEMU, while performing symbolic execution with KLEE concurrently. S2E is extensible to support different architectures and features by means of a plugin interface. Zaddachet al.extended S2E to implement support for the ARM architecture, and to interface the QEMU emulator with the necessary op-erations required to remotely access memory on the target device. While S2E is an interesting framework in itself, this section will keep to details relevant to the Avatar framework.
S2E refines symbolic execution by selectively choosing paths to explore. In practice, this is achieved by restricting symbolic execution to specific code segments, and only allowing specific data types to be marked as symbolic [9]. This speeds symbolic execution as only areas which are interesting to the re-searcher are executed symbolically, as there is no longer any need to explore every single state a firmware can achieve. Further, interesting code segments typically align with areas that the researcher has selected to be executed inside the emulator, meaning that symbolic execution can be readily applied with minimal extra effort.
Typically, symbolic execution marks input sources or tainted data as symbolic, but due to how the S2E framework is constructed, the researcher must manually mark variables as symbolic. Normally this is achieved by either modifying the firmware or writing configurations that mark variables as symbolic. Mod-ifying firmware is a poor solution as the additional instructions may make the firmware behave differently, ruining the integrity the firmware. Avatar enables researchers to writeAnnotationsin Lua which specify what regions symbolic execution should take place in, and at what instructions custom Lua callback func-tions should be called. The custom callback funcfunc-tions allow the researcher to mark specific memory or registers as symbolic using a high level programming language, which allows complex logic to be easily specified in functions. By writing annotations, the firmware does not need to be modified, ensuring in-tegrity of the firmware under test.
Zaddachet al. wrote a plugin for S2E to detect arbitrary execution vulnerabilities called ArbitaryExec-tuion. It works similarly to previously explained methods of detecting arbitrary execution with dynamic taint analysis. An alarm is raised when either a symbolic variable is used for the destination of a load or store instruction, or if the program counter or stack pointer is set to a symbolic variable. At this stage, ex-ecution of that state is halted, and a SMT solver is queried to find concrete values for variables that satisfy this vulnerable path. These are then printed to the console.
4.1.1.1 QEMU
QEMU [5] is a machine emulator which implements support for many architectures, such as ARM, X86, MIPS and SPARC. It provides full emulation of unmodified firmwares or operating systems inside of a virtual machine environment. Avatar uses QEMU inside of S2E to emulate a specific ARM processor that resides in the target device.
4. DESIGN AND IMPLEMENTATION 4.1. AVATAR FRAMEWORK
4.1.1.2 KLEE
KLEE [7] is a symbolic execution engine that was initially designed to generate high coverage test cases for source code. Due to its flexibility and open source nature, KLEE has been used in many projects, and forms a core component in S2E. Avatar only communicates with KLEE to set symbolic execution regions, and register Lua callback functions. Moreover, Avatar has no other knowledge of the symbolic execution engine, making KLEE largely self contained within S2E.
KLEE monitors and maintains a tree structure which keeps track all symbolic interpreters and their forking points. Symbolic interpreters maintain their own states, in a form of a register file, stack, heap, program counter and path conditions. Path conditions are the logical formula constructed from control flow struc-ture branch conditions which can be solved with a SMT solver. KLEE queries STP [16] as the SMT solver since STP offers a precise bit level resolution and has fast algorithms for the decision procedure.
KLEE traditionally operates by first compiling program source code to LLVM bytecode, and then per-forming symbolic execution over that bytecode. However, due to the applications that Avatar is used for, source code is not typically available, and the firmware is almost always compiled to machine code for the target device. To solve this issue, KLEE translates the current TCG instructions that are being executed in QEMU to LLVM instructions, when can then be symbolically executed like normal. Translation from TCG to LLVM instructions only take place when symbolic execution is active to improve system performance.
If at any stage a symbolic variable would be written to a memory address on the target device, Avatar forces KLEE to produce a concrete variable through the remote memory interface. This is to make sure that symbolic variables stay within the emulator, and that only concrete variables reach the actual hard-ware. Of course, there is a slight performance impact by having to halt execution for that interpreter and query the SMT solver to find an appropriate value that satisfies the path condition formula. This is a slight inconvenience, but nothing problematic enough to warrant the further issues that would arise if the physical hardware had to be able to store symbolic values.
[image:18.612.97.514.471.602.2]4.1.2 Architecture and Debugging Features
Figure 4.1: An overview of the Avatar architecture and how all components communicate [31]
4. DESIGN AND IMPLEMENTATION 4.1. AVATAR FRAMEWORK
Avatar consists of a series of Python scripts to implement the frameworks features, and to communicate between components. Each of the scripts take advantage of a globally available logger, which documents any interesting conditions that may arise, such as the emulator failing to start, or a connection being re-jected. This logger is available to custom extensions of Avatar modules, which ensures that all debugging information is available in one output stream. Since most protocols Avatar needs to communicate with are plaintext, simple sockets or telnet connections are used, which greatly reduces the complexity of debugging protocol issues.
The emulator is responsible for execution of the firmware inside of the virtual machine, symbolic exe-cution over selected regions of code and forwarding memory access requests to Avatar. All of these actions require communication to Avatar for co-ordination.
Firstly, Avatar can control execution of the virtual machine through a GDB server supplied by QEMU. The GDB server utilises the universal GDB serial protocol, which can set breakpoints, fetch values from registers and examine memory. This channel becomes especially useful when S2E is not behaving as ex-pected. S2E can be started manually without the Avatar framework, and the researcher can connect to QEMU directly through the GDB server. From there the researcher can set a breakpoint near a suspected failure point and single step through execution to uncover the problem. Additionally, QEMU also logs ARM / Thumb instructions that it splits during the translation process to tiny code generator instructions. This logfile is essential to review if there is any doubt that QEMU is decoding ARM instructions incor-rectly1.
Avatar communicates to KLEE during runtime through configuration files written in the Lua scripting lan-guage. Configurations include the previously discussed symbolic execution regions and annotation callback functions. These configuration files are passed to KLEE through QEMU, using the QEMU Management Protocol (QMP). QMP is a JSON based request protocol that can be easily packet sniffed to ensure that the KLEE configurations are being received and delivered correctly. KLEE also logs information about symbolic interpreters, such as what instruction each interpreter forked on, and what conditions were added to the path formula.
Each time S2E accesses a memory address, a S2E plugin called RemoteMemory catches the request, and forwards it onto Avatar through a JSON protocol. Avatar then decides to forward the access to the target device or not. All RemoteMemory requests and responses are logged to a file, which can then be replayed at a later date. This effectively enables the researcher to quickly analyse a firmware without the physical target device being present, as previous values can be replayed instead.
Avatar communicates with target devices through an appropriate debugging channel. Typically, this would be through the popular Open On-Chip Debugger (OpenOCD) [25] which can debug embedded systems through USB debugging interfaces, or JTAG. OpenOCD exposes a client interface through Telnet, which Avatar connects and sends commands to.
The Avatar configuration file allows the researcher to place print statements in between calls to the Avatar framework, or other custom memory operations that need to take place (like moving states between em-ulator and device). This may be a basic feature, but it comes in handy when calls take a long time to complete and block the main thread. Examples are when Avatar is waiting for a breakpoint to be reached, or a significant memory copy is taking place over a low bandwidth connection. Plugins can also be loaded into S2E from the configuration file to trace execution paths taken by QEMU.
1Authors note: I spent several months debugging to find that Thumb instructions are decoded differently than ARM instructions,
4. DESIGN AND IMPLEMENTATION 4.2. KEY CONCEPTS AND METHODOLOGY
4.2
Key Concepts and Methodology
To make automatic exploit generation on embedded systems possible, all the previously discussed tech-niques, technologies and frameworks must be harnessed in such a way that cooperation is achieved between all components. This section explains the overall methodology that is followed through the implementation of automatic exploit generation, in respect to all the techniques utilised.
The researcher first needs to obtain a copy of the firmware under analysis. This can be achieved in two possible ways, with the conventional methods being extracting firmware from the physical device, or down-loading a copy of the firmware. Extracting the firmware directly from the physical device is useful since the firmware under analysis will always be the exact version that is running on the device, meaning no unexpected issues can arise. Extracting firmware can be achieved by connecting to the target device with a debugger, such as OpenOCD, and dumping the contents of the code flash region to a file. Downloading firmware from the internet is also a viable option. Typically, firmware is distributed in packed update files, which must be extracted to yield the firmware bytecode. This must then be flashed to the target device to ensure that during analysis, the emulator and target device are both running the same code. Of course, both methods assume that the developer is working with a target device which has not had debugging function-ality permanently disabled. This is a common protection applied to consumer hardware to prevent misuse and to protect intellectual property. For a researcher or developer working in a legitimate environment, this will never be a problem.
Next, the firmware must be disassembled from machine code into assembly, using a tool like objdump. This is necessary as Avatar will be utilising context switching functionality, to enable the target device to execute the firmware natively, to complete all hardware initialisation procedures before control is handed over to the emulator. Once the firmware has been disassembled, an instruction address needs to be selected for the breakpoint to be placed after all hardware initialisation has completed. Generally, all hardware initialisation is completed in the first few function calls of the main procedure, and it should be clear when they have all been completed.
Avatar can then be initialised, starting an emulator for the specific processor model under analysis. The previously obtained firmware file is then loaded to the correct memory range in the emulated processor. A connection to the target device is then created using OpenOCD, and the target halted. The firmware should be reflashed to the device on each analysis attempt, to ensure integrity of the firmware under test. After reflashing has been completed, a breakpoint is set to the previously identified address which marks the completion of all hardware initialisation. The target device is then resumed, and can execute until the breakpoint is reached.
At this stage all hardware initialisation has been completed on the target device, avoiding any issues of critical timing or hardware polling loops which would have been inconvenient to complete on the emu-lator. It is time for the context switch to the emuemu-lator. The entire state of the target device needs to be copied to the emulator through the debugging channel. All memory addresses which address to RAM need to be copied, and every register needs to be transferred. Note that memory is typically transferred one word at a time, which can make this operation time consuming for microprocessors with a large amount of addressable RAM. This is due to Avatar querying OpenOCD for the contents of each memory address individually, and then forwarding each result to QEMU separately through a GDB server. A more elegant solution which can copy larger chunks of memory at a time and reduce the number of packets transmitted should be investigated for future projects.
4. DESIGN AND IMPLEMENTATION 4.2. KEY CONCEPTS AND METHODOLOGY
[image:21.612.115.490.201.680.2]While all of has been happening, QEMU has been translating all ARM / Thumb instructions to TCG instructions and executing them. When the program counter reaches a region marked for symbolic exe-cution, S2E invokes KLEE. KLEE then takes the current TCG instructions and translates them to LLVM instructions. From there, the symbolic execution engine will call Lua callback functions to mark specific memory variables as symbolic. KLEE then spawns a symbolic interpreter, and symbolic execution takes place over the firmware.
4. DESIGN AND IMPLEMENTATION 4.2. KEY CONCEPTS AND METHODOLOGY
As the symbolic interpreters execute the firmware and fork more interpreters upon control flow conditions, each interpreter is building a logical formula of path conditions. Each interpreter is looking for arbitrary execution conditions, as defined by the ArbitaryExecution S2E plugin. The most common condition will be when a symbolic variable is copied into the program counter on termination of a function. In this scenario, the interpreter is halted and the STP SMT solver is queried to find concrete values for symbolic variables that satisfy the path formula. These values are effectively the inputs required to place the firmware into a vulnerable state. These concrete values are then written to logfiles and output in the console.
Of course, arbitrary execution conditions may not be found on the first round of symbolic execution, if many interesting memory regions are identified. In this case, KLEE will terminate all symbolic states when the symbolic marked memory region is exited, and will stop translating TCG instructions to LLVM. Execution continues normally in QEMU, and control can return again to KLEE when the program counter enters the next symbolic memory region.
Eventually, the end of the firmware will be reached. If the firmware utilises an infinite main loop, a Lua callback function will need to be set on the final jump instruction to terminate QEMU and KLEE. At this stage, all firmware analysis is complete. The emulator is shutdown and the target device is halted. Any breakpoints that still remain on the target device need to be removed. This marks the end of Zaddachet al.
Avatar framework, and the beginning of the extensions to Avatar, which are the real contributions of this research project.
To be able to successfully exploit the target device, there needs to be a communication mechanism with which the exploit can be delivered to the target device from Avatar. Since embedded systems can accept input from a variety of sources, this mechanism needs to present a generic interface that can be extended to suit any specific input method. This research project introduces the Communicator class, which presents a generic interface for channel initialisation, connection and disconnection, and reading and writing of data. The researcher can then simply extend the Communicator class and implement a specific communication interface for the channel used in their target device.
Next is the task of generating an exploit for the firmware. There are many classes of exploit that can be automatically generated, so much like the Communicator class, this research project introduces the Ex-ploitGenerator class. The ExEx-ploitGenerator class presents a generic interface which can be extended to suit any exploitation technique. ExploitGenerator treats exploits as the concatenation of two elements: the inputs necessary to place the device in a vulnerable state, and the shellcode to be executed. The researcher can simply extend ExploitGenerator to construct input information from concrete path information gath-ered from the ArbitaryExection plugin, and specify how shellcode is generated or load generic shellcode from a file. ExploitGenerator also contains an instance of the Communicator class to provide a single in-terface to deploy exploits to the target device.
Once analysis of the firmware has been completed and the emulator has been terminated, the researcher can use a specific implementation of the Communicator class to connect to the target device over its natural communication channel. A specific exploit generator can then created and passed a reference to the Com-municator object. Vulnerable inputs and shellcode can then be generated, which are then concatenated to produce an exploit.
4. DESIGN AND IMPLEMENTATION 4.3. IMPLEMENTATION
4.3
Implementation
4.3.1 Avatar Configuration
The Avatar configuration file is the core Python script that controls the operation of the Avatar framework. This file imports all relevant libraries for analysis, and contains configuration parameters required for S2E to function, along with all the analysis logic. The configuration file is the Python script to be executed to facilitate analysis of the target embedded system. New configuration files must be created for each individ-ual firmware, as analysis is tailored to each executable.
S2E requires considerable configuration in order to operate. Firstly, the hardware of the target device needs to be specified in order to create a virtual machine that closely emulates the target processor. QEMU has definitions of many ARM processor families, in which one must be selected to be the target processor. Memory ranges need to be mapped manually, according to the layout of the target device. This is to ensure that the addresses contained in the firmware match with those on the emulator, and memory regions which can be marked as local to the emulator are so. At a minimum the code and ram regions should be mapped to the processor. Avatar will then forward any operations that involve addresses outside of those regions to the target device. Of course, if code and RAM are not mapped, then all memory operations will be forwarded to the target device, resulting in the previously mentioned full-seperation mode.
Plugins that are loaded directly into S2E must also be configured. The most notable include the Raw-Monitor, ModuleExecutionDetector and Annotation plugins. RawMonitor simply assigns memory regions to modules. ModuleExecutionDetector then keeps track of the program counter in relation to modules, and calls any plugins which register dependency on particular modules. The Annotation plugin allows the researcher to call Lua callback functions to exhibit symbolic execution when a particular address inside of a module is reached.
Custom functions that are too specific to be placed into the framework are also implemented inside the Avatar configuration file. These include call monitors, memory and register state transfer functions. Trans-ferring registers is a specific implementation issue since different ARM processors have different amounts of registers outside of the mandated 12 general purpose registers. Many have different names on different processor families, and provide slightly different behaviour. For example, standard ARM processors have a Current Program Status Register (CPSR). This is where conditional flags are stored such as zero, negative and overflow. However, the Cortex-M3 ARM processor implements this in thexPSRregister, and omits the
CPSRregister. Meaning that registers need to be manually defined in the actual register transfer functions in the configuration file. This also allows for convenient modification of tricky registers and flags, such as the Thumb bit in theCPSR/xPSR.
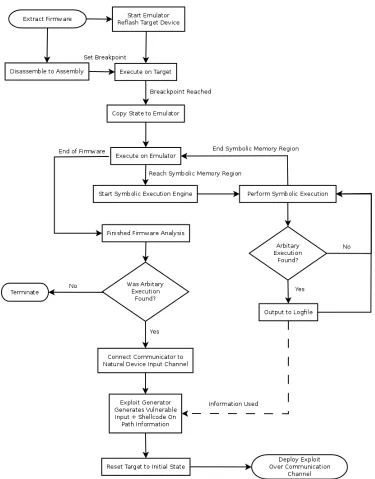
The remainder of the Avatar configuration file implements the analysis logic. This involves setting up the OpenOCD connections and loading them into the Avatar framework. Roughly speaking, each every state of the flowchart in Figure 4.2 in the Key Ideas and Methodology section represents one or a small group of function calls in the Avatar configuration file. Since the configuration file is written in Python, analysis is very procedural, which further maps the function calls required in Avatar to a structure found in the flowchart of Figure 4.2.
4. DESIGN AND IMPLEMENTATION 4.3. IMPLEMENTATION
4.3.2 Natural Device Input Communication
All embedded systems read input from some natural input channel to be useful. The problem is, most frameworks (including Avatar) have no way to communicate with the target device over its natural com-munication channels. If input is ever needed to be injected into the target device, a debugger is typically used to modify the contents of received data to the injected data.
This is bad for numerous reasons, with the main issue being that if exploits are injected into the firmware with a debugger, there is no way of verifying that the injected exploit is really what is sent over natural communication channels. That is, injecting data assures integrity, while in the real world we can never assure integrity. Take a UART serial port for an example. The data to be injected to the firmware could contain machine code that could be interpreted as ASCII code for newline or carriage return characters. Injecting the data into the firmware via a debugger will assure integrity, and all bytes will be loaded into the firmware exactly as contained in the data. However, if this data was to be sent over a UART serial channel, the UART transmitter software or the physical device would interpret the bytes that map to ASCII carriage return characters as bits that designate the end of transmission. This would cause only parts of the firmware to be copied, meaning integrity is not assured.
For this reason, it is important to send exploit payloads down the natural communication channel that would be used in real world exploitation scenarios. This research project introduces an extension to the Avatar framework which enables the researcher to do exactly that. The Communicator module2presents a
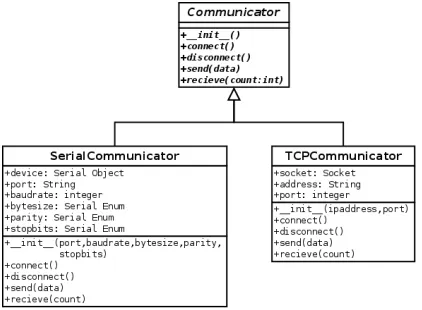
[image:24.612.197.408.442.597.2]generic interface of abstract functions for implementing channel initialisation, connection, disconnection, reading and writing. The researcher can simply extend the Communicator class to provide concrete imple-mentations of abstract functions for a specific channel type, making the Communicator class suitable for any communication channel mechanism, such as Ethernet, USB, Bluetooth or serial UART. Since embed-ded systems receive input from various sources, many concrete communicators may be active at any time. All communicators adhere to the same interface, which enables the developer to quickly and easily switch between different input channels for deploying exploits.
Figure 4.3: UML depicting the Communicator module
To illustrate the use of the Communicator module, a concrete implementation of a serial UART device communicator and TCP socket communicator3 have been provided. The serial UART implementation depends on the Python library PySerial4, which implements serial port communication for TTY devices. The researcher can specify the device address, baud rate, variable bytesize, bit parity and the number of stop bits. Since the communicator modules is an extension of Avatar, all centralised logging facilities are supported and both communicators can log exceptions to the Avatar logfile.
2The Communicator class is available in the “communicators” folder in the Avatar directory. See Appendix.
4. DESIGN AND IMPLEMENTATION 4.3. IMPLEMENTATION
4.3.3 Exploit Generation
The ExploitGenerator module5is the extension to the Avatar framework which facilitates automatic exploit generation. Since there are various exploit classes, the ExploitGenerator class presents a generic interface which can be extended to suit any exploitation method, such as stack buffer overflows, return oriented pro-gramming, use after free and null pointer dereference.
The ExploitGenerator module revolves around the notion that an exploit is the concatenation of an in-put string which places the device into a vulnerable state, and shellcode which acts upon the vulnerable state. In order to automatically generate inputs which place the device into a vulnerable state, Exploit-Generator examines path information output from the ArbitaryExecution S2E plugin. When writing the construct input() function, the developer must take care to arrange the variables from the path in the correct order that they appear in inputs, as depending on the exploit method selected, the order that S2E provides variables from path information may not be correct. Constructing payloads is a similar matter, as existing shellcode is combined with a referenced address to the buffer found from vulnerable path information. The researcher also has the option to manually override the automatically generated input and payload variables if they so choose.
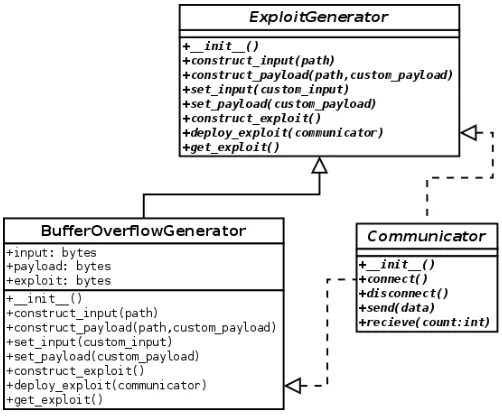
[image:25.612.176.427.379.587.2]To deploy the exploit to the target device, the ExploitGenerator class sends the exploit down a previously created natural input communication channel, denoted by a concrete implementation of the Communicator class. Since all concrete implementations of Communicator adhere to the same interface, any ExploitGen-erator can send constructed exploits down any communication channel.
Figure 4.4: UML depicting the ExploitGenerator module
The goal of this research project is to automatically generate exploits for stack buffer overflow vulnerabil-ities. BufferOverflowGenerator6is a concrete implementation of ExploitGenerator which implements this feature. BufferOverflowGenerator first builds vulnerable input strings by using vulnerable path informa-tion to place the device into a state where it will read and store a buffer in a viable locainforma-tion. The payload is constructed such that existing shellcode is extended by a return address which points to the start of the vulnerable buffer. BufferOverflowGenerator then concatenates the input and payload to generate an exploit and deploys to the target device through a specified communication channel.
5
Evaluation
5.1
Equipment Used
[image:26.612.181.424.331.556.2]The embedded system used in the development and evaluation of this research project is the Texas In-struments Stellaris EKS-LM3S1968 Evaluation Kit, developed by Luminary Micro. The evaluation kit features the LM3S1968 ARM Cortex-M3 embedded microprocessor, which boasts a maximum frequency of 50 MHz, 256K of onboard flash memory, and 64K of SRAM. Device debugging can be performed over USB with the popular FTDI 2232D chip, which implements USB to serial UART channels, which can be used to directly access and program the onboard flash memory. JTAG access is also provided.
Figure 5.1: The Stellaris EKS-LM3S1968 Evaluation Kit (cables omitted)
5. EVALUATION 5.1. EQUIPMENT USED
[image:27.612.181.424.184.284.2]Natural device communication between the Stellaris board and the Avatar framework was achieved over a serial UART line. Serial UART lines are a common feature in real world embedded systems, which makes this communication mechanism the logical choice. In order for the host computer to communicate with the target device, an external USB UART TTY was required. A generic off-the-shelf adapter was selected which supports the CP2102 UART chip.
Figure 5.2: The CP2102 External USB UART TTY adapter
Male to Female jumper leads were used to connect the two devices together. The hardware was configured as follows: The RXI and TXO pins (receive and transmission lines) on the USB UART were connected to the U0TX and U0RX ports on the Stellaris board respectively. The GND (ground) pin was connected to a free GND port on the Stellaris board. The CTR and CTS signalling pins were unused, as the firmwares implemented their own mechanisms for determining if a message has been received. VCC was not needed since both devices ran off the same voltage supplied from the host computer’s USB ports (3.3v). The serial channel was configured to 38400 baud, with eight bits per byte, one stop bit and no parity bits. Figure 5.3 shows the completed connections.
Figure 5.3: The Stellaris board connected to the external USB UART TTY
[image:27.612.160.445.424.643.2]5. EVALUATION 5.2. VULNERABLE FIRMWARES
5.2
Vulnerable Firmwares
Three vulnerable firmwares were developed specifically to evaluate the implementation and key ideas of this research project. Developing our own firmwares enabled us to limit the scope and complexity of each firmware down to an acceptable level, in order to keep the run times of symbolic execution manageable. It also provides insight into what operations take place inside a firmware, which greatly helps to find ap-propriate sections for symbolic execution and where annotations should be placed. Finding those locations requires manual disassembly of the firmware and careful reading of the assembly code, which gets several orders of magnitude more difficult when analysing an unknown firmware downloaded from the internet. Searching the internet for other firmwares for the Stellaris board yield very few results, which would also make comparisons between the firmwares difficult since they achieve different tasks with different hard-ware peripherals. Developing our own firmhard-wares enables us to be consistent in firmhard-ware design, to create comparable firmwares of increasing complexity.
Each of the firmwares implemented utilise two different hardware peripherals, a serial UART and the OLED display. Each of these peripherals must be initialised during initial device setup, even if they are not explicitly used in later stages of firmware execution. This enables the driver objects to be linked with the firmware during compilation, enabling access to that peripheral by any shellcode executed. Further, use of specialised hardware peripherals allows the firmwares developed to showcase the features of the Avatar framework, and show that this research project achieves the goals outlined in the Introduction.
The firmwares developed share a common intentional vulnerability that is exploitable on some or all pro-gram paths of the firmwares execution. The vulncpy() function, discussed at length in the Background section, introduces a simple stack buffer overflow vulnerability since it does not perform any length check-ing of an array passed as a parameter. Vulncpy() is called after the firmwares receive a message over the serial UART line, which contains tainted data which is entirely attacker controlled. To evaluate this project, all three firmwares will be analysed by the extended Avatar framework, and if successful, the vulnerability should be detected through symbolic execution, and an exploit generated from provided vulnerable path information.
As mentioned previously, manually disassembling firmwares to place annotations is one of the more diffi-cult steps required for analysis. Since each firmware shares the same core vulnerability, the annotation is effectively the same for each firmware to mark the message buffer of tainted data as symbolic. Consider an excerpt of theSmallfirmware:
0 0 0 0 0 7 2 0 < main >:
7 2 0 : b 5 f 0 p u s h { r4 , r5 , r6 , r7 , lr } ; C o n t e x t S w i t c h ...
7 4 4 : f 0 0 0 f a 8 5 bl c52 < U A R T C h a r G e t > ; R e a d l e n g t h
7 4 8 : b 2 c 4 u x t b r4 , r0 ; r4 = l e n g t h m e s s a g e 74 a : 3 c30 s u b s r4 , #48 ; C o r r e c t l y z e r o l e n g t h 74 c : d d 0 a ble . n 764 < m a i n +0 x44 > ; if < 0 do not r e a d 74 e : 466 f mov r7 , sp ; r7 is b u f f e r l o c a t i o n 7 5 0 : e b 0 4 060 d add . w r6 , r4 , sp ; A l l o c a t e l e n g t h b y t e s 7 5 4 : 4 6 2 8 mov r0 , r5 ; C A L L A N N O T A T I O N H E R E 7 5 6 : f 0 0 0 f a 7 c bl c52 < U A R T C h a r G e t > ; R e a d 1 b of m e s s a g e 75 a : 1 e64 s u b s r4 , r4 , #1 ; D e c r e m e n t c o u n t e r 75 c : f 8 0 7 0 b01 s t r b . w r0 , [ r7 ] , #1 ; S t o r e 1 b in b u f f e r 7 6 0 : d 1 f 8 bne . n 754 < m a i n +0 x34 > ; L o o p and r e a d m o r e
Annotations need to be placed at sections of the firmware where variables or buffers are required to be marked symbolic. In the above example, one variable and one buffer needs to be marked symbolic. The