Munich Personal RePEc Archive
An interpretation and critique of the
Method of Reflections
Kemp-Benedict, Eric
Stockholm Environment Institute
15 December 2014
Online at
https://mpra.ub.uni-muenchen.de/60705/
Title: An interpretation and critique of the Method of Reflections
Author: Eric Kemp-Benedicta
a
Stockholm Environment Institute, 15th Floor, Witthyakit Building, 254 Chulalongkorn University, Chulalongkorn Soi 64, Phyathai Road, Pathumwan, Bangkok, 10330, Thailand; email: [email protected].
Abstract
This paper provides an explication of the Method of Reflections developed by Hidalgo and Hausmann and a critique of their interpretation of the variables that it produces. They show that a quantity they identify with the average complexity of a country’s exports is correlated with log income. We show that their complexity measure is also orthogonal to their country diversity score. This suggests that the two measures capture different kind of information, but what that information might be is unclear. In this paper we propose an alternative interpretation and argue that the correlation between log income and Hausmann et al.’s complexity measure is a consequence of the well-studied relationship between export and income growth.
Keywords: Method of Reflections; economic complexity; Perron-Frobenius theorem
1.
Introduction
A number of recent papers have been inspired by the paper of Hidalgo and Hausmann (2009) (referred to herein as “HH”), which introduced two hypotheses: that the structure of countries’ exports reflect underlying capabilities; and that the complexity of national output is captured by a metric generated by a particular method, the Method of Reflections. While HH appear to view these hypotheses as linked, they are in fact independent. The argument for capabilities relies on the low-order elements of the Method of Reflections, which are relatively straightforward to describe and interpret, while the complexity measure relies on high-order elements, which rapidly become hard to interpret.
The essence of the first hypothesis is that a more extensive set of capabilities allows countries to produce more, and more specialized, products. This, in turn, implies that the diversity of products a country produces should be inversely related to the average ubiquity of its products, a relationship that HH see in their data. This is a compelling idea with theoretical support from the literature on diversity and growth (Imbs and Wacziarg 2003; Cadot et al. 2013) and it was prefigured in Hidalgo et al. (2007). While capabilities are not directly observed, HH provide some evidence using a proxy measure of capabilities required for different products, and in later work Hausmann and Hidalgo (2011) elaborate on their model and provide some empirical tests. Independently, Lei and Zhang (2014) extend the theoretical model of HH to capture substitutability.
The second hypothesis is less compelling than the first. It is also more abstract, and an explanation is unavoidably technical. The Method of Reflections, defined formally later in this paper, generates two series of variables from trade data. The series start with a measure of the diversity of national exports and ubiquity of products and, in iterative fashion, continue with averages of averages of these measures. HH do not provide a concrete interpretation beyond the first few members of the series, but claim that the entire series consist of generalized measures of diversity and ubiquity. Furthermore, they find that as one proceeds through the series, the fit between the series elements and log of GDP per capita gets increasingly good, rising from an R2 statistic of around 0.3 for the initial measure (member 0 in the series) to around 0.5 by the time member 18 is reached. This begs for an explanation, but the one provided by HH is vague, appealing only to the argument that all members of the series are generalizations of the first few members. In their Atlas of Economic Complexity (referred to herein as “the Atlas”), Hausmann et al. (2011 Technical Box 2.1) explicitly recognize that the interesting variable that emerges in high-order elements of the series is the second-largest eigenvalue of a particular matrix, something that we show later in this paper. They identify this variable with complexity, and offer it as an economic complexity index (ECI). Their index has since been used in a number of papers (Poncet and Starosta de Waldemar 2013; Zamfir et al. 2013; Cheng et al. 2013). However, the interpretation of this metric given in the Atlas
remains vague. The authors claim that the second eigenvector captures the largest amount of variance in the system, but they do not clarify what system the matrix represents, nor why the matrix represents the variance of that system.
This paper offers an explanation of the surprisingly good fit between the high-order members of the diversity series generated by the Method of Reflections and log GDP per capita. In the process it is shown that, far from being a generalization of diversity, the complexity index is orthogonal to diversity – it is an independent measure. Our critique is different from that of Tacchella et al. (2012) and Zaccaria et al. (2014) in that we provide an alternative explanation of HH’s findings rather than an alternative metric. We argue that the relatively strong correlation observed by HH follows from the proposition that countries with similar export baskets have similar income growth rates.
2.
The Method of Reflections
In the Method of Reflections, introduced in HH, one constructs sequences using a country-product matrix
M with elements Mcp indexed by country c and product p. The matrix entries are equal to one if Balassa’s (1965) index of revealed comparative advantage (RCA) is greater than or equal to one; in HH’s terminology, country c is said to export product p “with RCA”. From this matrix, the initial elements of the series are given by row and column sums of M,
,0 ,
c cp p
k =
∑
M (2.1),0 .
p cp c
k =
∑
M (2.2)The vector kc,0 counts the number of products a country produces with RCA, and is called the “diversity”
of that country. The vector kp,0 counts the number of countries that produce a given product with RCA,
and is called the “ubiquity” of that product. Higher-order elements in the series are generated by iterative sequences,
, , 1
,0
1
,
c N cp p N p
c
k M k
k −
=
∑
(2.3), , 1
,0
1
.
p N cp c N c
p
k M k
k −
=
∑
(2.4)HH carried out regression tests on these variables. Among other results, they found that when N was suitably large (in their example, N = 18), the kc,N values are correlated with log GDP per capita at
purchasing power parity in 2000 with an R2 exceeding one-half. In the Atlas they explicitly recognize that in the limit of large N they are effectively solving an eigenvalue problem, as we also show in the next section.
3.
The Method of Reflections as a problem in linear algebra
In this section we recast the Method of Reflections as a problem in linear algebra. We focus on the even elements of the kc,N series of vectors for countries. According to HH these are generalized measures of
diversity. In order to work only with the even elements of the sequence, we substitute equation (1.4) into equation (1.3) to eliminate the expression for kp,N. The result is
, , 2
,0 ,0
1 1
.
c N cp c p c N c c p p
k M M k
k k ′ ′ −
′
=
∑
∑
(3.1)We can write this conveniently as a matrix equation,
2,
N N
k =W⋅k − (3.2)
where the matrix W has elements
,0 ,0
1 1
,
cc cp c p p
c p
W M M
k k
′ =
∑
′ (3.3)and the vector kN represents the set of country values kc,N.
Empirically, the sequence defined by equation (2.2) converges. We denote the limiting value as a vector with no N subscript,
,
lim .
c c N N
k k
→∞
≡ (3.4)
Because it is a limiting value, kc,N and kc,N–2 are indistinguishable from each other in the limit of large N.
This means that the limiting value of the series kc,N is an eigenvector of the matrix W, where by
construction it has an eigenvalue of one:
k=W⋅k (3.5)
In general, W will have as many eigenvectors as it has dimensions, and we denote them by uic, where i = 0, 1, 2,…,Nc, and Nc is the number of countries. We order the indices such that subsequent eigenvectors have progressively smaller eigenvalues, which we denote by λi. The eigenvectors are not orthogonal, because W is not a symmetric matrix. However, with a special inner product in which the kc,0 are used as
weights, the vectors do become orthogonal, as shown in the Appendix,
,0 0 when .
c ic jc i j c
k u u = λ λ≠
∑
(3.6)As the magnitude of the eigenvectors is arbitrary, we normalize them so that
2 ,0 2
,0
1.
c ic c i
c c
k u u
k
≡
∑
=∑
(3.7)By construction, W is a non-negative square matrix, and the W matrix constructed from HH’s data set has the property of “irreducibility”.1 The Perron-Frobenius theorem (Sternberg 2010) describes the spectrum
of non-negative irreducible square matrices. In particular, the theorem states that W must possess an all-positive eigenvector that is unique up to an overall scaling factor and that its eigenvalue (equal to one in this case) is greater in magnitude than that of any other eigenvector.
As shown in the Appendix, for the matrix W, the all-positive solutions to equation (2.5) are vectors in which all of the entries are the same , so the normalized eigenvector satisfies u0c = 1. Also shown in the
1 Irreducibility is most easily defined in terms of a network. Any square matrix can be interpreted as defining a network, where a nonzero entry means that two countries are connected by a directed link from the country labeling the row to a country labeling the column. The W matrix is irreducible if there is a connected path between any two countries in the associated network. If it were not irreducible, then there would be a group of countries that collectively share an export basket that no other country contributes to. This is theoretically possible, but is not seen in the data.
4
Appendix, the limiting value of the sequence of kc,N is ku0c, where k is a weighted average of country
diversity scores kc,0, and so potentially interesting in its own right.
Because the sequence of kc,N converges to a vector with values that are the same for all countries, all of
the variation between countries is captured in a progressively shrinking difference between subsequent elements in the sequence of kc,N and the limiting value. We define this difference as
, , .
c N c N
w ≡k −k (3.8)
As shown in the Appendix, in the limit of large N these deviations are proportional to the eigenvector of
W with the largest eigenvalue less than one. That is, they are proportional to the eigenvector with the second-largest eigenvalue,
/ 2 , 1 1
lim N ,
c N c
N→∞w =wλ u (3.9)
for some w. The eigenvector u1c – the one with the second-largest eigenvalue – is the economic
complexity index defined in Technical Box 2.1of the Atlas.
Diversity and complexity are orthogonal
Between HH and the Atlas, we have two measures for countries: diversity, given by kc,0, and complexity,
given by the eigenvector of W with the second-largest eigenvalue, which we denote u1c. (HH also define
average ubiquity, kc,1, which we do not use in this paper.) From the results above it is straightforward to
show that diversity and complexity are orthogonal. Because u0c= 1, we can write
,0 1 ,0 0 1,
c c c c c
c c
k u = k u u
∑
∑
(3.10)but this is equal to zero from equation (2.6), so
,0 1 0.
c c c
k u =
∑
(3.11)This is difficult to reconcile with the interpretation of complexity as a generalization of diversity and ubiquity scores. It shows that u1c is capturing information that is not present in kc,0, but it is not obvious
what this information might be. For this, it is necessary to interpret W in economically meaningful terms.
The matrix W as a set of conditional probabilities
To better understand the W matrix, we give an interpretation of its elements as a set of conditional probabilities. The construction goes as follows. Given a country c, pick one product at random from its export basket in a selection process where all of the products it produces with RCA are equally likely to be picked, and those it does not produce with RCA will not be picked. Then the probability that a product
p is picked in this way, ( | )P p c , is given by
,0
( | ) cp.
c
M P p c
k
= (3.12)
Analogously, given a product p, select one country at random from among the countries that produce that product with RCA, with all countries given an equal weight. Then the probability of picking country c′ is
,0
( | ) c p.
p
M
P c p
k
′
′ = (3.13)
The matrix elements of W can then be seen to be
( | ) ( | ) ( | ).
cc p
W ′ =
∑
P c′ p P p c =P c c′ (3.14)That is, given a country c, an element Wcc′ is the conditional probability of reaching c′ by passing
through the products that both c and c′ export with RCA.
This interpretation provides a way to understand the eigenvectors of W. We can write an arbitrary vector
ac as a sum over eigenvectors of W,
ˆ .
c i ic i
a =
∑
a u (3.15)We then have, from equation (2.14), that the conditional expectation value of ac is
(
)
ˆ ˆ ˆ
( | ) i cc ic i i ic c 1 i i ic.
i c i i
E a c a W u′ ′ λa u a λ a u
′
=
∑ ∑
=∑
= −∑
− (3.16)If we expect the average of some property ac across countries with a similar export basket to c to be similar to the value for ac itself, then it must be true that the terms in the sum on the right-hand side of equation (2.16) are small,
(
1−λi)
aˆi a . (3.17)This condition is satisfied when eigenvectors with small eigenvalues have small coefficients. In general, we would expect coefficients to decline as we proceed from eigenvectors with large eigenvalues to those with small eigenvalues.
This is an important principle, so we restate it: If a characteristic of countries is expected to be similar among countries with similar export baskets, then that characteristic should be correlated most strongly with the eigenvectors of W with the largest eigenvalues, particularly u0c (a constant term) and u1c.
4.
Retracing Hidalgo and Hausmann’s steps
In later sections we provide alternative interpretations for the vectors produced by the Method of Reflections to those offered by HH. To ground the later discussion we first show that we find similar results to HH when applying their method. To construct our dataset, we select data for 2000 from the data set used by HH2. We then select those countries for which we have data for the year 2000 on GDP per
2 http://www.chidalgo.com/productspace/Data/EXPORTS.txt
6
capita in PPP and exports at market exchange rates from the World Development Indicators database (World Bank 2014).3 Finally, we remove any products not produced by any of these countries in that the
value of exports was recorded as zero in the trade database used by HH. Using Scilab ver. 5.4.1 (Scilab Enterprises 2012), we apply the Method of Reflections and the results in the previous section to construct
0
k , k18, u0
, and
1
u . For further comparison with HH we also compute the entropy statistic for each country over shares of exports measured as values. As expected from the theory presented above, the vector u0
has a uniform value for all countries, and
0
k and u1
are orthogonal.
Results for regressions comparable to those of HH (in their Technical Appendix Table S6) are shown in Table 1, with some differences. First, by construction we selected a different subset of countries; second, we report adjusted R2 values to better compare models with different numbers of explanatory variables. The results, produced using R ver. 3.1.0 (R Development Core Team 2011), are similar to those of HH, with kc,0 having comparable explanatory power to entropy and both kc18 and u1c having better explanatory
power than either. Because u1c captures (to a very good approximation) the same variation between
countries as does kc,18, they have identical adjusted R2 values, but different coefficients. The final column
shows that, when combined with u1c, kc,0 loses its explanatory power.
The regression coefficient reported in Table S6 of HH for kc,0 is 2×10⁻⁵ of the value of the coefficient for kc,18. We find a similar ratio, equal to 3.6×10⁻⁵ using the values in Table 1. From equation (2.9), this
should be of the order of magnitude of λ19, where λ1 is the eigenvalue of u1c. It has a value of 0.331, so
λ19=4.8×10⁻⁵, consistent with the values for the ratios of the regression coefficients.
TABLE 1 NEAR HERE
5.
Exports, income, and eigenvectors
In this section we use the interpretation of W as a set of conditional probabilities to provide an alternative explanation for the relatively good correlation between log income and u1c shown in Table 1. We note that
we are seeking to explain a tendency, not a rule: u1c explains 56% of the variation between observations,
but it leaves unexplained another 44%. We begin with the proposition that income growth is similar for countries with similar export baskets. This follows from two further propositions: countries with similar export baskets experience similar rates of export growth and export growth is correlated with income growth. The first of these propositions assumes that country shares of global exports for the products they export with RCA change relatively slowly, while the last of these propositions is consistent with both the export-led growth (ELG) hypothesis and Thirlwall’s law (Thirlwall 1997; McCombie 1997). Neither family of theories predicts a strictly causal relationship, only a tendency, but as noted above, a tendency is what we seek to explain. Moreover, we are concerned with correlation rather than causation, so debates over the interpretation of tests of ELG (Giles and Williams 2000a; 2000b) are less relevant to this discussion than the observation that different empirical studies find a statistically and economically important relationship between export growth and income growth (Lewer and Berg 2003).
3 We use PPP conversion factors for income both because it was used by HH and because it better captures standard of living within countries. For traded goods, market exchange rates are the appropriate conversion factors.
7
Denoting national income growth by gc, we express the proposition that income growth is similar for countries with similar exports in the following way,
( | ) c.
E g c ≅g (5.1)
If this holds true then inequality (2.17) applies and we expect yc to be dominated by eigenvectors of W
with large eigenvalues. That is,
0 1.
c c c
g ≅gu +gu (5.2)
Empirically, we would expect this to hold with an error term,
0 1 .
c c c c
g =gu +gu +ε (5.3)
The growth rate of income is, approximately, the time rate of change of log income. Over time, the errors accumulate, so equation (4.3) describes a stochastic process. If the errors are iid normally distributed with mean zero and standard deviation σ, then after a time T we should have,
(
0 1)
( )ln ( ),
(0)
c
c c c c
y T
T gu u T
y = +g +ε (5.4)
where yc is GDP per capita for country c and
(
)
( ) ~ 0, .
c T N T
ε σ (5.5)
That is, the errors for log GDP per capita grow more slowly than the mean, so log GDP per capita should be dominated by eigenvectors of W with large eigenvalues, and to an even greater extent than are income growth rates.
The vector of values of log GDP per capita can be expanded in eigenvectors of W, where the coefficients are determined using the orthogonality condition in equation (2.6). (The result is identical to that obtained through a weighted least-squares regression where the weights are given by kc,0.) As shown in Figure 1,
log GDP per capita is dominated by the first two eigenvectors of W. Using the notation of equation (4.4),
g = 9.50, γ = 0.72, and all other coefficients are less than half the value of γ.
A further test of the propositions offered above is to compute Pearson’s correlation coefficient between
E(g|c) and gc. If equation (4.1) holds as a tendency rather than a rule, we expect the correlation coefficient to be significantly larger than zero but perhaps quite a bit less than one. The computed value is 0.61, consistent with this interpretation and with the explanatory power of u1c in the regression results shown in
Table 1.
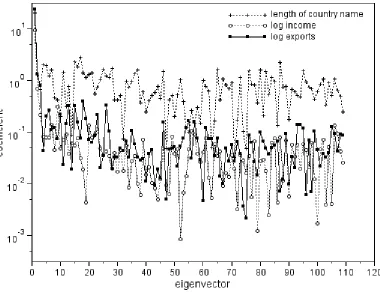
Finally, the argument that we applied to log income should apply equally to the log of exports, because our argument relied on the observed correlation between export and income growth. Also, it should not apply to any national variable not related to exports, such as the length of a country’s name. As shown in Figure 2, the coefficient for the log of exports falls with increasing eigenvalues, as expected. The length of country names has a large zero mode, as it should – country names do not have a zero mean length – but otherwise the spectrum shows no particular trend.
FIGURE 1 NEAR HERE
FIGURE 2 NEAR HERE
6.
Discussion
HH interpret u1c as a measure of complexity, and so conclude that the correlation between u1c and log
GDP per capita confirms that complexity is correlated with income. In this paper we argue that the correlation arises because income growth rates are expected to be similar, although not identical, between countries with similar exports. As discussed earlier in the paper, this proposition has empirical support – indeed, it is a topic of long-standing interest (e.g., Feder 1983) – and a copious literature offers multiple and competing theories for why and how trade and economic growth should be linked. We relate this proposition to the empirical result that log income is correlated with an eigenvalue of W by showing that the matrix W, implicit in HH and explicit in the Atlas, can be interpreted as the probability of reaching a country c′ by starting from a country c and following a path through their shared exports. Multiplying W
by a vector of values across countries then gives an average over countries with export baskets similar to
c. If that average is expected to be close to the starting vector, then it should be dominated by eigenvectors of W with the largest eigenvalues. We then apply this general observation to the particular case of log income.
The argument in this paper relies on the probabilistic interpretation of W. Other economically grounded interpretations may be possible, but HH and the Atlas do not provide one with any clarity. In HH the series of kc,N generated by W is stated to be a set of generalized diversity scores, but no explicit
interpretation is provided beyond the first few elements. In the Atlas the eigenvector with the second-largest eigenvalue is said to contain most of the variation in the system. That would be true if W were a covariance matrix, but it is not, and it is not obviously true that it otherwise contains information about the variation of a system. Indeed, in the interpretation given in this paper the matrix W captures similarities between countries more than it does variation between them, as illustrated by the principal eigenvector being uniform across countries.
In this paper we focused on measures for countries rather than products, but the critique applies equally to the relationship between product measures defined by HH and the Atlas and as applied by Klimek et al. (2012). However, while we view our critique as fundamentally challenging the interpretation of the eigenvector of W with the second-largest eigenvalue as a measure of complexity, it says nothing about the interpretation that HH give to the low-order members of the series of kc,N. In particular, it poses no
problem for their hypothesis that the diversity and average ubiquity scores of countries reflect underlying capabilities. For this reason, the common value k that arises in the limit of large N for the sequence kc,N
may be of interest in itself, because, as shown in the Appendix, it is a weighted average of country diversity scores. The change in its value over time may be interesting to study.
7.
Conclusion
In this paper we challenge the interpretation that Hidalgo and Hausmann (2009) and Hausmann et al. (2011 Technical Box 2.1) give to the high-order members of the sequence generated by their Method of Reflections. As in Hausmann et al., we note that the high-order members are solutions to an eigenvalue problem, but we disagree with those authors about the interpretation of the matrix in that problem. We
show in particular that Hausmann et al.’s complexity score is orthogonal to their diversity score, throwing doubt on their proposition that complexity captures, in part, the diversity of countries’ exports.
We interpret the matrix as a set of conditional probabilities, and the correlation between economically interesting variables and the eigenvectors of the matrix as a reflection of similarities in the values of those variables between countries with similar export baskets. While such countries may, indeed, have similar levels of “complexity”, however measured, it is not obvious that is what is captured by Hausmann et al.’s metric, and there are many competing explanations for the observed (Lewer and Berg 2003) correlation between export and income growth. We conclude that the more promising route of inquiry started by Hidalgo and Hausmann is to look at the low-order members of the Method of Reflections sequence and investigate to what extent those variables capture underlying characteristics of national economies.
8.
References
Balassa, B. (1965) ‘Trade Liberalisation and “Revealed” Comparative Advantage’. The Manchester
School, 33(2). 99–123. doi:10.1111/j.1467-9957.1965.tb00050.x.
Cadot, O., Carrère, C. and Strauss-Kahn, V. (2013) ‘Trade Diversification, Income, and Growth: What Do We Know?’. Journal of Economic Surveys, 27(4). 790–812. doi:10.1111/j.1467-6419.2011.00719.x. Cheng, Z., Dongfeng, T. and Xiangqian, L. (2013) ‘The hidden capabality network of product space’.
2013 IEEE International Conference on Service Operations and Logistics, and Informatics (SOLI) 567–
71. Proceedings of the 2013 IEEE International Conference on Service Operations and Logistics, and Informatics (SOLI).
Feder, G. (1983) ‘On exports and economic growth’. Journal of Development Economics, 12(1–2). 59– 73. doi:10.1016/0304-3878(83)90031-7.
Giles, J. A. and Williams, C. L. (2000a) ‘Export-led growth: a survey of the empirical literature and some non-causality results. Part 1’. The Journal of International Trade & Economic Development, 9(3). 261– 337. doi:10.1080/09638190050086177.
Giles, J. A. and Williams, C. L. (2000b) ‘Export-led growth: a survey of the empirical literature and some non-causality results. Part 2’. The Journal of International Trade & Economic Development, 9(4). 445– 70. doi:10.1080/096381900750056867.
Hausmann, R. and Hidalgo, C. A. (2011) ‘The network structure of economic output’. Journal of
Economic Growth, 16(4). 309–42. doi:10.1007/s10887-011-9071-4.
Hausmann, R., Hidalgo, C. A., Bustos, S., Coscia, M., Chung, S., et al. (2011) The Atlas of Economic
Complexity: Mapping Paths to Prosperity. Center for International Development, Harvard University :
Harvard Kennedy School : Macro Connections, MIT : Massachusetts Institute of Technology, Cambridge,
Mass.
Hidalgo, C. A. and Hausmann, R. (2009) ‘The building blocks of economic complexity’. Proceedings of
the National Academy of Sciences, 106(26). 10570–75. doi:10.1073/pnas.0900943106.
Hidalgo, C. A., Klinger, B., Barabási, A.-L. and Hausmann, R. (2007) ‘The Product Space Conditions the Development of Nations’. Science, 317(5837). 482–87. doi:10.1126/science.1144581.
Imbs, J. and Wacziarg, R. (2003) ‘Stages of Diversification’. The American Economic Review, 93(1). 63– 86.
Klimek, P., Hausmann, R. and Thurner, S. (2012) ‘Empirical Confirmation of Creative Destruction from World Trade Data’. PLoS ONE, 7(6). e38924. doi:10.1371/journal.pone.0038924.
Lei, H. and Zhang, J. (2014) ‘Capabilities’ substitutability and the “S” curve of export diversity’. EPL
(Europhysics Letters), 105(6). 68003. doi:10.1209/0295-5075/105/68003.
Lewer, J. J. and Berg, H. V. den (2003) ‘How Large Is International Trade’s Effect on Economic Growth?’. Journal of Economic Surveys, 17(3). 363–96. doi:10.1111/1467-6419.00198.
McCombie, J. S. L. (1997) ‘On the Empirics of Balance-of-Payments-Constrained Growth’. Journal of
Post Keynesian Economics, 19(3). 345–75.
Poncet, S. and Starosta de Waldemar, F. (2013) ‘Export Upgrading and Growth: The Prerequisite of Domestic Embeddedness’. World Development, 51. 104–18. doi:10.1016/j.worlddev.2013.05.010.
R Development Core Team (2011) R: A Language and Environment for Statistical Computing. R Foundation for Statistical Computing, Vienna, Austria. http://www.R-project.org.
Scilab Enterprises (2012) Scilab: Free and Open Source Software for Numerical Computation. Scilab Enterprises, Orsay, France.
Sternberg, S. (2010) Dynamical Systems. Dover Publications, Mineola, N.Y.
Tacchella, A., Cristelli, M., Caldarelli, G., Gabrielli, A. and Pietronero, L. (2012) ‘A New Metrics for Countries’ Fitness and Products’ Complexity’. Scientific Reports, 2. doi:10.1038/srep00723.
Thirlwall, A. P. (1997) ‘Reflections on the Concept of Balance-of-Payments-Constrained Growth’.
Journal of Post Keynesian Economics, 19(3). 377–85.
World Bank (2014) ‘World Development Indicators’. http://data.worldbank.org/data-catalog/world-development-indicators.
Zaccaria, A., Cristelli, M., Tacchella, A. and Pietronero, L. (2014) ‘How the Taxonomy of Products Drives the Economic Development of Countries’. PLoS ONE, 9(12). e113770. doi:10.1371/journal.pone.0113770.
Zamfir, A.-M., Lungu, E.-O. and Mocanu, C. (2013) ‘Entrepreneurship among higher education graduates in 13 European countries’. Theoretical and Applied Economics, 18(11 (588)). 73–82.
Appendix 1: Mathematical proofs of assertions in the text
Orthogonality conditions for the eigenvectors of W An eigenvector ujc of W satisfies
,
,
cc jc j jc c c
W u′ ′ λ u
′
=
∑
(A.1)so we can write
,0 ,0
,
1
.
c ic jc c ic cc jc c j c c
k u u k u W u
λ ′ ′
′ =
∑
∑
(A.2)Inserting the expression for the elements of W in terms of M, we have
,0
, ,0
1 1
,
c ic jc ic cp c p jc c j c c p p
k u u u M M u
k
λ ′ ′
′
=
∑
∑ ∑
(A.3)but the summation can be rearranged to give
,0 ,0 ,0
, ,0 ,0 ,
1 1 1 1
.
c ic jc c jc c p cp ic c jc c c ic c j c c c p p j c c
k u u k u M M u k u W u
k k
λ ′ ′ ′ λ ′ ′ ′
′ ′ ′
= =
∑
∑
∑
∑
(A.4)But now, because uic is also an eigenvector of W, we have
,0 ,0 ,0 ,
i i
c ic jc c jc ic c ic jc
c j c j c
k u u λ k u u λ k u u
λ ′ ′ ′ λ
′
= =
∑
∑
∑
(A.5)where the last step is a simple relabeling. This can be true either if
λ λ
i = j or if∑
ck u uc,0 ic jc =0.The all-positive eigenvectors of W We define
1 for all .
c
n = c (A.6)
Taking the inner product of this vector with another vector or matrix is then equivalent to adding up the values. In particular, from equation (1.2),
,0.
cp c cp p
c c
M n = M =k
∑
∑
(A.7)Using this result we then find
(
)
,0 ,0 ,0 ,0 ,0 ,0 ,0 ,0 1 1 1 1 1 1 1 .cp c p c c
c c p p
cp c p c
p c c p p cp p c p cp p c c
n M M n
k k
M M n
k k k M k k M k n ′ ′ ′ ′ ′ ′ ⋅ = = = = = =
∑
∑
∑
∑
∑
∑
W (A.8) Therefore, . n n ⋅ =W (A.9)
We conclude, from the Perron-Frobenius theorem, that any positive eigenvector of W is a vector in which all elements take the same value. In the normalization used in this paper, equation (2.7), the normalized eigenvector is nc,
0 .
u =n (A.10)
The limiting value for kc,N is an average of the kc,0 From equation (2.2),
/ 2
0, for even .
N N
k =W ⋅k N (A.11)
Defining
/ 2
lim N ,
N→∞
≡
U W (A.12)
we then have
0.
k= ⋅U k (A.13)
We also know that the kc are the same for all countries, so the matrix entries for U must take the form
.
cc c
U ′=U′ (A.14)
Because the all-constant vector nc is an eigenvector of W with eigenvalue one it is also an eigenvector of
U with eigenvalue one, so
1.
c c c c c c
n U n′ ′ U ′
′ ′
=
∑
=∑
= (A.15)From equation (A.13) we therefore have
,0, where 1.
c c c c
c c
k k U k′ ′ U ′
′ ′
= =
∑
∑
= (A.16)That is, the common value of the vector kc is a weighted average of the country diversity scores kc,0.
Deviations as eigenvectors of W
In terms of deviations wc,N, we have
(
22)
2 2. N N N N N N N N k k
w kn w kn
w kn w kn
w w − − − − = ⋅ + = ⋅ + + = ⋅ + = ⋅ W W W W (A.17)
The third equality follows because, as we showed above, n is an eigenvector of W with eigenvalue one.
The sequence of wN
must get smaller as the sequence increases, because the values kc,N approach the
limiting value k. However, they may converge in the sense that they become smaller at the same rate, so that
lim N N .
N→∞w =a u
(A.18)
From equation (A.17), this would mean that
2
lim N .
N N a u u a →∞ −
=W⋅
(A.19)
If this holds, then u is an eigenvector of W with eigenvalue
2
lim N .
N N a a λ →∞ −
= (A.20)
From the Perron-Frobenius theorem, the eigenvalues of all eigenvectors other than the all-positive eigenvector are smaller in magnitude than the eigenvalue for the all-positive eigenvector. For W, the all-positive eigenvector has an eigenvalue equal to one, so
1.
λ < (A.21)
That is, the magnitude of the deviations shrinks, as it should. As N becomes large, only the eigenvectors with the largest eigenvalues will be significant, as the coefficients on the others decline more rapidly.
Table
Table 1: Regression results for log GDP per capita in PPP terms (2011 International Dollars) in 2000
Model 1 Model 2 Model 3 Model 4 Model 5
constant 6.788*** (25.25)
8.087*** (53.84)
-39282*** (-11.85)
9.544*** (104.47)
9.849*** (38.22)
entropy 0.617 *** (8.50)
kc,0 0.00580***
(7.33)
-0.00143 (-1.26)
kc,18 161.25*** (11.85)
u1c 0.796*** (11.85) 0.921*** (7.74)
Adjusted R2 0.393 0.324 0.559 0.559 0.561
Observations 111 111 111 111 111
Figures
Figure 1: Coefficients of log GDP per capita (2011 international dollars in 2000) for eigenvectors of W
[image:16.612.68.547.112.303.2]Figure 2: Coefficients of log GDP per capita in 2000 for eigenvectors of W compared to coefficients for log exports and length of country names