Leo Leppänen
University of Helsinki Helsinki, Finland [email protected]Juho Leinonen
University of Helsinki Helsinki, Finland [email protected]Petri Ihantola
Tampere University of Technology Tampere, Finland [email protected]
Arto Hellas
University of Helsinki Helsinki, Finland [email protected]ABSTRACT
In this work, we explore students’ usage of online learning material as a predictor of academic success. In the context of an introductory programming course, we recorded the amount of time that each element such as a text paragraph or an image was visible on the students’ screen. Then, we applied machine learning methods to study to what extent material usage predicts course outcomes. Our results show that the time spent with each paragraph of the online learning material is a moderate predictor of student success even when corrected for student time-on-task, and that the information can be used to identify at-risk students. The predictive performance of the models is dependent on the quantity of data, and the predic-tions become more accurate as the course progresses. In a broader context, our results indicate that course material usage can be used to predict academic success, and that such data can be collected in-situwith minimal interference to the students’ learning process.
KEYWORDS
element-level web logs, web log mining, academic success predic-tion, online learning materials, educational data mining
ACM Reference Format:
Leo Leppänen, Juho Leinonen, Petri Ihantola, and Arto Hellas. 2017. Pre-dicting Academic Success Based on Learning Material Usage. InProceedings of SIGITE’17, Rochester, NY, USA, October 4–7, 2017,6 pages.
https://doi.org/10.1145/3125659.3125695
1
INTRODUCTION
Large amounts of research effort has been directed towards devel-oping methodologies for detecting students who struggle. This line of research is of special importance in institutions with classes of hundreds of students, where instructors can rarely keep up with the performance of individual students. If struggling students can Permission to make digital or hard copies of all or part of this work for personal or classroom use is granted without fee provided that copies are not made or distributed for profit or commercial advantage and that copies bear this notice and the full citation on the first page. Copyrights for components of this work owned by others than the author(s) must be honored. Abstracting with credit is permitted. To copy otherwise, or republish, to post on servers or to redistribute to lists, requires prior specific permission and/or a fee. Request permissions from [email protected].
SIGITE’17, October 4–7, 2017, Rochester, NY, USA
© 2017 Copyright held by the owner/author(s). Publication rights licensed to Associa-tion for Computing Machinery.
ACM ISBN 978-1-4503-5100-3/17/10. . . $15.00 https://doi.org/10.1145/3125659.3125695
be identified early, appropriate resources for targeted help and guid-ance can be allocated, which can help the students succeed in their studies. This type of research is especially popular in the context of learning programming [21], where various types of questionnaires and tests [16, 38, 45], machine learning based methods [2, 11], and methods whose construction has required programming-specific expert knowledge [7, 9, 22, 44] have been proposed for the task.
As these methodologies can be highly context- and domain sensi-tive [35], we set out to investigate how a simpler and more general-izable data source – student material usage – could be used to build predictive models for identifying at-risk students. Other approaches with more generic data sources include the works by Kennedy and Cutts [24], Porter et al. [37] and Liao et al. [30], who have used data from in-class questions for predicting course outcomes. The task has also been studied on data from learning management sys-tems [31, 39] – however the data at our disposal is more detailed.
The underlying hypothesis of this article is that fine-grained online learning material usage – that is,information on the time each paragraph and image in an online course material is visible to a user– can be used to predict learning outcomes.
All such predictive models are only useful if they can make sufficiently accurate predictions at a sufficiently early stage: late predictions are largely useless for the educators as they do not allow timely interventions to help the struggling students. At the same time, more data is available towards the end of the course, resulting in a situation where predictive models balance between “early” and “accurate”. To this end, we are also interested in understanding how much data is needed to, or more concretely “at what point during the course” can we, predict the learning outcomes at a useful accuracy. Our research questions are as follows:
RQ 1: Can one predict student performance based on the relative amounts of time each element of the online learning material is visible on students’ screens?
RQ 2: How far into the course must data be collected before these models achieve useful accuracy levels?
This article is organized as follows. In the next section, we overview the related work in predicting academic success within the context of computing and information technology. In Section 3 we detail the research design, including the context, data, and the methodology used for conducting the research. The results are dis-cussed in Section 4, which includes also a discussion on limitations of the study and possible future venues. Finally, Section 5 presents some final conclusions.
2
RELATED WORK
This section presents an overview of previous work on predicting student learning outcomes both in general and more specifically in the context of learning to program. While factors such as motiva-tion [1, 28, 38] and self-percepmotiva-tions [5, 23, 40, 45] and metacognitive abilities [18, 19, 32] have been linked to learning outcomes and aca-demic success, they are difficult to quantify without questionnaires. Within the context of this study, we are more interested in predic-tors than can be measured automatically.
First, perhaps unsurprisingly, deliberate practice has been con-nected to becoming an expert in a subject by Ericsson et al. [14]. Their finding is supported by, for example, a study by Minaei-Bidgoli et al. [34] where student learning outcomes are predicted based on a multitude of features extracted from logs of an intelligent tutoring system used in an introductory university level physics course. They report relatively high accuracies in both the binary classification case of classifying students to those who fail and those who pass the course as well as when classifying students to three groups: high, middle and low grade. In their model, the most important features for the 3-class classification turned out to be the total number of correct answers and the total number of tries. Total time spent was among their top five predictors. Similarly, previous research [17] has shown that the effort a student takes is well correlated with learning outcomes.
The programming process itself can also be used to predict learning outcomes in computer science and programming. Piech et al. [36] used a complex model of the students’ programming process to classify students into groups that exhibited statistically significant different midterm scores. Similarly, Ahadi et al. [2] were able to correctly classify students into high-performing and low-performing students with Matthew Correlation Coefficients in the range from 0.71 to 0.81 based on features extracted from previous academic success, past programming experience and “programming assignment specific source-code snapshot attributes that potentially reflect students’ persistence and success with the course assign-ments” [2]. When the same model – trained on data from the initial course – was used to classify students in a subsequent course, accu-racies in the range of 71 % to 80% were observed [2]. These results are in line with reports that the mental models students have of programming are predictive of, or at least related to, their course outcomes [12, 45] and that novice and expert programmers employ different types of mental models [42].
Other studies have identified a multitude of other predictors. Leppänen et al. [26] found correlations between the types of pauses students take from writing program code and exam scores in a CS1 course. Leinonen et al. [25] were able to predict student learning outcomes based on the key press latencies in their typing. Porter et al. [37] predict course exam scores from in-class student clicker answers. Similar work has been done by Liao et al. [30]. Finally, multiple researchers have constructed metrics from source code snapshots that explain parts of students’ course performance [7, 9, 21, 22, 25, 37, 43, 44].
Previous works have also extracted small amounts of higher level features from online learning management systems and predicted learning outcomes from said features [27, 31, 39].
3
RESEARCH DESIGN
This section overviews the design of this study in detail. The first subsection introduces the context of this study, and especially the context of the data used in the study. The second subsection details the methodologies used to answer the research questions.
3.1
Context and Data
The data used in this article comes from a seven week Introduction to Programming course held in the fall of 2016 at the University of Helsinki, a European research-first university. The course teaches the students the basics of Object Oriented programming in Java, and has no pre-requisites. It is mandatory for Computer Science majors, and can be taken by anyone who wishes to learn programming.
The online course material consists of seven content pages (HTML documents), each corresponding to one week of the course. These pages are somewhat analogous to chapters of a course book, but they also have dynamic content such as visualizations. Program-ming assignment handouts are also embedded to the content pages, but they are completed in a separate programming environment.
A client-side data gathering component that was built using Javascript was embedded to the material for the purposes of this study. The component records students’ movements within the material page and stores time-based information on each larger HTML element (paragraph, image, etc.) that is visible on the users’ screen. More specifically, the JavaScript component listened for scroll events, where the user’s screen moved, and click events, where the user clicked on an element of the web page. After each event, the visibility of each HTML element – such as paragraphs and images – was analyzed, and information on what elements were visible was stored. Similar events were recorded every 2500 milliseconds if the user did not interact with the browser, provided that the browser window was visible. Collection was paused if the user was completely idle for a longer period of time to remove outliers such as long pauses where the user had left the page open but was not actually reading the material.
The course had 2 hours of weekly lectures, and the students were free to complete their weekly assignments wherever they wished to. As a part of the course, the teaching staff – mainly teaching assistants – provided over 20 hours of weekly support in specific on-campus computer labs. The grading was based on course assignments (55% of overall score) and three exams (45% of overall score). In order to pass the course, the students had to receive at least one half of the overall score as well as one half of the exam score. A total ofn=271 participants participated in the final exam and provided data for the study.
Due to the way the data collection and the learning sessions were organized, our data collection happened completelyin-situ. This method therefore avoids many of the potential issues related toex-situdata collection schemes, where the act of collecting data may influence the behavior of the participants.
3.2
Methodology
In this section, we outline the method we use to determine the answers to our research questions.
3.2.1 Data Preprocessing. First, the recorded events were parsed. For each student and each HTML element with visible content, the number of events where the student had the HTML element visible on their screen were counted. The event counts were then normalized for each student so that the overall sum of effort for each week – in terms of proportionate events in elements – was one. This resulted in a data set, where the data effectively described element popularities for each student.
Then, in order to make the data behave better with the support vector based models (discussed below), both the inputs and the outputs were transformed to have unit variance and zero mean. Finally, The data was split into two parts. A training set containing 70% of the students, and a test set containing the remaining 30% of the students.
3.2.2 Classification and Regression. The main difference be-tween classification and regression is that classification is about determining a label for each data point – for example, whether the student will pass the course based on the material usage or not. Regression on the other hand is about trying to determine a scalar value for each data point – for example, determining the exam score of a student based on the material usage.
While there can be no “best” classification algorithm over the set of all possible scenarios [46], empirical research suggests that certain algorithms perform better than others when “common” scenarios are considered [10, 15]. Based on the above suggestion, we utilize Support Vector Classifiers (SVC) [13] andϵ-insensitive Support Vector Regressors (ϵ-SVR) [6] for the purposes of predicting academic success1. In all cases, we evaluate three types of kernels commonly used with support vector methods: a linear kernel, an RBF kernel and a sigmoid kernel.
3.2.3 Predicting academic success.We label as “at-risk” all stu-dents who would obtain a grade of 0, 1 or 2 on a scale from 0 (fail) to 5 (best). This decision was influenced by the introductory nature of the course: failing to achieve a moderate grade in such a course would raise serious concerns about the student’s ability to succeed in the subsequent courses.
To answer our first research question of “Can one predict student performance based on the relative amounts of time each element of the online learning material is visible on students’ screens?”, we build and evaluate predictive models that take the participants’ material usage data as an input, and output whether the participant is “at-risk” or not. The previous is done as a classification task. We also predict three other variables from the usage data as a regression task: course exam scores, programming assignment scores and course total scores.
The second research question – “How far into the course must data be collected before these models achieve useful accuracy levels?” – requires us to build such models using multiple data sets, so that we can identify the point in time during the data collection when the models become practical. We simulate this by constructing multiple training sets, each containing only data from firstwweeks of the 7-week-long course, forw ∈ [1,7]and report the results for research questions 1 and 2 using all of them.
1For a more in-depth discussion on support vector classification and regression, see e.g. [8, 41].
3.2.4 Evaluation.To prevent overfitting, the input set was split into a training and test sets. A 10-fold cross validated grid-search was conducted over the training set to determine good parameters for the predictive models that used support vector classifiers. This procedure was completed separately for each classifier – once good parameters were identified, the performance of the predictive model was evaluated with the test data.
The performance of the classifiers was evaluated and reported using F1 Score, which is the harmonic mean of precision and recall and receives values in the range from 0 (worst) to 1 (best). This measure, however, suffers from a bias. Namely, the F-measure is not invariant on the classification problem being “flipped” so that the “positive” and “negative” class labels are reversed. We thus report the F1 score for both options as the “positive” label. Regression models are evaluated and reported using R-squared, which is the percentage of variation in the data that is explained by the predictive model.R2takes values from positive 1 to negative infinity, with 1 indicating a model with no error and smaller values indicating increasingly larger errors.
4
RESULTS AND DISCUSSION
In this section we display the results obtained using the research methodology described in Section 3.2. The aggregated results are shown in Table 1.
4.1
Summary of Results
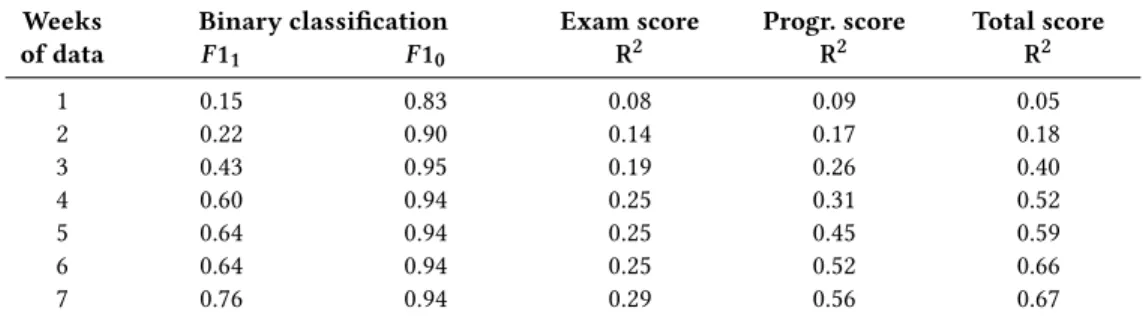
In the classification task where the goal was to predict whether the student will be at-risk based on the material usage, we notice that the F1-scores for cases where not-at-risk students are considered to be the positive label (F10) start at 0.83 after only the first week and quickly raise to a maximum of 0.95 when three weeks of data is used. In the case where at-risk students are considered the positive label (F11), the F1-scores raise much more slowly, but eventually reach up toF1=0.76 when all available data is used. Essentially, this means that it is harder to correctly identify the students who are at-risk (F11) and easier to identify the students who are not at-risk (F10).
We further note that significant bumps in theF11score are ob-served once the third and the fourth weeks’ data are added. In other words, only minor gains in classification accuracy are achieved by adding the data from the fifth and the sixth weeks. This indicates that an intervention for struggling students could be conducted at around halfway through the course (after week 3 or 4).
In the regression cases, we notice thatR2values for students’ total scores and programming assignment scores reach fairly signif-icant heights atR2=0.56 for programming scores andR2=0.67 for total scores when all data is used. Exam scores, however, exhibit significantly lowerR2 scores maxing out atR2 =0.29 when all data is used. Outside the first week, the total scores produce better regression results than either of its component scores, i.e. the exam and programming assignment scores.
The exam score regression accuracy behaves similar to the clas-sification accuracy in that after the fourth week of data is available, further weeks seem to provide only minor improvements. Such a phenomena is not, however, so clearly apparent in the programming assignment score and total score regression tasks.
Table 1: Performance in classifying students into high and low performers, predicting students’ exam, programming, and total scores from the material usage data using different amounts of data from the start of the course. Only the best model for each task is reported.F11andF10are the F1-scores wherein “at-risk” is considered to be the positive label and the negative label, respectively.
Weeks Binary classification Exam score Progr. score Total score of data F11 F10 R2 R2 R2 1 0.15 0.83 0.08 0.09 0.05 2 0.22 0.90 0.14 0.17 0.18 3 0.43 0.95 0.19 0.26 0.40 4 0.60 0.94 0.25 0.31 0.52 5 0.64 0.94 0.25 0.45 0.59 6 0.64 0.94 0.25 0.52 0.66 7 0.76 0.94 0.29 0.56 0.67
4.2
Material Usage Predicts Success
Based on the results, we observe that the element-level material usage statistics can be used to predict student learning outcomes in terms of both identifying at-risk students and predicting the total course scores of students. As the data is normalized so that the effort in each week sums up to one, this predictive power is independent of the total study effort. This means that we can answer the first research question “Can one predict student performance based on the relative amounts of time each element of the online learning material is visible on students’ screens?” in the affirmative. These results, together with results in [27], indicate that researchers should pay attention to what the students are reading instead of coarse grained movement data.
To determine our answer to the second research question, “How far into the course must data be collected before these models achieve useful accuracy levels?” we observe the changes in the values of Table 1 as more data is made available. TheR2and F1 values of the models vary based on the concrete task, but a small trend is never-theless visible. Namely, we note that most models see a somewhat significant bump in their accuracy at around weeks three and four. Beyond this, the increase in predictive power is largely constant. This finding suggests that some basic predictions are possible al-ready after three or four weeks of data are available – that is, soon after the course’s halfway-point – but waiting longer allows for better predictions.
4.3
A Bump in Predictive Power
In the online course material that we used for the study, the students start to familiarize themselves with object-oriented programming during weeks three and four, while the first two weeks are focused on procedural programming. That is, during the first two weeks, the students always program to the same file throughout the assign-ment, and are not specifically required to maintain a broader view of the functionality of their program. While the students use input and output -related objects during the first week, and lists during the second, they do not yet need to construct their own objects.
We hypothesize that one of the reasons for the bump in the predictive power in weeks three and four is the relative bump in the effort that students need to invest in order to understand the course contents: objects have previously been noted as a challenging
topic [4, 20, 33], and it is meaningful to assume that the predictive models can – to some degree – separate those who struggle with object oriented programming constructs from those who do not.
4.4
On the Generalizability of our Approach
It appears that the methodologies presented here can provide valu-able information to educators. Whilst our materials include a spe-cific area that is challenging – namely the introduction of object-oriented programming – nothing in the actual data used in this study is inherently programming-related: the data contains infor-mation on the relative element popularity, not about the content of the said elements. Therefore, such element data should be col-lectible from any online learning material and from other learning management systems such as Moodle or Blackboard. As such, the system appears to be a candidate for usage in other educational contexts as well.When one considers the fairly strong learning outcome predic-tion results presented in this study, a quespredic-tion arises: exactly how complex models are required to automatically identify struggling students? Is a very domain-specific tool such as source code anal-ysis really required to notice that a student is failing to learn a concept, or can we simply identify that the student keeps returning to sections of material that discuss that concept when most of his or her peers no longer need to refer to that section?
It is the authors’ view that a further study should be conducted to find out a set of learning outcome predictors that are as general and simple as possible. We hypothesize that such a minimal set of features would achieve a very good generalizability between subjects and thus make it easier for educators in any field where on-line material is used to notice struggling students and take suitable actions.
4.5
Limitations
The methods used in and the results reported by this study are not without limitations. This sections overviews the most crucial of these limitations.
4.5.1 Internal and External Validity.The model selection pro-cedure used in this study was specifically chosen so as to prevent issues of overfitting the model to the data. As the test data set was
kept completely separate from the data set used in model selection, there is no possibility of the model selection having overfitted to the test data. As such, the procedure is expected to generalize well to other data sets. Furthermore, the models in this study were learned using a rather limited set of data; it is reasonable to expect that a larger quantity of data – perhaps from multiple instances of the same course – would produce better results.
As the data comes from a single course, there exists a possible external validity issue regarding whether the results or the model will generalize to other, different, populations. For example, the participants’ age distribution is rather narrow, and the participants are all university students in a country with a largely homogeneous population. Furthermore, as all the participants have specifically chosen to attend the course – they are either computer science majors of their own volition, or voluntarily taking a course outside of their major – questions of participant self-selection arise. These possible threats to the external validity of the results suggest that further study should be conducted to assess the generalizability of the methods and results presented herein.
A further threat to the internal validity of the study, regarding the reported scores of the models, is that the data used for the study does not include students who dropped out of the course prior to the final course exam. The inclusion of these students could affect the accuracies of the models. Additionally, the material used in this study was constructed so that the assignment prompts were embedded within the reading material. It is unclear how a different kind of setup – e.g. chapter-final assignment prompts or completely separate assignment prompt documents – would change the results. 4.5.2 Data Validity. As the data is collectedin-situon the user’s computer, we surrender control of the collection process to the user. As such, the user is able – if they wish – to either block the data collection completely or even to send malicious data to the server. This is an inherent issue of any client-side data collection scheme and as such is unlikely to be solved easily.
4.6
Future Work
As noted above, future work should try to identify a minimal set of learning outcome predictors and investigate whether such a minimal set can generalize well to the educational field in general. Online learning material movement data is a prime target for sequential pattern mining as it is essentially a sequential list of events. The fact that each event contains a range of visible elements rather than a singular value can complicate sequential pattern mining, but is not prohibitive. As a concrete example, one could determine which sequences of type “start exercise⇒view element X⇒finish exercise” were the most common to determine which sections of the material map to which exercises. This data could then be used, for example, to facilitate social navigation by providing users links to the material locations most commonly visited by previous students while working on the same exercise.
A similar approach to that mentioned above could be used to expand information about what knowledge each assignment re-quires from the student. If such a transfer or mapping was possible, it could potentially be used with student modeling algorithms to automatically detect which knowledge components – sections of the material – are related to which course assignments.
It should be investigated whether students fall into movement archetypes that correspond to certain styles or patterns of move-ment. If such archetypes were to exist, their relations to learning outcomes should be investigated. The feasibility of this approach is supported by research from Amershi & Conati [3] who clustered student actions in a learning environment to identify strategies that resulted in better or worse than average learning outcomes.
Finally, the models proposed herein are unable to distinguish deliberate practice – which has been connected to becoming an expert [14] – from simply browsing Facebook on the phone while having the material open. The ability to distinguish between these two could feasibly improve the predictive power of the models drastically. At the same time, identifying deliberate practice from “idling” without drastically violating the privacy of the participants
is an open problem.
5
CONCLUSIONS
In this study we use element-level usage data that was collected from the online learning material of an university level introductory programming course for prediction of student learning outcomes. We answer the concrete research questions: (1) “Can one predict student performance based on the relative amounts of time each ele-ment of the online learning material is visible on students’ screens?” and (2) “How far into the course must data be collected before these models achieve useful accuracy levels?”.
The results show the the answer to the first research question is affirmative: based on just three to four weeks of data contain-ing information on what elements of the online course material were visible on each student’s screen at what times, it is possible to identify at-risk students with some accuracy. Furthermore, it seems possible to predict student programming assignment scores and total course scores with a somewhat high accuracy. Simultaneously, models based on material usage statistics showed some light pre-dictive power in predicting student exam scores. Curiously, better predictions were observed when predicting the total score, which is a simple sum of the programming and exam scores than when predicting either of the component scores.
As for the second research question, our results show indications that the models reach a certain “maturity” with regard to accuracy once data from the first three or four weeks of the seven week course are available. That is, providing more data beyond this point only results in slight improvements in predictive power.
As our models are built on effort-normalized data – data from which any indication of absolute study time has been removed – our model is not based on how long students study, but rather on what sections or elements of the material they study.
The fact that the models investigated herein were successful raises questions of whether extremely complicated student models are necessary in the first place: it might be possible to predict student learning outcomes with very high accuracies based on very few simple and non-intrusive metrics that can be collected in-situ and in a completely online learning environment and that do not require installing software on students’ computers.
ACKNOWLEDGMENTS
This work was partially funded by Academy of Finland under grant number 303694Skills, education and the future of work. This work is based on the MSc thesis [29] of the first author.
REFERENCES
[1] Philip C Abrami, Bette Chambers, Sylvia d’Apollonia, Mona Farrell, and Christina De Simone. 1992. Group outcome: The relationship between group learning out-come, attributional style, academic achievement, and self-concept.Contemporary Educational Psychology17, 3 (1992), 201–210.
[2] Alireza Ahadi, Raymond Lister, Heikki Haapala, and Arto Vihavainen. 2015. Exploring machine learning methods to automatically identify students in need of assistance. InProc. of the 11th Annual International Conference on International Computing Education Research. ACM, 121–130.
[3] Saleema Amershi and Cristina Conati. 2009. Combining unsupervised and super-vised classification to build user models for exploratory.Journal of Educational Data Mining1, 1 (2009), 18–71.
[4] Vladimir Bacvanski and Jürgen Börstler. 1997. Doing Your First OO Project: OO Education Issues in Industry and Academia. InAddendum to the 1997 ACM SIGPLAN Conference on Object-oriented Programming, Systems, Languages, and Applications (Addendum) (OOPSLA ’97). ACM, 93–96.
[5] Albert Bandura. 1977. Self-efficacy: toward a unifying theory of behavioral change.Psychological review84, 2 (1977), 191.
[6] Debasish Basak, Srimanta Pal, and Dipak Chandra Patranabis. 2007. Support vector regression.Neural Information Processing-Letters and Reviews11, 10 (2007), 203–224.
[7] Brett A Becker. 2016. A new metric to quantify repeated compiler errors for novice programmers. InProc. of the 2016 ACM Conference on Innovation and Technology in Computer Science Education. ACM, 296–301.
[8] Christopher JC Burges. 1998. A tutorial on support vector machines for pattern recognition.Data mining and knowledge discovery2, 2 (1998), 121–167. [9] Adam S Carter, Christopher D Hundhausen, and Olusola Adesope. 2015. The
nor-malized programming state model: Predicting student performance in computing courses based on programming behavior. InProc. of the 11th annual International Conference on International Computing Education Research. ACM, 141–150. [10] Rich Caruana and Alexandru Niculescu-Mizil. 2006. An empirical comparison of
supervised learning algorithms. InProc. of the 23rd international conference on Machine learning. ACM, 161–168.
[11] Karo Castro-Wunsch, Alireza Ahadi, and Andrew Petersen. 2017. Evaluating Neural Networks As a Method for Identifying Students in Need of Assistance. In Proc. of the 2017 ACM SIGCSE Technical Symposium on Computer Science Education (SIGCSE ’17). ACM, 111–116.
[12] Cynthia L Corritore and Susan Wiedenbeck. 1991. What do novices learn during program comprehension?International Journal of Human-Computer Interaction 3, 2 (1991), 199–222.
[13] Corinna Cortes and Vladimir Vapnik. 1995. Support-vector networks.Machine learning20, 3 (1995), 273–297.
[14] K Anders Ericsson, Ralf T Krampe, and Clemens Tesch-Römer. 1993. The role of deliberate practice in the acquisition of expert performance.Psychological review 100, 3 (1993), 363.
[15] Manuel Fernández-Delgado, Eva Cernadas, Senén Barro, and Dinani Amorim. 2014. Do we need hundreds of classifiers to solve real world classification problems.J. Mach. Learn. Res15, 1 (2014), 3133–3181.
[16] Sally Fincher, Anthony Robins, Bob Baker, Ilona Box, Quintin Cutts, Michael de Raadt, Patricia Haden, John Hamer, Margaret Hamilton, Raymond Lister, and others. 2006. Predictors of success in a first programming course. InProc. of the 8th Australasian Conference on Computing Education-Volume 52. Australian Computer Society, Inc., 189–196.
[17] Sandra L Fisher and J Kevin Ford. 1998. Differential effects of learner effort and goal orientation on two learning outcomes.Personnel Psychology51, 2 (1998), 397–420.
[18] John H Flavell. 1979. Metacognition and cognitive monitoring: A new area of cognitive–developmental inquiry.American psychologist34, 10 (1979), 906. [19] J Kevin Ford, Eleanor M Smith, Daniel A Weissbein, Stanley M Gully, and Eduardo
Salas. 1998. Relationships of goal orientation, metacognitive activity, and practice strategies with learning outcomes and transfer.Journal of applied psychology83, 2 (1998), 218.
[20] Mark Guzdial. 1995. Centralized Mindset: A Student Problem with Object-oriented Programming. InProc. of the 26th SIGCSE Technical Symposium on Computer Science Education (SIGCSE ’95). ACM, 182–185.
[21] Petri Ihantola, Arto Vihavainen, Alireza Ahadi, Matthew Butler, Jürgen Börstler, Stephen H Edwards, Essi Isohanni, Ari Korhonen, Andrew Petersen, Kelly Rivers, and others. 2015. Educational data mining and learning analytics in programming: Literature review and case studies. InProc. of the 2015 ITiCSE on Working Group Reports. ACM, 41–63.
[22] Matthew C Jadud. 2006. Methods and tools for exploring novice compilation behaviour. InProc. of the 2nd international workshop on Computing education research. ACM, 73–84.
[23] Young-Ju Joo, Mimi Bong, and Ha-Jeen Choi. 2000. Self-efficacy for self-regulated learning, academic self-efficacy, and Internet self-efficacy in Web-based instruc-tion.Educational Technology Research and Development48, 2 (2000), 5–17. [24] Gregor Kennedy and Quintin Cutts. 2005. The association between students’ use
of an electronic voting system and their learning outcomes.Journal of Computer Assisted Learning21, 4 (2005), 260–268.
[25] Juho Leinonen, Krista Longi, Arto Klami, and Arto Vihavainen. 2016. Automatic inference of programming performance and experience from typing patterns. InProc. of the 47th ACM Technical Symposium on Computing Science Education. ACM, 132–137.
[26] Leo Leppänen, Juho Leinonen, and Arto Hellas. 2016. Pauses and spacing in learning to program. InProc. of the 16th Koli Calling International Conference on Computing Education Research. ACM, 41–50.
[27] Leo Leppänen, Juho Leinonen, Petri Ihantola, and Arto Hellas. 2017. Using and Collecting Fine-grained Usage Data to Improve Online Learning Materials. In Proceedings of the 39th International Conference on Software Engineering: Software Engineering and Education Track (ICSE-SEET ’17). IEEE Press, 4–12.
[28] Mark R Lepper and Diana I Cordova. 1992. A desire to be taught: Instructional consequences of intrinsic motivation.Motivation and emotion16, 3 (1992), 187– 208.
[29] Leo Leppänen. 2017. Using element-level website usage data to improve online learning materials and predict learning outcomes. Master’s thesis. University of Helsinki, Helsinki, Finland.
[30] Soohyun Nam Liao, Daniel Zingaro, Michael A Laurenzano, William G Griswold, and Leo Porter. 2016. Lightweight, Early Identification of At-Risk CS1 Students. In Proc. of the 2016 ACM Conference on International Computing Education Research. ACM, 123–131.
[31] Leah P Macfadyen and Shane Dawson. 2010. Mining LMS data to develop an “early warning system” for educators: A proof of concept.Computers & education 54, 2 (2010), 588–599.
[32] Christoph Mengelkamp and Maria Bannert. 2010. Accuracy of confidence judg-ments: Stability and generality in the learning process and predictive validity for learning outcome.Memory & cognition38, 4 (2010), 441–451.
[33] Craig S. Miller and Amber Settle. 2016. Some Trouble with Transparency: An Analysis of Student Errors with Object-oriented Python. InProc. of the 2016 ACM Conf. on International Computing Education Research (ICER ’16). ACM, 133–141. [34] Behrouz Minaei-Bidgoli, Deborah A Kashy, Gerd Kortemeyer, and William F
Punch. 2003. Predicting student performance: an application of data mining methods with an educational web-based system. InFrontiers in education, 2003. FIE 2003 33rd annual, Vol. 1. IEEE, T2A–13.
[35] Andrew Petersen, Jaime Spacco, and Arto Vihavainen. 2015. An exploration of error quotient in multiple contexts. InProc. of the 15th Koli Calling Conference on Computing Education Research. ACM, 77–86.
[36] Chris Piech, Mehran Sahami, Daphne Koller, Steve Cooper, and Paulo Blikstein. 2012. Modeling how students learn to program. InProc. of the 43rd ACM technical symposium on Computer Science Education. ACM, 153–160.
[37] Leo Porter, Daniel Zingaro, and Raymond Lister. 2014. Predicting student success using fine grain clicker data. InProc. of the 10th annual conference on International computing education research. ACM, 51–58.
[38] Steven B Robbins, Kristy Lauver, Huy Le, Daniel Davis, Ronelle Langley, and Aaron Carlstrom. 2004. Do psychosocial and study skill factors predict college outcomes? A meta-analysis. (2004).
[39] Cristobal Romero, Pedro G. Espejo, Amelia Zafra, Jose Raul Romero, and Sebastian Ventura. 2013. Web usage mining for predicting final marks of students that use Moodle courses.Computer Applications in Engineering Education21, 1 (2013), 135–146.
[40] Dale H Schunk. 1981. Modeling and attributional effects on children’s achieve-ment: A self-efficacy analysis.J. of educational psychology73, 1 (1981), 93. [41] Alex J Smola and Bernhard Schölkopf. 2004. A tutorial on support vector
regres-sion.Statistics and computing14, 3 (2004), 199–222.
[42] Elliot Soloway and Kate Ehrlich. 1984. Empirical studies of programming knowl-edge.IEEE Transactions on software engineering5 (1984), 595–609.
[43] Arto Vihavainen. 2013. Predicting students’ performance in an introductory programming course using data from students’ own programming process. In 13th Int. Conf. on Advanced Learning Technologies (ICALT). IEEE, 498–499. [44] Christopher Watson, Frederick WB Li, and Jamie L Godwin. 2013. Predicting
performance in an introductory programming course by logging and analyzing student programming behavior. InAdvanced Learning Technologies (ICALT), 2013 IEEE 13th International Conference on. IEEE, 319–323.
[45] Susan Wiedenbeck, Deborah Labelle, and Vennila NR Kain. 2004. Factors affecting course outcomes in introductory programming. In16th Annual Workshop of the Psychology of Programming Interest Group. 97–109.
[46] David H Wolpert, William G Macready, and others. 1995.No free lunch theo-rems for search. Technical Report. Technical Report SFI-TR-95-02-010, Santa Fe Institute.