NBER WORKING PAPER SERIES
WHEN DOES A MUTUAL FUND'S TRADE REVEAL ITS SKILL?
Zhi Da
Pengjie Gao
Ravi Jagannathan
Working Paper 13625
http://www.nber.org/papers/w13625
NATIONAL BUREAU OF ECONOMIC RESEARCH
1050 Massachusetts Avenue
Cambridge, MA 02138
November 2007
We thank Robert Battalio, Roger Edelen, Craig Holden, Paul Irvine, Tim Loughran, Rick Mendenhall,
David Musto, Lubos Pástor, Paul Schultz, Clemens Sialm, Laura Starks, Sheridan Titman, Charles
Trzcinka, Lance Young and seminar participants at Barclays Global Investors, FRA 2007 Annual Meeting,
IU/ND/Purdue Finance Symposium, Northwestern University, University of Illinois at Urbana-Champaign,
University of Michigan, Tilburg University, and the 4th Vienna Symposium on Asset Management
for comments. An earlier version of this paper was titled .Informed Trading, Liquidity Provision and
Stock Selection by Mutual Funds. Patricia Andersen provides excellent editorial support. The views
expressed herein are those of the author(s) and do not necessarily reflect the views of the National
Bureau of Economic Research.
© 2007 by Zhi Da, Pengjie Gao, and Ravi Jagannathan. All rights reserved. Short sections of text,
not to exceed two paragraphs, may be quoted without explicit permission provided that full credit,
including © notice, is given to the source.
When Does a Mutual Fund's Trade Reveal its Skill?
Zhi Da, Pengjie Gao, and Ravi Jagannathan
NBER Working Paper No. 13625
November 2007, Revised April 2008
JEL No. G1,G11,G12,G14,G23
ABSTRACT
We conjecture that a mutual fund manager with superior stock selection ability is more likely to benefit
from trading in stocks affected by information-events. Taking the probability of informed trading (PIN,
Easley, Kiefer, O'Hara, and Paperman, 1996) to measure the amount of informed trading in a stock,
and inferring mutual fund trades from a large sample of mutual fund holdings, we provide empirical
support for the conjecture. Funds trading high-PIN stocks exhibit superior performance on average,
and superior performance that is more likely to persist. The findings are not due to price momentum
or the higher returns earned by high-PIN stocks on average. Conclusions remain the same after testing
for alternative measures for the amount of informed trading. Decomposing a fund's stock selection
ability into "informed trading" and "liquidity provision" adds further insight into fund's underlying
strengths. Impatient informed trading is a significant source of alpha for funds trading high-PIN stocks,
while liquidity provision is more important as a source of alpha for funds trading low-PIN stocks.
Zhi Da
University of Notre Dame
239 Mendoza College of Business
Notre Dame, Indiana 46556-5646
[email protected]
Pengjie Gao
Department of Finance
Mendoza College of Business
University of Notre Dame
Notre Dame, Indiana 46556-5646
[email protected]
Ravi Jagannathan
J.L. Kellogg Graduate School of Management
2001 Sheridan Road
Leverone/Anderson Complex
Evanston, IL 60208-2001
and NBER
As of 2006, US mutual funds collectively managed $10 trillion, and almost $6 trillion of that in equity funds. A signi…cant portion of this amount is actively managed. According to a survey by the Mutual Fund Institute, in 2006 alone, US mutual funds bought and sold common stocks worth over $6 trillion. Over 1980 to 2006, investors paid at least0:67percent of portfolio value per year to the active portfolio managers (French, 2008). Naturally, investors want to identify fund managers with superior skills and to understand how these managers add su¢ cient value to justify their fees. Ultimately, an active mutual fund manager’s success derives from his or her superior skill in processing valuation-relevant information about a stock, a skill that should allow the identi…cation of potential mispricing. Thus, it is reasonable to expect such skills to be more valuable when stocks the manager can invest in are a¤ected by more value-relevant information events. To the extent that rational managers have the option not to trade such stocks when they know that they do not have an advantage in analyzing the information a¤ecting a stock, we should expect to …nd that managers who choose to trade in this case earn higher returns on average.
To examine this conjecture we need (1) a measure of the number of information events a¤ecting a stock during a given period; and (2) information that facilitates identifying a manager’s trades in those stocks during those periods. We use the probability of informed trading (P IN) - proposed by Easley, Kiefer, O’Hara, and Paperman (1996) - to proxy for the extent of information events a¤ecting a stock. We infer a mutual fund’s trades by comparing its quarter-end holdings with its holdings at the end of the quarter before.
Using quarterly holdings data from 1983 to 2004 for a large sample of US active equity mutual funds, we …nd that funds trading high-P IN stocks indeed outperform those trading low-P IN stocks. That is, if we sort funds according to the averageP IN of stocks they trade during quarter t (de…ned as trade_P IN), funds in the top trade_P IN decile outperform those in the bottom decile by more than 50 basis points per quarter on a risk-adjusted basis during quartert+ 1. The risk-adjusted performance does not depend on whether we adjust for risk using a factor model or a holding-based characteristics model.
Easley, Hvidkjaer, and O’Hara (2002) document that high-P IN stocks earn higher returns –for convenience we will refer to this phenomenon as compensation forP IN risk. Our …ndings, however, are not driven by this phenomenon for the several reasons. First, we obtain very similar results after we control for P IN risk when we examine risk adjusted-returns. Second, our conclusions do
not change when we replace P IN with several alternative measures of the amount of information a¤ecting a stock. To account for the illiquidity associated with high-P IN stocks, we examine the information asymmetry component of theP IN (adjP IN; see Duarte and Young, 2007). To ensure that our results are not driven by the correlation between trading volume and P IN, we directly examine abnormal turnover in stock trading (aturn; see Chordia, Huh, and Subrahmanyam, 2006). We also consider the information asymmetry component of the bid-ask spread (theta; see Madhavan, Richardson and Roomans, 1997) which captures the impact of information events on stock price. Third, stocks recently bought by mutual funds outperform those sold by mutual funds, although they have very similarP IN measures.
We …nd that the ability of trade_P IN to predict future mutual fund performance is not driven by its correlation with other fund characteristics. In a cross-sectional regression framework, trade_P IN provides additional explanatory power on the next-quarter risk-adjusted mutual fund return even in the presence of many other fund level characteristics. We show that such predictabil-ity is not due to potential momentum trading by mutual funds.
While fund managers who choose to trade high-P IN stocks on average outperform the rest, we would expect outperformance to be concentrated among managers who in fact have superior skills. Using a four-factor-adjusted fund return or alpha as a proxy for manager skill, we provide supporting evidence for such conjecture. Sorting on trade_P IN variable generates signi…cant spreads in future fund performance only among funds with large alpha. In particular, amongst funds associated with high alphas, only those that also trade high-P IN stocks during quarter t produce positive and signi…cant alpha of 33 basis points during quartert+ 1 after accounting for fees and expenses. Moreover, to the extent that a manager’s skills are likely to persist for some time, past superior performance is more likely to be an indication of future performance for a manager who attained that performance by trading high-P IN stocks. Consistent with this conjecture, we …nd that sorting on fund alphas in quartertwithin funds with hightrade_P IN generates a much wider spread in fund risk-adjusted returns in quartert+ 1(91basis points on average). Controlling forP IN risk does not alter our results in any signi…cant way.
We also investigate the speci…c channels through which a fund manager’s trades add value. In general, how a manager with superior skill trades to add value will depend on how long it takes for the market to realize that the manager is correct. Based on how long the informational advantage
lasts, a manager’s trades can be classi…ed into three types: long-term value investing, medium-term informed trading, and short-term liquidity provision. Medium-term informed trading, in contrast to long-term value investing and short-term liquidity provision, is likely to demand liquidity because the value of information erodes quickly and the timely execution becomes important.
To attribute mutual fund performance to these di¤erent styles of investment, we use a characteristics-based performance measure, characteristic selectivity (CS), proposed by Daniel, Grinblatt, Titman, and Wermers (DGTW, 1997).1 CS, computed using quarterly reported stock holdings by mutual funds, measures the extent to which managers can select stocks that outperform the average stocks with similar characteristics. Because mutual fund stock holdings data are available only at in-frequent intervals (quarterly in most cases), it is di¢ cult to assess a manager’s skills when that manager trades actively in between two holding reporting dates.2 We …nd nevertheless that a mu-tual fund’s recent trades inferred from its quarterly holdings changes still reveals useful information about how a manager adds value.
We decompose theCSmeasure for a given quarter into three components: (1) anold component that captures value-added from the fund’s (previous) investments prior to the preceding quarter; (2) a trade component that captures the value-added from the fund’s trades during the previous quarter; and (3) a smalladjustment component that results from preceding quarter’s net fund ‡ow. The trade component can then be decomposed further into an informed trading component and a liquidity provision component. This latter decomposition is motivated by the evidence that stock-level aggregate order imbalance serves as a good measure of the direction of liquidity needs on the underlying stock (see Chordia and Subrahmanyam, 2004, among others). When managers trade in the same direction as the aggregate market order imbalance on a stock, they demand liquidity. Such trades are therefore likely to be driven by information and are classi…ed as informed trading. When fund managers trade in the opposite direction of the aggregate market order imbalance, they e¤ectively supply liquidity, and such trades are classi…ed as liquidity provision. We validate
1We abstract away from measuring the market timing ability of mutual funds in this paper. See Ferson and Schadt (1996), and Mamaysky, Spiegel, and Zhang (2007) for the discussion on empirical methods to detect mutual fund market timing.
2For instance, Kacperczyk, Sialm and Zheng (2007) and Elton, et al. (2006) show that “unobservable”actions (or high-frequency turnovers) by mutual funds could be signi…cant for some funds. Campbell, Ramadorai and Schwartz (2007) attempts to infer institutional transactions within a given quarter by selecting trade sizes that best match quarterly holdings changes. Relying on a unique regulation governing mutual fund trade disclosure in Canada, Christo¤ersen, Keim and Musto (2006) investigate essentially all trades of 210 Canadian mutual funds between 2001 and 2003.
our decomposition approach by applying it to two speci…c cases before applying it to portfolios of active mutual funds sorted by thetrade_P IN variable.
We …nd that a greater proportion of the CS measure for high trade_P IN funds (50 basis points) comes from positions taken through trades made during the previous quarter; the trade component is 31:2 basis points (t-value of 2:83). We also …nd that the stocks a fund bought as well the stocks it sold had similarP IN values and both added value in the next quarter. Further, we document that informed trading is more likely to add value when the fund is trading stocks associated with more information events. The informed trading component in general increases with trade_P IN, and is positive and signi…cant (20:4 basis points with t-value of 2:25) only for funds in the top trade_P IN decile. Liquidity provision, however, is more likely to be detected when the fund is trading stocks associated with fewer information events. The liquidity provision component is positive and signi…cant (16:2 basis points witht-value of 2:57) only for funds in the bottom trade_P IN decile, where the risk of adverse selection in trading is low.
Our results are relevant for two important strands of literature in …nance: the literature on mu-tual fund performance, and the literature on market microstructure. The early literature on mumu-tual fund performance evaluation …nds that most managed portfolios earn close to zero or negative risk-adjusted returns, especially after taking fees into account.3 This is consistent with Berk and Green’s (2004) observation that competition among investors for a given supply of managerial talents of fund managers will drive after-fee, risk adjusted performance to zero. More recent studies that use of quarterly reports of mutual fund stock holdings …nd that active managers possess considerable stock-picking abilities.4 On average, after adjusting for stock characteristics but before deducting fees and expenses, stocks held by actively managed mutual funds outperform their benchmarks, and stocks bought by mutual funds tend to outperform those sold by mutual funds. Further, several mutual fund holding characteristics appear to correlate with better fund performance, including funds that follow aggressive growth and growth styles (Daniel, Grinblatt, Titman, and Wermers, 1997); funds that hold the stocks of …rms whose headquarters are located geographically close to the fund’s headquarters (Coval and Moskowitz, 2001); funds that have greater industry concentration in their holdings (Kacperczyk, Sialm, and Zheng, 2005); funds that have less diversi…cation in their
3
See Jensen (1968), Brown and Goetzmann (1995), Gruber (1996), and Carhart (1997).
4See Grinblatt and Titman (1989, 1993), Daniel, Grinblatt, Titman and Wermers (1997), Wermers (1999), Chen, Jegadeesh, and Wermers (2000), Sias, Starks and Titman (2006), and Schultz (2007)
holdings (Baks, Busse, and Green, 2006); funds that show greater deviations from passive indexes or greater proportions of “active shares” (Cremers and Petajisto, 2006); and funds that have less dependency on analyst recommendations (Kacperczyk and Seru, 2007). In addition, funds that are smaller in size perform better after controlling for fund family size (Chen, Hong, Huang, and Kubik, 2004).
We contribute to the literature by building on the insights in the market microstructure litera-ture that trades reveal information associated with a stock, and that such information can help to di¤erentiate various trading motives and ultimately identify skillful managers. Moreover, as provid-ing liquidity requires specialization and may well require a particular type of talent, we decompose fund managers’stock selection ability into a liquidity-demanding informed trading component and a liquidity provision component. We believe that such a decomposition will help us better under-stand the strengths of an active portfolio manager, and the extent to which such strengths will continue to be of value in the future.
The rest of the paper is organized as follows. We describe our data sources and the sample in section 1. We provide evidence that the amount of information events associated with stocks traded by fund managers reveals their skills in section 2. We then show how to decompose the stock selection ability of a mutual fund manager into its informed trading, liquidity provision, and residual components in section 3. We conclude in section 4. Appendix A contain brief descriptions on the various measures of information events we use. Appendix B illustrates our decomposition approach with a numerical example and validates the approach empirically.
1
Data and Sample Construction
We use data from several sources. The mutual fund holding data are from the CDA/SpectrumS12 mutual fund holding database, which collects holding information from N30-D …lings with the US Securities and Exchange Commission (SEC). A detailed description of this database can be found in Wermers (1999). We exclude index funds from most of our analysis.5 Between 1983 and 2004, there were about 11 domestic equity only index funds identi…ed each quarter on average in the holding database. Following the standard practice in the mutual fund literature, we also exclude all
closed-5Speci…cally, we exclude a fund if its name contains any of the following: “INDEX”, “INDE”, “INDX”, “S&P”, “DOW JONES”, “MSCI” or “ISHARE”.
end funds, international funds, sector funds, bond funds, and domestic hybrid funds (including life-cycle and life-style funds), based on self-reported fund style in the CDA/Spectrum database. Thus, we retain only those funds that self-report as aggressive growth (AGG), growth (GRO), or growth and income (GNI). To ensure that the funds we examine are reasonably active, we examine funds that traded at least ten stocks with a turnover of at least ten percent of its holdings during the previous quarter. This …lter eliminates about ten percent of all fund/quarter observations. Finally, we include only those fund/quarter observations for which the fund holdings at the end of the previous two quarters are available, so that holding changes can be computed over consecutive quarters. We obtain information on after-fee performance and other fund characteristics from the Center for Research in Security Prices (CRSP) Survivor-Bias Free US Mutual Fund database.
The CDA/Spectrum mutual fund holding data are matched to the CRSP Mutual Fund data using the MFLINKS database developed by the Wharton Research Data Service (WRDS) and Pro-fessor Russ Wermers. An appealing feature of the MFLINKS database is that it allows mapping dif-ferent share classes of the same fund, which are recorded as distinct funds in the CRSP Mutual Fund database, to the corresponding mutual fund holdings data in the CDA/Spectrum database. For multiple share classes in CRSP that correspond to the same fund in the CDA/Spectrum database, we aggregate returns of those share classes into one large portfolio’s return by equal-weighting or value-weighting (using total net asset values). The results for equal-weighting and value-weighting are similar, so we report the results for the former for brevity.
Stock data are from the CRSP. We include all common stocks (CRSP share codes 10 and 11) traded on the NYSE, the AMEX, and the Nasdaq (CRSP exchange code 1, 2and 3). Accounting information is from the COMPUSTAT database. To link COMPUSTAT and CRSP, we use CRSP-LINK produced by CRSP. The tick-by-tick stock transaction data are from the ISSM (1983 - 1992) and TAQ (1993 - 2004) databases.
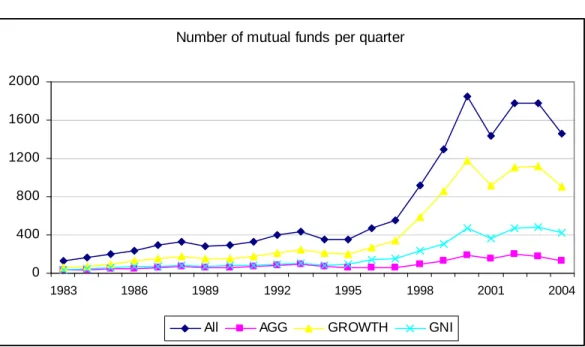
Overall, there are 4;654 distinct funds in our sample for the period 1983 through 2004. On average, there are 701 distinct funds every quarter. The number of funds per quarter increases from 134in1983to about 1;700toward the end of the sample, as shown in Figure 1. About 61% of the funds in our sample are self-reported as growth funds; about 26% are reported as growth and income (GNI); and the remaining13% are reported as aggressive growth (AGG).
fund characteristics from the CRSP mutual fund database. These characteristics include: age(age of the fund in months since inception, in terms of percentile rank in the cross section); turnover (turnover rate of the fund); expense (expense ratio of the fund); T N A (total net assets under management by the fund in millions US$); and pct_f low (net fund ‡ows in percent, de…ned as
T N A(t) T N A(t 1) [1+Ret(t 1;t)]
T N A(t 1) ).
6
Second, we aggregate stock characteristics at the fund level by value-weighting them for stocks held by the fund using the quarter-end dollar values of the holdings. These characteristics include: f und_holding (average percentage of total number of shares outstanding of stocks held by the fund); f und_size(average market capitalization of stocks held by the fund, in billions of dollars); f und_bm (average book-to-market ratio of stocks held by the fund); f und_mom (average past one-year return on stocks held by the fund); andf und_amihud(average Amihud (2002) illiquidity measure, in terms of percentile rank in the cross section, of stocks held by the fund).7
To evaluate mutual fund performance, we use both factor-adjusted returns and holding-based characteristics-adjusted returns performance. Our …rst performance measure is based on the Carhart (1997) four-factor model, which adds to the Fama-French three-factor model (1993) a momentum factor. In particular, for each mutual fund each month, we estimate the following rolling-window regression using monthly data from month (t 36) to (t 1):
Ri;t Rrf;t= + 1M KT RFt+ 2SM Bt+ 3HM Lt+ 4U M Dt+ i;t (1)
whereRiis the mutual fundi’s returnafter fees and expenses;Rrf is the risk-free rate;M KT RF is the CRSP value-weighted market excess return over the risk-free rate;SM Bis the small-minus-big (SMB) factor;HM Lis the high-minus-low (HML) factor; M OM is the momentum factor.8
To ensure our estimation is relatively precise, we impose the constraint that there must be at least 24 months’worth of mutual fund return data available for estimation prior to month (t). That is, we require the fund must have survived at least two years before we estimate the regression.
6We use percentile age ranks to remove a time-series (increasing) trend in the age variable. 7
The Amihud (2002) illiquidity measure is de…ned as the average ratio between absolute daily return and daily dollar volume. We use percentile Amihud ranking for two reasons. First, there is a time-series (downward) trend in the Amihud measure due to an increase in trading volume; and second, the Amihud measure may be extreme and subject to outliers. Using percentile ranking alleviates these issues.
8
The return factors are taken from the Kenneth French’s Web site: http://mba.tuck.dartmouth.edu/pages/faculty/ken.french/Data Library.
For month (t), we use the estimated factor loadings in the prior 36-month rolling window and the current factor realizations to adjust the mutual fund excess return over the risk-free rate and obtain the four-factor adjusted-alpha, or:
bi;t = (Ri;t Rrf;t)
h
b1M KT RFt+b2SM Bt+b3HM Lt+b4U M Dt
i
(2)
We sum across the four-factor adjusted-alphas within a quarter to obtain the mutual fund’s quar-terly four-factor adjusted-return.9
Our second performance measure is based on the mutual fund holdings. Daniel, Grinblatt, Titman and Wermers (DGTW, 1997) and Wermers (2004) develop a characteristic selectivity (CS) measure to detect whether managers are able to select stocks that outperform average stocks with similar characteristics. We examine the actual stock holdings of the mutual fund and compute its CS measure during quarter t+nas:
CSt+n=
X
j
wj;t[Rj;t+n BRt+n(j; t)] (3)
whereRj;t+n is the return on stockj during quartert+n;wj;t is the dollar value weight of stockj held by the mutual fund at the end of quartert; andBRt+n(j; t)is the benchmark portfolio return during quartert+nmatching stockj at the end of quartertaccording to its size, book-to-market equity ratio, and past 12-month return.
2
Information Events and Mutual Fund Performance
An active mutual fund manager will be successful if he or she has superior skill in processing valuation-relevant information on a stock, which helps the manager identify potential mispricing. It is reasonable to expect that such skills add more value when stocks the manager can invest in are a¤ected by many value-relevant information events. Because rational managers can choose not to trade such stocks if they do not have an advantage in analyzing information, we should expect
9
We obtain the quarterly risk-adjusted return by aggregating the monthly risk-adjusted returns because the regressions over quarterly return using the past three years of data have only 12 data points, making estimation imprecise. This is also the approach used widely in the asset management industry (see, the Style Advisor’s User Guide developed by Zephyr’s Associates).
those managers who choose to trade them to earn superior returns on average.
To identify the occurrence of information events, we …rst make use of the Probability of Informed Trading measure (P IN), which is a market microstructure-based measure developed by Easley, Kiefer, O’Hara and Paperman (1996), and Easley, Kiefer and O’Hara (1997). In this model, there are two types of traders: informed traders and uninformed traders. In the absence of information events, only uninformed traders trade (primarily for liquidity reasons), and the order is equally likely to be a buy or a sell, resulting in an order imbalance measure close to zero on average, and a lowP IN measure. On the other hand, when there are signi…cant information events and informed traders also trade, there will be large amounts of buy ordersor sell orders (depending on the nature of the information), resulting in a large order imbalance and a highP IN measure.10 Empirically, P IN decreases with trading volume, size and analyst coverage, but increases with bid-ask spread, and insider and institutional ownership, consistent with it being a reasonable measure of private information events.
To estimate P IN, we use tick-by-tick transaction data for each quarter from 1983 to 2004, employing the entire three-month data to ensure precision of the estimates. A breakdown of our stock sample is provided in Panel A of Table 1. Overall, we have on average4110stocks withP IN measures in a quarter. Due to data availability from ISSM, NASDAQ stocks enter the sample in 1987 and account for a large portion of the sample afterwards. The mean of P IN measures in our sample is 25:8% with an associated standard deviation of 12:1%. The correlations between P IN and other stock characteristics are tabulated in Panel B of Table 1. Consistent with Easley, Hvidkjaer and O’Hara (2002), we …nd that high-P IN stocks are likely to be smaller and less liquid stocks. There is also some positive correlation betweenP IN and book-to-market ratio.
In each quarter and for each fund, we then compute atrade_P IN variable by value-weighting the P IN of stocks traded by the fund during the quarter using the dollar value of the trade. Speci…cally, we computetrade_P IN for thej-th mutual fund at the end of quartertin our sample
1 0
A more detailed description of the P IN measure and its estimation procedure is contained in Appendix B. Recently, theP INmeasure has been widely used in the empirical …nance literature, for instance, in Brown, Hillegeist and Lo (2004), Vega (2006), Bharath, Pasquariello and Wu (2006), and Chen, Goldstein and Jiang (2006).
as: trade_P INj;t= N X i=1 P INi;t di;j N X i=1 di;j (4)
where P INi;t is the estimated P IN measure of the i-th stock traded by mutual fund j during quarter t, and di;j is the absolute dollar value (using the stock price at the end of the quarter) of the holding change during quarterstas reported by the mutual fundj. Intuitively, funds that buy or sell more high-P IN stocks should have higher trade_P IN measures.
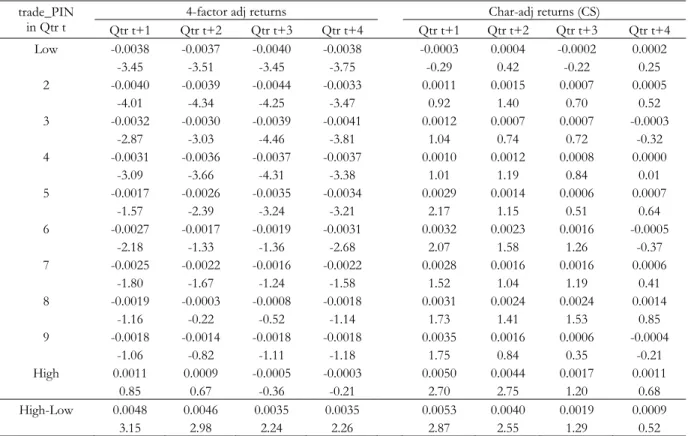
At the end of each quarter over 1983- 2004, we sort all mutual funds in the sample into deciles according to their trade_P INs and examine the four-factor adjusted and characteristics-adjusted mutual fund portfolio return in the next four quarters after portfolio formation within each decile. The results are summarized in Table 2.
The central message in Table 2 is that funds trading more high-P IN stocks outperform the funds trading low-P IN stocks. Using the four-factor model for risk adjustment, we …nd that funds in the toptrade_P IN decile outperform funds in the bottomtrade_P IN decile by48basis points in the next quarter with a t-value of 3:15. The return spread is 46 basis points in the second quarter with a t-value of 2:98. Return spreads are 35 basis points in the third quarter (t-value =2:24) and35basis points in the fourth quarter (t-value =2:26). Thus, within a one-year horizon after portfolio formation, funds within the highesttrade_P IN decile outperform the funds within the lowest trade-PIN decile by roughly 1:6 percentage points. In general, we see a positive relation between future risk-adjusted fund returns and the trade_P IN variable: the lowest …ve trade-PIN decile portfolios usually have large negative and statistically signi…cant factor-adjusted return during four quarters after portfolio formation; in contrast, the highest …ve trade-PIN decile portfolios have small negative and in most cases statistically insigni…cant factor-adjusted returns.
The results are similar for the characteristics-based risk adjustment. On average, the top trade-PIN decile portfolio of funds outperform the bottom decile portfolio by53 and 40 basis points per quarter in the …rst and second quarter after portfolio formation. These di¤erences are signi…cant at 1% signi…cance level. The return spreads between the top and bottom deciles attenuate to 19 to9 basis points in the third and fourth quarter.
The factor-adjusted mutual fund returns di¤er from the characteristics-adjusted mutual fund returns in several important aspects. First, while the four-factor adjusted-returns are after fees and expenses, the characteristic-adjusted returns are before fees and expenses. This di¤erence explains why the characteristic-adjusted returns are largely positive while the factor-adjusted returns are mostly negative. Second, the characteristics-adjusted returns are calculated from the reported mutual fund stock holdings at portfolio formation. Therefore, they do not account for the fact that mutual funds can change their stock holdings afterward. Perhaps the best way to interpret our characteristics-adjusted returns is to ask when the “mispricing” at the stock portfolio level, if any, dissipates. Interestingly, our evidence shows such dissipation occurs within two quarters. Finally, unlike the factor-adjusted fund returns, the characteristics-adjusted fund returns ignore possible cash, stock holdings below reporting threshold and other non-stock holdings of the mutual fund. However, such holdings are usually small, accounting for less than 5% of the fund holdings on average in our sample. In addition, factor-adjustment and characteristics-adjustment generate similar return spreads between high trade_P IN fund and low trade_P IN fund deciles. These results indicate that non-stock holdings by mutual funds are unlikely to introduce any systematic biases.
2.1 Fund Characteristics
How can we tell which funds are more likely to trade high-P IN stocks? In Panel A of Table 3, we tabulate the average fund-level characteristics across trade_P IN-sorted fund deciles. All characteristics are winsorized at the 1st and 99th percentiles to mitigate the e¤ect of outliers. We …nd that high-trade_P IN funds are typically associated with smaller fund size, younger fund age, higher expense ratio, and higher percentage fund in‡ow. High-trade_P IN funds tend to hold more stocks, and a greater amount of smaller and less liquid stocks. Their stock holdings as a percentage of total number of shares outstanding are also higher on average. Finally, their investment style more likely belongs to the aggressive growth or growth funds categories, compared to the low low-trade_P IN funds, which lean more toward the growth and income.
Some fund characteristics have been documented as associated with superior fund performance. For instance, Chen, Hong, Huang, and Kubik (2004) show that smaller funds are more likely to outperform. Schultz (2007) documents that small growth stocks held by mutual funds produce
abnormal returns on a characteristics-adjusted basis. The positive relation between the fund return and the trade_P IN variable could be entirely driven by other correlated fund characteristics. We examine this possibility in a cross-sectional regression framework. For each quarter in 1983 -2004, we regress the next-quarter factor-adjusted or characteristics-adjusted fund returns on several fund-level characteristics. All right-hand side variables (except the style dummies) are measured as deviations from their corresponding cross-sectional means, standardized to have unit variance. The regression intercept can be interpreted as the average e¤ect of the growth and income (GNI) fund style. Finally, the regression coe¢ cients are averaged across time, and the associated t -values are computed using Newey-West correction with lag terms of eight quarters to account for autocorrelations in the error terms. The regression results are reported in Panel B of Table 3. We …nd trade_P IN to be signi…cant even with the presence of other fund-level characteristics.
2.2 Robustness
We consider two alternative explanations for the empirical …ndings in the previous section, and we discuss them in turn.
PIN Risk?
Easley, Hvidkjaer, and O’Hara (2002) document that high-P IN stocks earn higher returns in order to compensate the agents (including mutual funds) for the risk of trading with informed traders. Since hightrade_P IN funds may also hold high-P IN stocks, the high returns they earn might simply be due to higher risk that is not captured by the four-factor model or the DGTW benchmark characteristics risk adjustment.
To address this concern, we …rst directly control for P IN risk in the risk adjustment. In the case of the factor-risk adjustment, we augment the benchmark four-factor model in (1) and (2) with a PIN risk factor -P INt. Similar to Easley, Hvidkjaer, and O’Hara (2004), we construct theP IN risk factor as the high-P IN decile portfolio return minus the low-P IN decile portfolio return. The resulting …ve-factor-adjusted mutual fund return thus controls for any systematic P IN risk.
In the case of characteristics-based risk adjustment, we construct characteristics benchmark portfolios by matching along size, book-to-market, past return, and P IN characteristics simulta-neously. At the end of each quarter, we sort all stocks into 81 portfolios using a 3 by 3 by 3 by 3 sequential sort based their sizes, book-to-market ratios, past 12 month returns and P IN
mea-sures (in that order). We then compute a new characteristics-adjusted fund return or characteristic selectivity measure (CS ) using the 81 benchmark portfolio returns in (3).
Both the …ve-factor-adjusted fund returns and the new characteristics-adjusted returns during the next quarter in the trade_P IN sorted fund deciles are presented in the …rst two columns of Panel A, Table 4. In general, the risk-adjusted fund returns increase with the trade_P IN measure. Funds trading high-P IN stocks perform better than those trading low-P IN stocks, even after directly controlling for P IN risk. The spread between the returns on the high-trade_P IN funds and the low-trade_P IN funds, after directly controlling for P IN risk, narrows slightly but remains positive and statistically signi…cant. The …ve-factor alpha spread is 45 basis points per quarter with at-value of2:85, while the new characteristics-adjusted return spread is43basis points per quarter with at-value of 2:11.
In a further check, we show that our results are robust to three alternative measures of the number of information events. We describe these three alternative measures in Appendix A. The …rst measure we consider is the asymmetric information component (adjP IN) of the modi…edP IN measure proposed by Duarte and Young (2007), which removes the illiquidity component of the original P IN measure. Duarte and Young (2007) show that the pricing ofP IN risk is driven by the illiquidity component, while adjP IN is not priced in the cross-section. The second measure is the information asymmetry component of the bid-ask spread (theta) as proposed in Madhavan, Richardson, and Roomans (1997). In addition to causing large order imbalance, informed-trading will also force the market maker to increase the bid-ask spread which can be captured by a higher theta measure. Finally, assuming that signi…cant information events usually lead to abnormal trading in a stock, we use a measure of abnormal turnover (aturn) calculated following Chordia, Huh and Subrahmanyam (2006).
To measure the average number of information events associated with stocks traded by mutual funds during a quarter, we compute trade_adjP IN,trade_theta, and trade_aturn in the same fashion astrade_P IN by replacing P IN with adjP IN,theta, andaturnin (4) accordingly. The results appear in Table 4, Panel A.
We obtain very similar results for these alternative measures of the amount of information. The next-quarter mutual fund risk-adjusted returns (using benchmark risk adjustment models) in general increase with these alternative measures. In addition, funds trading stocks associated with
more information events outperform funds trading stocks associated with fewer information events by about48basis points per quarter, similar to the results using the originalP IN measure. These risk-adjusted return spreads are highly signi…cant in the cases, and independent of whether we use factor adjustment or characteristics adjustment to account for risk. The fact that we obtain very similar results usingadjP IN instead ofP IN provides further support thatP IN risk is not driving our results.
Momentum Trading?
Grinblatt, Titman, and Wermers (1995) document that the majority of mutual funds use mo-mentum as a stock selection criterion, so momo-mentum e¤ects can signi…cantly in‡uence mutual fund performance (see also Carhart, 1997). Panel B of Table 4 shows that funds trading high-P IN stocks hold more recent winners than funds trading low-P IN stocks, resulting in a higherf und_momon average. A natural question arises: Could the di¤erence in the CS measures between funds trading high- and low-P IN stocks be driven by the momentum e¤ect? We believe that the answer is no for several reasons.
First, factor-adjusted and characteristics-adjusted fund returns are computed throughout after adjusting for momentum e¤ects. Second, when we regress the risk-adjusted fund returns on several fund characteristics in a cross-sectional regression, we …nd f und_mom to be insigni…cant, while trade_P IN is still highly signi…cant (see Panel B of Table 3), con…rming that the higher return associated with funds trading high-P IN is not driven by the momentum e¤ect. Finally, we directly examine the average past return characteristics of stocks bought, sold, and held by the funds separately in Panel B of Table 4. In each quarter and for each fund, we …rst compute the value-weighted average past one-year return of stocks in the “buy” portfolio (stocks recently bought by the fund), the “sell” portfolio (stocks recently sold by the fund), and the hold portfolio (stocks held by the fund throughout the quarter). These past returns are then averaged across funds in the same trade_P IN decile and across time. Although high-trade_P IN funds seem to buy more recent winners than low-trade_P IN funds (the average past one-year return in the “buy”portfolio is 34.3% for high-trade_P IN fundsvs. 20.9% for low-trade_P IN funds), high-trade_P IN funds also sell more extreme recent winners at the same time (the average past one-year return in the “sell” portfolio is 46.6% for high-trade_P IN funds); they thus are not momentum traders in the traditional sense. In addition, funds in trade_P IN deciles 7 to 9 seem to buy or hold even more
winners than funds in the top trade_P IN decile. If the momentum e¤ect drives the high CS measure, we would expect funds in trade_P IN deciles 7 to 9 to have higher risk-adjusted returns on average. This is clearly not the case.
2.3 PIN and Fund Manager Skill
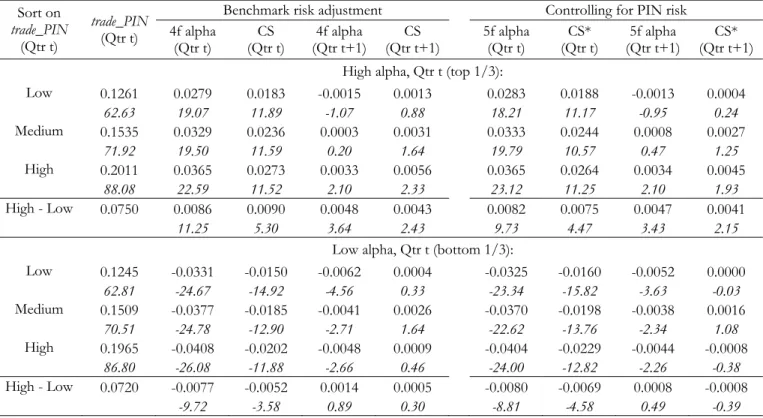
While fund managers who choose to trade high-P IN stocks outperform the other managers on average, we would expect outperformance to be concentrated among managers who in fact have superior skills. To test this conjecture, we use the four-factor-adjusted fund return or alpha as a proxy for manager skill. At the end of each quarter from 1983 through 2004, we …rst sort all mutual funds in the sample into three portfolios according to their alpha during the quarter. Within the high alpha fund portfolio (top one-third) and the low alpha fund portfolio (bottom one-third), we then further sort funds according to their trade_P IN variables during the quarter into three portfolios. The average next quarter four-factor-adjusted and characteristic-adjusted mutual fund returns are presented in Table 5, Panel A. We observe that funds with higher alphas this quarter continue to perform better in the next quarter. Both the factor-adjusted returns and the characteristics-adjusted returns are higher than returns of funds with low-alphas this quarter.
Perhaps more interestingly, sorting on the trade_P IN variable generates positive and signi…-cant spreads in future fund performance measures only among funds with high past alphas. Among the funds with high alphas, those trading high-P IN stocks outperform funds trading low-P IN stocks both during the current quarter and the next quarter. Their risk-adjusted return spread is 48 basis points (t-value =3:64) based on factor-adjusted returns and by 43 basis points (t-value = 2:43) based on characteristics-adjusted returns. Funds associated with high alphas that also trade high-P IN stocks produce positive and signi…cant alpha of 33 basis points next quarter, even after accounting for fees and expenses. In sharp contrast, among funds with low alphas, sorting on the trade_P IN variable does not generate much dispersion in future fund performance measures at all. In addition, during the current quarter, funds trading high-P IN stocks actually signi…cantly underperform funds trading low-P IN stocks, re‡ecting the possibility that fund managers who are overcon…dent have more to lose in trading high-P IN stocks. Overall, these results provide addi-tional support for our main hypothesis that skillful managers who can better analyze value-relevant information can add more value when trading stocks associated with more information events.
Panel B of Table 5 presents the results when we sort on trade_P IN …rst and fund alpha second. We …nd that sorting on fund alphas this quarter for funds with hightrade_P IN generates a much wider spread in fund risk-adjusted returns during both this quarter and the next quarter than within funds with low trade_P IN. Among funds that trade high-P IN stocks, funds that earn higher quarter t alphas have higher quarter t+ 1 alphas than funds that earn low quarter t alphas (91basis points on average witht-value of4:36), even after accounting for fees and expenses. Among funds that trade low-P IN stocks, the quarter t+ 1alpha spread between funds in the high-and low-quarter-t-alpha groups is only 38 basis points. The t-value of 2.43 is also much smaller, although still very signi…cant. Results in Panel B suggest that past fund alpha does a better job in separating talented managers from ordinary managers if we also examine the stocks they trade. Table 5 also presents the risk-adjusted mutual fund returns after directly controlling for P IN risk, and the results are very similar. Overall, the results indicate that talented managers indeed add more value by trading stocks associated with more information events. The implication of this …nding is that analysis of the number of information events associated with stocks traded by the managers helps us to identify the talented ones.
3
Decomposing Mutual Fund’s Stock Selection Skills
To better understand the channels through which talented fund managers can add value, we de-compose the stock selection skill of a mutual fund. In general, how a manager with superior skill trades to add value will depend on how long it takes for the market to realize that the manager is correct. Analyzing how long the informational advantage lasts, a manager’s trades can be classi…ed into the following three types:
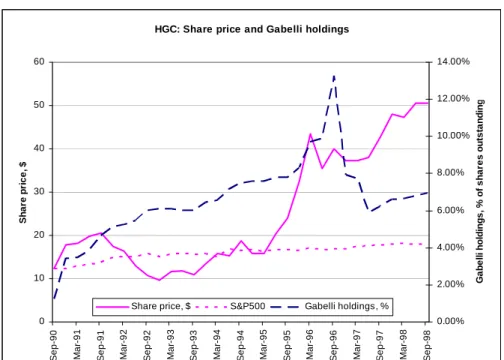
1. A manager can add value from long-term “value investing” by taking a position in a stock with the expectation that the market will eventually agree with his or her view in, say, a few years.11
1 1
Using fundamental analysis, Mario Gabelli, a money manager, realized that the stock of Hudson General Corp (HGC) was heavily undervalued at around $25 in early 1994 and started to accumulate shares of HGC for his Gabelli Funds (see Figure 2A). The investment paid o¤ after two years, when the stock price reached $40. The market eventually agreed with Mr. Gabelli, after Lufthansa took over HGC at $76 per share. See Greenwald, Kahn, Sonkin and Biema (2001) for details on this case.
2. A manager can add value from medium-term informed trading by transacting in “mispriced” stocks, expecting the market to agree with his or her view within, say, a quarter or two.12 In this case, the value of the information is likely to erode quickly, and successful and timely trade execution may require paying a substantial price concession.
3. A fund manager can add value using short-term liquidity provision by taking the other side of a trade when liquidity is most needed.13 Since fund managers often hold an inventory of stocks in order to track their performance benchmarks, they have a natural advantage in making a market in those stocks. Superior knowledge about the stocks covered by a manager will help in any market-making activities by minimizing potential losses that would arise from trading with market participants with an information advantage.14
To separate the value-added in these three di¤erent types of trading, we focus on the characteristics-based performance measure, characteristic selectivity (CS). Recall that theCSmeasure of a mutual fund during quartert+1, based on its actual stock holdings at the end of quartert, can be computed as:
CSt+1= X
j
wj;t[Rj;t+1 BRt+1(j; t)]
where Rj;t+1 is the return on stock j during quartert+ 1;wj;t is the dollar value weight of stock j held by the mutual fund at the end of quarter t; and BRt+1(j; t) is the benchmark portfolio
1 2
The year-to-year same store sales growth reported by Starbucks every month is a widely watched number, and is considered about as important as the company’s quarterly earnings announcements for valuation purposes. For January to September 2005, Starbucks’ reported sales growth rates were in the range of 7% to 9%. Most analysts were of the view that a large part of that growth rate was attributable to the 3% sales price increase that took e¤ect in October 2004, and that this price increase would not help with respect to same-month year-to-year sales growth rates beginning with October 2005. That probably explains the much smaller anticipated growth rate (analyst consensus was 3.6%). However, a careful analysis of sales breakdown would have indicated that the 3% price increase in October 2004 explained little of the sales growth during January-September 2005. So, the October sales growth …gure should be more like that for the early months of 2005. While most mutual funds decreased their holdings of Starbucks stock during Q3 2005 in anticipation of an announcement of a drop in same-store sales growth for October, Putnam Voyager Fund actually accumulated more shares (see Figure 2B). On November 3, 2005 Starbucks reported unexpectedly strong sales growth of 7% for October, and its share price jumped. Details on this case can be found in Blumenthal (2007).
1 3It is well known that when index funds trade following index rebalancing, their trades tend to demand liquidity from the market (see Blume and Edelen, 2004). Active fund managers taking the other side of those trades will bene…t from liquidity provision.
1 4
Sometimes managers may not be directly motivated by the “liquidity provision”objective. For example, consider a mutual fund with a policy of not investing more than a certain percentage of its assets in any one stock. The fund may decrease its holdings of a stock that experiences a recent sharp price increase in order to satisfy its portfolio weighting constraints. Such trades are likely to provide liquidity and will therefore be classi…ed as “liquidity provision” even when liquidity provision was not the motivation behind the trade.
return during quarter t+ 1 to which stock j is matched at the end of quarter tbased on its size, book-to-market equity ratio, and past 12-month return.
We can further decompose CS measure. A numerical illustration of such decomposition is provided in Appendix B. Suppose mutual funds rebalance only at discrete points in time,t = 1,2, 3, ....,T. For convenience, we assume time periods are measured in quarters. LetNt be a column vector of mutual fund stock holdings (in number of shares, split-adjusted) at the end of quarter t. By comparing Nt 1 and Nt, we can de…ne three stock portfolios:
1. Hold portfolio, which has stock holdings:
NtH = min (Nt 1; Nt)
where the operator min() calculates the element-by-element minimum; and NtH captures holdings that appear in both quarters.
2. Buy portfolio, which has stock holdings:
NtB=Nt NtH
The buy portfolio holds stocks bought by the fund during quarter t. 3. Sell portfolio, which has stock holdings:
NtS=Nt 1 NtH
The sell portfolio contains stocks sold by the fund during quartert.
Over time, the mutual fund stock holdings change as follows:
Nt=Nt 1 NtS+NtB
Let Pt be a column vector of corresponding stock prices at the end of quarter t. Let us denote the market value of hold, buy and sell portfolios as Ht, Bt and St, respectively. Accordingly, we
have:
Ht = Pt0NtH Bt = Pt0NtB St = Pt0NtS
At the end of quartert, the mutual fund’s stock holdings are a combination of the hold portfolio and the buy portfolio. The fund CS measure for quarter t+ 1 is therefore the value-weighted average ofCS measures on the hold portfolio and buy portfolio for quartert+ 1:
CSt+1 = Ht Ht+Bt CSH;t+1+ Bt Ht+Bt CSB;t+1;
whereCSH;t+1 and CSB;t+1 denote CS measure on hold and buy portfolios for quartert+ 1.
We then decompose the CS measure into three components:
CSt+1 = CStO+1+CStT+1+CS adj t+1 (5) CStO+1 = Ht Ht+St CSH;t+1+ St Ht+St CSS;t+1 CStT+1 = Bt Ht+Bt CSB;t+1 St Ht+St CSS;t+1 CStadj+1 = Ht Ht+Bt St Bt Ht+St CSH;t+1
The …rst component, theold component (CStO+1), can be interpreted as theCS measure on the fund as if the fund did not balance its portfolio at all during quarter t. If nothing happens to the fund during quarter t, its stock holdings would remain unchanged (Nt = Nt 1), and thus would
be composed of stocks in the hold portfolio and sell portfolio. Consequently, the CS measure for quarter t+ 1 would be the value-weighted average of CS measures on the hold portfolio and sell portfolios. Intuitively, this captures the value-added to the fund during quarter t+ 1 from fund investments prior to quartert, and likely corresponds to the bene…t from long-term investment.
The second component, the trade component (CStT+1), measures the characteristics-adjusted returns on the most recent mutual fund stock trades during quarter t. Finally, the adjustment component (CStadj+1) represents a small adjustment term whenever St 6= Bt, which could happen
whenever there is in‡ow or out‡ow to the fund.
The trade component (CStT+1) measures value-added from both medium-term informed trading and short-term liquidity provision. Since mutual fund holdings are typically reported at quarterly frequency at most, in order to make a reasonable attempt to separate them, we rely on a key di¤erence between these two types of trades. Informed trading, unlike liquidity provision trade, is likely to demand liquidity since the value of information erodes quickly over time, so timely execution becomes important. Given this intuition, we can further decompose the trade component CST
t+1 into two components by comparing the sign of quarterly mutual fund holding change and
the sign of market order imbalance for each stock traded by the fund (the stocks in the buy or sell portfolios) during quarter t. The market order imbalance is de…ned as the total number of buyer-initiated trades minus the total number of seller-initiated trades in the quarter.
Following custom in the literature, we implement the trade classi…cation using the standard algorithm in Lee and Ready (1991). We then classify stock trades where the two signs are identical into one group, denoted by superscript “+”; and where the two signs are di¤erent into another group, denoted by superscript “ ”. As a result, the characteristics-adjusted returns on trades from these groups sum up toCST
t+1: CStT+1 = CStinf+1+CStliq+1 (6) CStinf+1 = B + t Ht+Bt CSB;t+ +1 S + t Ht+St CSS;t++1 CStliq+1 = Bt Ht+Bt CSB;t+1 St Ht+St CSS;t+1
Given that the aggregate market order imbalance is a good measure of the direction of liquidity needs of a stock, CStinf+1 measures the characteristics-adjusted return on mutual fund trades that on average absorb market liquidity (see Chordia and Subrahmanyam, 2004). Such trades are likely driven by information and are therefore classi…ed as “informed trading.”CStliq+1, on the other hand, measures the characteristics-adjusted return on mutual fund trades that on average supply market liquidity, and hence are classi…ed as “liquidity provision”. In the extreme case where the fund manager trades only one stock and when the time interval is one minute rather than one quarter, CStliq+1 will closely resemble the realized spread of Huang and Stoll (1996), which measures the
reward to market makers’liquidity provision activities. To summarize, we decompose the fundCS measure as: CSt+1 = CStO+1+CS adj t+1+CStT+1; (7) CStT+1 = CStinf+1+CStliq+1:
3.1 Discussion of the Empirical Implementation
There are several potential empirical issues associated with the implementation of our decomposi-tion procedure. First, because we use quarter-end mutual fund stock holdings for the decomposidecomposi-tion of stock holdings, we will miss high-frequency turnovers by mutual funds; see Kacperczyk, Sialm and Zheng (2007) and Elton, Gruber, Krasny and Ozelge (2006). To the extent that short-term liquidity provision occurs within a calendar quarter, by using quarter-end holdings only, we may underestimate the bene…t from liquidity provision.
Second, the division of informed trading and liquidity provision is imprecise. On the one hand, not all informed trading is liquidity demanding, especially when the trader is very patient and trades in small quantities over a relatively long period of time. In the trading of relatively large quantities quickly to take advantage of the time value of information, however, it is extremely hard not to absorb liquidity. As a result, liquidity-demanding trades are still likely information-driven on average. On the other hand, not all liquidity-demanding trades are information driven. For example, distress stocks sales by mutual funds (see Da and Gao, 2006) and assets …re-sales due to extreme ‡ows (see Coval and Sta¤ord, 2007) are likely to absorb liquidity but have nothing to do with mispricing trading motives. As distressed stocks are typically of small market capitalization, the impact of transactions will be alleviated, as each component of the CS measure is computed using the value-weighted average. When we leave out value-adding informed trading that is not liquidity demanding and including value-destorying distressed trading that is liquidity demanding, we are underestimating the bene…t of informed-trading, and overestimating the bene…t of liquidity provision. Finally, our classi…cation of informed trading and liquidity provision depends on quar-terly data, which could also be noisy. These noises may prevent us from …nding any signi…cant results.
Recognizing these challenges in the empirical exercise, we have all the same made the …rst attempt to bring both informed trading and liquidity provision into the evaluation of mutual fund’s stock selectivity. In Appendix B, we examine several empirical properties of the decomposition that lend support for its validity. First, we show that mutual funds are likely to provide liquidity on average only when they reduce their holdings, consistent with our conjecture that it is easier to provide liquidity on stocks that one currently owns. Second, we demonstrate the e¤ectiveness of our decomposition methodology using two speci…c examples: (1) Dimensional Fund Advisors, and (2) a group of domestic index funds. Third, we …nd that the informed trading component is more important than the liquidity provision component in explaining cross-sectional variation in the CS measures. In addition, informed trading becomes relatively more important for growth-oriented funds while liquidity provision becomes relatively more important for income-growth-oriented funds, consistent with what one would expect.
3.2 Empirical Decomposition Results
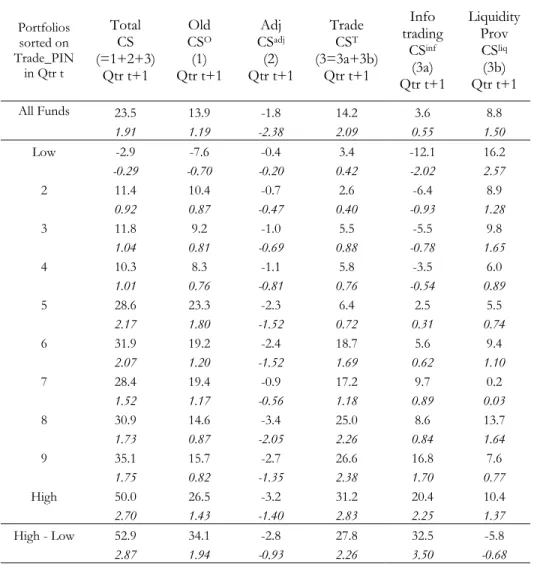
We show for all US domestic active equity funds in the sample, the average size of each component in the …rst line of Table 6. Overall, the active fund managers seem to have some stock selection skill that requires trading with the order imbalance in the market. The average character selectivity measure is 23.5 basis points per quarter (t-value = 1:91), indicating the stocks selected by fund managers outperform stocks with similar characteristics. Of the 23.5 basis points, 13.9 basis points come from the passive buy-and-hold strategy and 14.2 basis points come from stocks recently traded by the funds. The adjustment component is small in absolute term (-1.8 basis points) but signi…cant, potentially driven by fund ‡ow to managers with skills as empirically documented by Chevalier and Ellison (1997), and Sirri and Tufano (1998), among others, and theoretically analyzed by Berk and Green (2004).15 Finally, although both the informed trading component (CSinf) and the liquidity provision component (CSliq) are positive, neither is signi…cant.
Table 6 also shows the decomposition applied to the decile portfolios of funds sorted ontrade_P IN. This reveals interesting di¤erences in value-added between funds trading high-P IN stocks and funds trading low-P IN stocks. For high-trade_P IN-funds, a large part of the character selectivity (CS)
1 5
When managers have skill (CSP is likely to be positive), fund in‡ow is more likely (B > S); when managers have no skill (CSP is likely to be negative), fund out‡ow is more likely (S > B). Both e¤ects lead to a negative CSadj as in equation (5).
measure comes from active trading during the previous quarter (CST = 31:2 basis points with a t-value of 2:83). We can con…rm that the stocks bought by mutual funds (the buy portfolio) and the stocks sold by mutual funds (the sell portfolio) have very similar average P IN measures. The trade component, measuring their return di¤erence, should be less subject to P IN risk. The fact that it is positive and signi…cant indicates that we are not capturing just the P IN risk. Although both the informed trading component (CSinf) and the liquidity provision component (CSliq) are positive for high-trade_P IN-funds, only the informed trading component is signi…cant (20:4basis points with a t-value of 2.25), and it is twice the size of the liquidity provision component (10.4 basis points). This is consistent with our conjecture. When skillful managers absorb liquidity by trading high-P IN stocks, they are likely to have valuation-relevant information, and thus make money on informed trading. For them, there is less of an added cost of demanding immediacy in the market than there is a bene…t from superior information, as Grossman and Stiglitz (1980) would predict. In terms of liquidity provision, not all of them can perform well consistently. As a result, although the liquidity provision component is positive on average, it is much smaller and not signi…cant, perhaps because of the possibility of trading against informed traders and the noise associated with identifying liquidity provision using quarterly mutual fund holdings data..
The low-trade_P IN-funds, despite near zero stock selection skill on average, seem to possess some skill in liquidity provision. The liquidity provision component (16.2 basis points) is signi…cant (t-value = 2.57). This is because when fund managers trade low-P IN stocks, they are likely to trade with uninformed traders. When they trade against market order imbalance, they are likely to make money by providing the needed liquidity. Although the reward for liquidity provision on these stocks is lower than that on the high-P IN stocks, the risk of adverse selection is also lower, making liquidity provision more easily detected. The positive liquidity provision component is partly o¤set by a negative informed trading component, resulting in a close-to-zero CS measure.
To sum this up, the decomposition exercise reveals interesting patterns in how mutual fund’s trades can add value. While informed trading is more likely to add value at times when the stock traded are associated with information events, liquidity provision is more likely to add value (or be easily detected in a statistical sense) when the stocks traded are associated with few information events.
4
Conclusion
The folk wisdom is that portfolio managers can pro…tably take advantage of their talent when the stocks they follow are a¤ected by information events. To the extent that economic conditions that favor one type of talent over another tend to persist for a while, managers who were able to generate value at a certain time will continue to do so for a while. It follows that the past superior performance of a portfolio manager is less likely to be due to just plain luck when that superior performance is attributable to trading in stocks that were most a¤ected by information events.
We provide empirical support for this view. Funds that trade in stocks most a¤ected by infor-mation events on average earned50 basis points per quarter more after risk adjustment than funds trading in stocks least a¤ected by information events. Among funds with a high positive alpha in one quarter, only those that traded in stocks the most a¤ected by information events earned a signi…cantly positive alpha (33 basis points per quarter on average) in the next quarter.
When we decompose a manager’s stock selection ability further into di¤erent components, we …nd that impatient informed trading is more important for alpha generation for the funds trading stocks a¤ected most by information events. Liquidity provision, on the other hand, is more important for the funds trading stocks a¤ected least by information events. Decomposition of holding like this further facilitate the understanding of the strengths of an active portfolio manager and the extent to which such strengths will persist into the future.
Appendix A: Measures of Private Information Events
Easley and O’Hara with several coauthors develop a measure - probability of informed trading (P IN ) - to capture the probability of information-based trading. Let denote the probability that an information event occurs; denote the low value of underlying asset, conditioning on the occurrence of an information event; the rate of informed trade arrivals; b the arrival rate of uninformed buy orders; and s the arrival rate of uninformed sell orders.
Easley, Hvdkjaer, and O’Hara (2002) propose an maximal likelihood estimation of the parameter vector f ; ; b; s; g L( jB; S) = (1 )e b B b B!e s S s S! + e b B b B!e ( +s)( + s)S S! (A-1) + (1 )e ( +s)( + b) B B! e s S s S!
whereBandSrepresent total buy trades and sell trades for the day. The probability of information-based trade, P IN, is
P IN =
+ b+ s
(A-2)
With some independence assumptions across trading days, the likelihood function (A-1) becomes
L j(Bi; Si)ii==1N =
N
Y
i=1
L( jBi; Si): (A-3)
The problem with estimation ofP IN measure is that numbers of buy and sell orders have risen considerably since 2001, particularly for some Nasdaq stocks. One way to alleviate this problem, as in Vega (2006), is to impose the constraint that the informed and uninformed orders arrive at the same rate:
b = s= (A-4)
Then we estimate a modi…ed version of (A-1):
L( jB; S) = (1 )e 2 B+S B!S! + e ( +2 ) B( + ) S B!S! + (1 )e ( +2 ) S( + ) B B!S! (A-5)
The probability of informed trading, P IN, is
P IN =
+ 2 : (A-6)
Note that the probability that an information event occurs ( ) and the rate of informed trade arrivals ( ) enter the P IN equation as a product term ( ). Although and are estimated individually rather imprecisely, because the estimation errors in the two parameters are usually strongly negatively correlated, the resultingP IN estimate is quite precise. Moreover, the variation in and are o¤setting, makingP IN a much stable measure bounded between 0 and 1.
In the economy of Easley, Hvdkjaer, and O’Hara (2001), the total number of trades B+S and the order imbalance B S are related to parameters of the model. as:
E[B+S] = + 2
E[B S] = (1 2 )
Since each day is either a good day ( = 0), a bad day ( = 1), or a no-event day ( = 0), the expected daily absolute order imbalance (OIB) is then:
E[jB Sj] =
Aktas, Bodt, Declerck, and Oppens (2007) and Kaul, Lei, and Sto¤man (2007) show that a relative order imbalance measure rel_OIB = E[jB Sj]=E[B+S] is a good approximation of P IN. In fact, on a daily basis, rel_OIB is equivalent to P IN. In addition, the average cross-sectional correlation between these two measures is above 0:75: rel_OIB is clearly a measure of order ‡ow one-sidedness. Our results are almost identical when we replaceP IN withrel_OIB.
Durate and Young (2007) extend (A-1) to take into account large buy and sell volatilities, and pervasive positive correlation between buy and sell orders. Their model allows the possibility of order ‡ow shocks and di¤erent distributions of the number of the buyer-initiated informed trades and the number of the seller-initiated informed trades. With such an extension, one may estimate
an adjusted version of the probability of informed trading (AdjPIN) as
AdjP IN = [(1 ) b+ s]
[(1 ) b+ s] + ( b+ s) 0+ (1 ) + b+ s
(A-7)
where the additional parameter denotes the probability of symmetric order ‡ow shocks conditional on no arrival of private information event, and 0 denotes the probability of symmetric order ‡ow shocks conditional on the arrival of private information. b and s denote the additional arrival rate of buy orders and sell orders conditional on the arrival of the symmetric order ‡ow shocks.
Durate and Young (2007) simplify (A-7) by restricting = 0. The most important feature of the model is the probability of symmetric order ‡ow shocks could be non-negative ( 0). Since we estimate theAdjP IN measure quarterly using the daily trade imbalanced data aggregated from the tick-by-tick transactions, to reduce the sheer volume of calculations, and to estimate a relatively parsimonious model with fewer parameters, we further impose the constraints that b = s = and b = s = . According to Durate and Young (2007), the adjusted-PIN estimated with these constraints generate similar results to their full-‡edged model.
Thus, the adjusted-PIN measure we estimate is speci…ed as:
AdjP IN =
+ 2 + 2
In addition to causing large order imbalance, informed trading will also force the market maker to increase the bid-ask spread. In the structural model of intra-day trading costs proposed by Madhavan et al. (1997), the price change can be captured by:
pt pt 1= ( + )xt ( + )xt 1+ut
where is the market maker’s cost of supplying liquidity; captures the sensitivity of beliefs to unexpected order ‡ows or the degree of private information; xt is the sign of the order ‡ow (1: trade at ask, -1: trade at bid, 0: trade between bid and ask); is the autocorrelation of the order ‡ow. theta( ) is thus known as the information asymmetry component of the bid-ask spread and serves as an alternative measure of private information events. , , and will be jointly estimated with transaction-level data using the generalized method of moments (GMM) on a quarterly basis.
To the extent that signi…cant information events usually lead to abnormal trading in a stock, our last alternative measure is a measure of abnormal turnover (aturn) calculated in a similar fashion as in Chordia, Huh, and Subrahmanyam (2007). At the end of montht, for each stock, we estimate a regression in a 36-month rolling window[t 35; t]:
turn=a+bx+"
where turn is monthly stock turnover de…ned as the ratio between total number of shares traded during the month and total number of shares outstanding, andxis a vector of adjustment regressors including 11 monthly dummy variables for months (January - November) as well as the linear and quadratic time-trend variables. The residual term for month t, "t, after standardization is the measure of abnormal turnover (aturn).
Appendix B: Decomposition of Mutual Fund Stock Selection Skill - A Numerical Example and Empirical Validations
B.1: A numerical example
Assume there are six stocks (A, B, C, D, E, and F). A mutual fund’s holdings in these stocks at the end of quarter t 1 (Nt 1) and t (Nt), stock prices at the end of quarter t (Pt), and the characteristics-adjusted stock returns during quartert+1 [Rj;t+1 BRt+1(j; t)]can be summarized
in the following table:
Stock Nt 1 Nt Pt Rj;t+1 BRt+1(j; t) A 2 1 10 3% B 2 0 15 2% C 2 2 20 1% D 2 2 25 1% E 2 3 30 2% F 0 2 35 3%
The hold, buy and sell are then de…ned by the holdings NtH,NtB and NtS: Stock NtH= min (Nt 1; Nt) NtB=Nt NHt NtS=Nt 1 NHt A 1 0 1 B 0 0 2 C 2 0 0 D 2 0 0 E 2 1 0 F 0 2 0 Value Ht= 160 Bt= 100 St= 40
The portfolio values Ht, Bt, and St are determined using the prices at the end of quarter t (Pt). Notice that Bt > St, and the di¤erence is likely …nanced by fund in‡ows, or a reduction in cash position or the sale of other non-stock assets held by the fund. The hold, buy, and sell can be treated as three separate funds whose CS measures can be computed using equation (3) and holdings as:
Hold Buy Sell
CS CSH;t+1= 0:63% CSB;t+1= 2:70% CSS;t+1= 2:25%
Given this information, equation (5) then decomposes the total CS measure into three compo-nents:
CSt+1 CSOt+1 CSTt+1 CS
adj t+1
1:42% 0:05% 1:49% 0:12%
If we further assume that the fund trades B and F in the same direction as the aggregate order imbalance and trades A and E against the direction of aggregate order imbalance, equation (6) further decomposes the trade component (CStT+1) into an informed trading component (CStinf+1) and a liquidity provision component (CStliq+1):
CSTt+1 CSinft+1 CSliqt+1
1:49% 1:11% 0:38%