Cimr SinHAfmt
'€^ - -h' V::
Crrjtlr Apf)
■
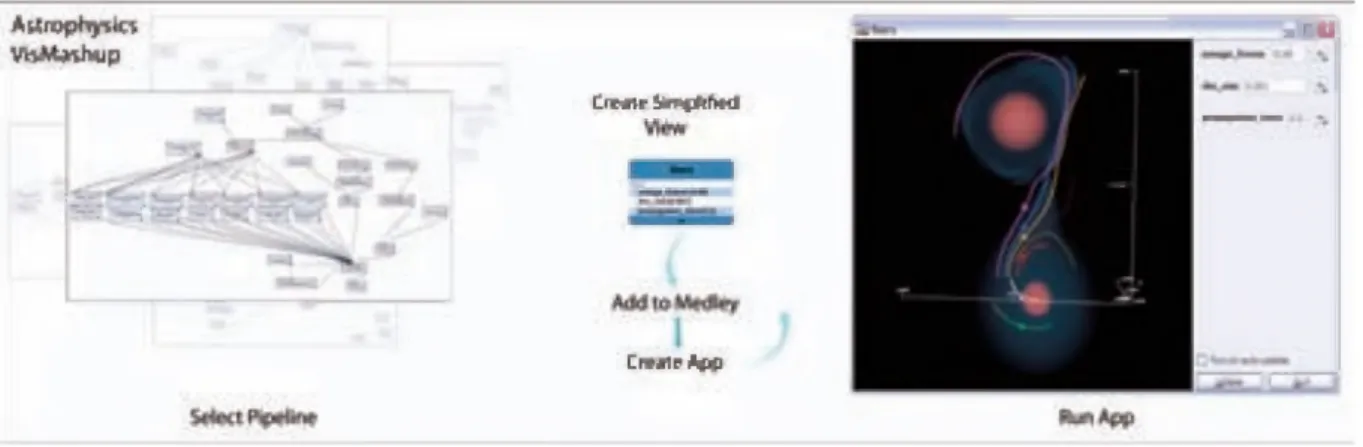
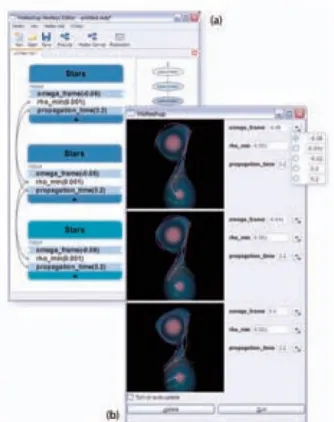
Fig. 1: Creating an Astrophysics VisMashup to explore a binary star system.
A b s tra c t— Visualization is e ssen tial for u nderstanding th e increasing volum es of digital d ata. However, th e p ro c e ss required to cre a te insightful visualizations is involved and time consum ing. Although several visualization tools are available, including tools with so phisticated visual interfaces, they are out of reach for u se rs who have little or no know ledge of visualization tec h n iq u es and/or who do not have program m ing expertise. In this paper, w e p ro p o se VisMa s h u p, a new fram ew ork for stream lining th e creation of custom ized visualization applications. B e c a u se th e s e applications can b e custom ized for very specific ta sk s, they c an hide much of th e complexity in a visualization specification and m ake it e a s ie r for u se rs to explore visualizations by m anipulating a sm all s e t of p aram eters. W e d escrib e the fram ew ork and how it su p p o rts th e various ta s k s a d e sig n er n e e d s to carry out to develop an application, from mining and exploring a s e t of visualization specifications (pipelines), to th e creation of simplified view s of the pipelines, and the autom atic generation of th e application and its interface. We also d e sc rib e the im plem entation of the sy stem and d em o n stra te its u se in two real application scen ario s.
Index T erm s— Scientific Visualization, Dataflow, Visualization S ystem s.
♦
1 In t r o d u c t i o n
Data exploration through visualization is an effective means to un derstand and obtain insights from large collections of data. Not sur prisingly. visualization has become a mature area with an established research agenda [211, and several systems have been developed that support the creation of complex visualizations [6.12.14.20.22.32.351. But even using systems that have sophisticated visual programming interfaces, such as AVS. DX. SCIRun. and VisTrails. the path from the raw data to insightful visualizations is laborious and error-prone. And this has hampered a wider adoption of visualization techniques.
Visual programming interfaces expose computational components as modules and allow the creation of complex visualization pipelines which combine these modules in a dataflow, where connections be tween modules express the flow of data through the pipeline [161. They also provide built-in constraint checking mechanisms (e.g.. that disallow a connection between incompatible module ports) that sim plify the creation of pipelines. Recently, new techniques have been
• Em anuele Santos. Lauro Lins. Juliana Freire. a n d Clduclio T. Silva are with the Scientific Com puting a n d Im aging (SCI) Institute a t the University o f Utah, email: {em anuele. lauro. Juliana. csilva}(g>sci.utah.edu. • Jam es P. Ahrens is with Los Alam os N ational Lab in Los Alam os. NM.
email: ahrens(s> lanl.gov.
M anuscript received 3 / March 2009; accepted 27 July 2009; po sted online
/ / O ctober 2009; m ailed on 5 O ctober 2009.
For inform ation on obtaining reprints o f this article, please send em ail to: tvcg@ com puter.org.
proposed to simplify the creation and refinement of these pipelines, including recommendation systems [15.271 and a mechanism to refine pipelines by analogy [241. Notwithstanding, without detailed knowl edge of the underlying computational components, it is difficult to un derstand what series of modules and connections ought to be added to obtain a desired result. Consequently, the generation of visualiza tions is a task that is best carried out by experts who are familiar with visualization techniques and tools.
Recognizing this problem, there have been a number of efforts to create simpler visualization applications (e.g.. [8.28.321) that are cus tomized to a particular task (e.g.. [5.13.181) and that use concepts that are more meaningful to domain experts than visualization primitives. Some systems [8.18.28.321 provide customized interfaces that allow users to control the parameters of a pipeline. These simplified inter faces are easier to use than the general systems and can be designed specifically for domain experts that do not have expertise in visual ization. Nonetheless, they are expensive to create and maintain. The lifecycle for developing custom applications is often long, requiring several iterations until the application does what the end-user needs. Whereas such solutions can be (and have been) successfully applied in big scientific projects, they are out of reach for smaller-scale ef forts. The costs involved in creating these applications make them unsuitable for one-of-a-kind, exploratory visualizations.
O ur Approach. In this paper we propose VisMashup. a new ap proach for simplifying the creation, maintenance, and use of cus tomized visualization applications (or mashups). Because Vis Mashup uses dataflows as the underlying model, in principle, it can be combined with visualization systems that use dataflows to
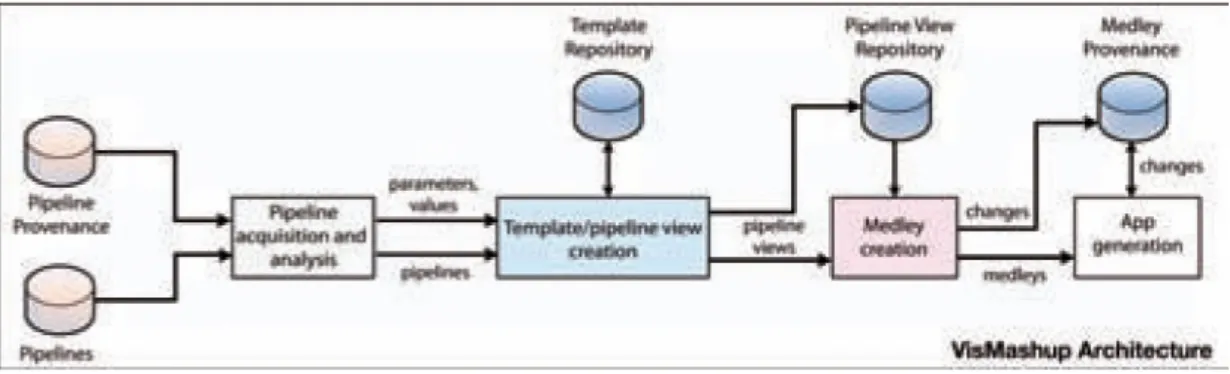
Fig. 2: The VisM ashup Architecture. specify pipelines (e.g., V TK -based systems such as ParaView [14]
and VisTrails [35]). In addition to pipelines defined as dataflows, VISM ASHUP requires the visualization systems to provide access to pipeline specifications, the ability identify and changc pipeline com ponents, and to execute the pipelines. As shown in Figure 2, the V i s M a s h u p system consists o f a set of components that support tasks an application designer has to perform to construct a custom application. The Pipeline acquisition and analysis component allows designers to query and mine pipeline collections and their provenance [9]. This en ables them to identify relevant pipelines, discover interesting param e ters that should be exposed in the application, as well as a set o f valid values that can be used for these param eters. Through a point-and- click interface, the Template/pipeline view creation component allows a designer to m anipulate pipelines and create simplified views which expose only the pipeline com ponents that arc relevant for a given task. Pipeline views can then be com bined into a medley (see Sec. 3.2) to create more complex, exploratory tasks (Medley creation). The App generationcom ponent uses the medley specification to automatically generate the application and associated user interface. VISM ASHUP also m aintains detailed provenance inform ation o f the application de velopment process and use (Medley Provenance). As wc discuss in Scction 3, this inform ation can be used to further refine and improve the derived apps.
W hile this infrastructure simplifies the jo b o f an application de signer, it gives an end-user the flexibility to create visualizations through a simple interface that hides unnecessary details o f the under lying pipelines and how they arc integrated. Furthermore, end-users also have the ability to customize a mashup, by hiding and showing components as well as moving them around in the interface.
Outline. The rem ainder o f the paper is organized as follows. Wc
review related work in Sec. 2. In Sec. 3, wc introduce the basic con ccpts and describe the m ain com ponents of the V i s M a s h u p model. The im plem entation details o f the VISM ASHUP com ponents and their interfaces arc presented in Sec. 4. In Sec. 5, wc present two case stud ies where wc applied the VISM ASHUP system: a m ashup that allows users to interact with astrophysics analyses; and a m ashup that allows neuroscientists to explore and compare complex visualizations for a study on the cffccts of repetitive Trans-cranial M agnetic Stimulation (rTM S) on working memory. Wc conclude in Sec. 6, where wc outline directions for future work.
2 Re l a t e d Wo r k
A num ber o f visualization systems have been proposed that provide sophisticated visual program m ing interfaces. These interfaces aim to simplify the creation o f visualizations by allowing users to create pipelines which combine com putational components (m odules) in a dataflow [12, 22, 32, 35]. However, w ithout detailed knowledge of the underlying com putational components, it is difficult to understand what series o f modules and connections ought to be added to obtain a desired result. O ther systems, such as ParaView [14], go a step further and not only hide the details of the pipelines, but also provide ab stractions that simplify the creation o f visualizations. However, these systems arc still very general and require detailed knowledge o f vi sualization techniques. Sim ilar to these tools, VISM ASHUP relies on
dataflow s w h ich describ e a series o f v isualizations, and like ParaV iew , the derived ap p licatio n s h id e the u n d erly in g p ipelines. H ow ever, w ith Vi sMa s h u p, cu sto m ized (specific) ap p licatio n s can be derived that arc targeted to en d -u sers w h o d o n ot n ecessarily have know ledge o f v isualization.
A nother approach that has been used to simplify data exploration through visualization is the creation o f custom applications. CDAT, for example, is a tool designed for clim atologists that supports visual exploration of climate data [5]. Because such applications arc costly to develop, this approach is not scalable. Instead of building applica tions from scratch, some systems (e.g., AVS [32], IRIS Explorer [8], V ISSIO N [28] and SCIRun [18]) allow the creation of custom ized in terfaces for visualization pipelines. In SCIRun, these interfaces arc callcd PowerApps. BioFEM, for example, is a PowerApp built atop o f a SCIRun pipeline that solves a bioelectric forward problem us ing the finite element method provided by Biological Problem Solving Environm ent (BioPSE) tools [18]. BioFEM consolidates all necessary user controls in a single UI, hiding other generic controls and the as sociated dataflow network. Unfortunately, a SCIRun Pow erApp needs to be m anually crafted for a given pipeline. IRIS Explorer provides a GUI to facilitate the layout and design o f widgets representing pa ram eters, but users need to manually create the interfaces. Sim ilar to VISSION, V i s M a s h u p automatically derives the application inter face from a dataflow network. But Vi s M a s h u p goes a step further: it provides a comprehensive infrastructure that allows the application de veloper to explore collections o f pipelines and combine them to create the applications. A nother im portant distinction betw een our approach and previous systems is that it captures detailed provenance of both application developm ent and use.
Several approaches have been proposed whose goal is to simplify application development, from high-level program m ing languages such as R uby1 and Python2, to visual program m ing tools such as Visual Basic. These, however, still require program m ing expertise. More recently, there have been a num ber o f proposals for tools tar geted to non-programm ers. For example, Yang ct al. [37] proposed a W Y SIW Y G tool that aids in the development o f data-driven Web ap plications; and Yahoo! Pipes [36] provides a visual interface through which users can assemble pipelines for constructing Web mashups. Although V i s M a s h u p shares some o f the same goals, our approach targets the construction o f applications which use dataflows as basic building blocks.
Reduced-functionality interfaces, such as training wheels [4], have been used to help first-time and novice users of complex systems. In these interfaces, advanced features arc disabled on the GUI to prevent user errors and confusion. Shneiderman [25] proposed the design of layered interfaces, w hich provide a set o f increasingly complex in terfaces, allowing the user to select the interface that best suits her needs. V i s M a s h u p naturally supports both techniques— the designer can easily create several variations of an application through a series o f pipeline views. In addition, because provenance is maintained, de tailed inform ation about how the different application versions were created and their diffcrcnccs is readily available.
1 http://w w w .m by-lang.org
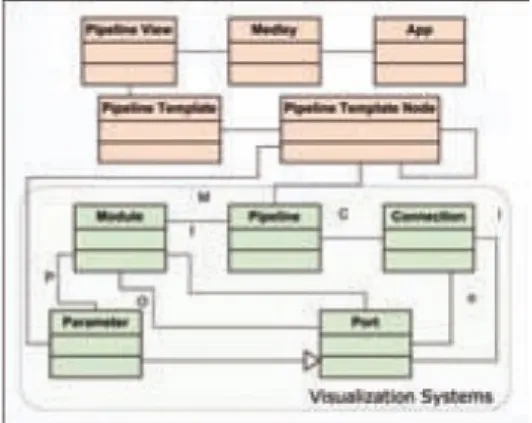
Fig. 3: Conceptual schema of the main concepts in V i s M a s h u p . 3 Mo d e l
In what follows, we present the basic concepts underlying the model we propose for generating customized visualization apps.
Dataflows. We assume that the dataflow [ 161 m odel is used to specify visualization pipelines. In this model, a pipeline is represented as a d i rected acyclic graph (DAG) where nodes (m odules) represent com pu tations and arcs (connections) denote data dependencies. If there is an arc from node m to node ik n requires the output o f m to execute. B e sides the outputs o f earlier com putations, nodes can also have param eters (data values) as inputs. The dataflow m odel is widely-used in vi sualization systems, including ConM an [101, AVS [321, SCIRun [221, and V TK-based systems such as Paraview [141, Visit [341 and Vis- Trails [351- Basing V i s M a s h u p on dataflows enables our framework to be combined w ith virtually any system that uses dataflows to spec ify pipelines. A schematic representation o f the m odel is depicted in Figure 3, and we describe its components below.
Definition 1. A pipeline(or dataflow) d is defined by a tuple (M.C), where M is a set o f modulesand Ca set of connections. Each m od ule m e M, in turn, is associated w ith a tuple (Im.O m.Pm),where Im corresponds to a set o f input ports, Omcorresponds to a set of output ports, and Pm is a list o f parameters.Each param eter p e Pm is associ ated w ith a value v. In a connection (o. i) e C connecting module m to module ik o e Omand i e o is called the source port and i is called the target port. Sources are modules that do not have target ports and sinks are modules not containing source ports. Additionally, ports and parameters have a type: and if there is a connection (o. i) € C, the types
o f o and i must be compatible. ■
Definition 2. A subpipeline ds(Ms,Cs)o f a pipeline d(M .C)is the pipeline induced by the set of modules Ms C M.For each connection c e C, if c connects two m odules mi and m i, and m ^ m i € Ms,then
c e Q .
■
3.1 Pipeline Operations
The two basic operations our m odel applies to pipelines are: run, which executes a pipeline: and substitution, which manipulates pipeline components (i.e., param eter values and modules). These op erations are used both during application design and to manipulate the pipeline through the application.
Run. A pipeline run is the execution of a pipeline in the order deter mined by the netw ork o f m odules and connections, in a demand-driven fashion. Each sink module ensures that its input ports have up-to-date data from incom ing connections, causing the modules o f the source ports of those connections to do the same. These data requests are propagated up (recursively) to the sources o f the pipeline w hich will in turn execute and produce the output values required by the dow n stream modules. The downstream m odules are executed, in turn, until the sinks located at the end o f the pipeline are reached.
Substitution. Substitution allows param eter values and m odules to be replaced within a pipeline. Let d = (M.C) and d ' = (M ’.C') be two pipelines. The operation substitute lJarameter(j(p .v ) assigns value v to param eter p in pipeline d, provided that the types o f v and p are compatible.
3.2 Templates, Views, Medleys and VisMashups
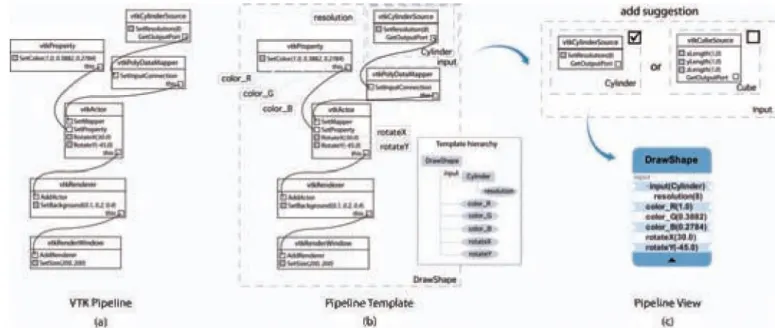
Visualization pipelines can be very complex, making it difficult for users other than the original developer to modify them . Consider for example, the relatively simple pipeline shown in Figure 4(a). This pipeline has 6 m odules and tens of parameters. To explore the visu alizations that can be derived by this pipeline, the user must be able to identify the relevant param eters that relate to a particular visualiza tion feature, know the ranges o f values that can be used for individual param eters as well as valid combinations o f values for dilferent pa ram eters. This can be very challenging, in particular for users that do not have detailed knowledge o f visualization techniques and of the individual V TK modules. An im portant goal o f V i s M a s h u p is to simplify this task and provide the end-user the flexibility to explore dilferent visualizations in a more intuitive way. Below, we introduce concepts and operations that allow a pipeline designer to create sim plified views o f pipelines and pipeline collections (medleys) which abstract away details that are not im portant for a given task. Using these operations, the designer may also select and expose configurable com ponents of the pipelines which will guide the end user in providing valid inputs as well as experiment with different pipeline variations. Pipeline templates. We introduce the notion of a pipeline template as an extension of a pipeline that allows users to define reconfigurable pieces of the pipeline in a hierarchical way. Users can select and label parameters or subpipelines using a nom enclature that is m ean ingful for a given application or task. Figure 4(b) shows a pipeline tem plate generated for the V TK pipeline in Figure 4(a). In order to give the end user the ability to modify the colors and rotations, the designer selected to expose the colors in the v t k P r o p e r t y module with the param eter names co lo r_ R , color_G and co lo r_ E : and the X and Y rotations in v tk A c to r as r o t a t e X and r o ta te Y , re spectively. In addition, selecting the subpipeline containing the m od ule v t kCyl i n d e r S o u r c e allows this subpipeline to be replaced by other pipelines through the customized application.
The root o f the tem plate hierarchy represents the pipeline, and its children and descendants correspond to configurable param eters and subpipelines. We refer to each elem ent in the tem plate hierarchy as a pipeline template node. Nodes that correspond to subpipelines are represented as rectangles and param eters as ellipses. Note that labels are unique in a given hierarchy level. By representing the tem plate as a hierarchy, our approach is able to handle arbitrary nesting of pipelines.
Pipeline tem plate nodes provide the same operations o f a pipeline as well as other specific operations for labeling and rem oving labels, for creating, adding and rem oving child nodes, creating and rem oving connections between tem plate nodes and between tem plate nodes and modules, and for m aterializing a pipeline.
Pipeline Views. W hereas in a pipeline tem plate im portant and con figurable elements (i.e., param eters and subpipelines) are selected, in a pipeline view, a new (abstract) module is created that hides all de tails of the underlying pipelines, including modules, connections and param eters that are deemed as unnecessary for deriving a set o f vi sualizations required by an end user.3 As we describe below, we use medleys as a mechanism to synchronize pipeline parameters and com bine multiple views. More formally, a pipeline view dr is a projection o f a pipeline d, where only a subset o f the pipeline elem ents (m od ules, param eters, and subpipelines) are exposed for direct interaction. F or example, a user cannot change a param eter if that param eter is not
VTR Pipeline HpefineTenicldK PlpeUn* Vtw
W CU (cJ
Fig. 4: Example of how pipeline views are created, (a) Original VTK pipeline that draws a simple cylinder, (b) The user marks configurable pieces o f the pipeline to create a template, (c) A pipeline view is created based on the pipeline template. The user defines tem plate node Cube as another suggestion for variable input and Cylinderas the default value.
exposed by the pipeline view. However, a pipeline view still keeps a reference to the original pipeline so the operations applied to the view can also be applied to the pipeline, including execution. We refer to the exposed elements as variables.
Notice that a pipeline view can be naturally built on top of a pipeline template. In fact, the view param eters and configurable subpipelines are also represented as a hierarchy that mirrors the one for the tem plate hierarchy. Besides setting the visibility o f template nodes and parameters, a developer can also specify a list of suggestions for the values a variable can take— these suggestions are used to derive ap plication widgets that enable users to conveniently select a value from list and bindit to the variable (see Sec. 4). Figure 4(c) shows a view (DrawShape) derived from the template in Figure 4(b). In addition, the view also contains suggestions for alternative subpipelines that can be used to bind the i n p u t variable, i.e., v t k C v l i n d e r S o u r c e and v tk C u b e S o u rc e . When defining these suggestions for tem plate nodes, the developer also specifies how these suggestions con nect in the parent template. It is possible that a given template node can be bound in different ways and the presence of some variables in a pipeline view is determined by the bindings used for their parents. In the example shown in Figure 4(c), the developer defined different types o f source, each containing their own set of parameters. There are two possible bindings suggested for the variable i n p u t: the sub pipelines C y l i n d e r and Cube. In the pipeline view shown, where C y l i n d e r is used, its param eter (i.e., r e s o l u t i o n ) is added to the view. If Cube were chosen, its param eters would be included instead. M e d le y s . For exploratory visualization tasks, a user often needs to create and m anipulate a set o f pipelines. For example, to compare different isosurface extraction algorithms, several pipelines need to be created, including one pipeline per isosurface algorithm, and a pipeline that produces a histogram which accum ulates the quality information for each mesh. Figure 5 illustrates two visualizations and their corre sponding quality histograms.
In order to support the construction o f applications that require the combination o f multiple pipelines, we introduce the notion o f a m ed ley: a medley M is a collection o f (related) pipeline views. V i s M a s h u p supports a set of operations for m anipulating the views in a medley. One such operation is synchronization. A variable .»■ in a pipeline view d v e M can be synchronized with any variable xJin an other view d[,€ M if .»■ and xJ have the same type. If .»■ and xJare synchronized, binding either to a value v sets both variables to v.
The ability to synchronize variables is useful, in particular, for tasks
Fig. 5: Comparing visualizations derived by two different isosurface algorithms and their associated quality histograms.
such as comparative visualization, since it helps ensure that all param eters across different pipelines whose values should be the same are indeed the same. Consider, again, the isosurface example. Given a medley that contains the views for the pipelines that use the different isosurface algorithms, by synchronizing their input file and contour values, in a single step, the user could set these param eters and they would be automatically propagated to the two pipelines. Furthermore, synchronization enables a user to efficiently try out different config urations. Instead o f setting values for each pipeline individually— which can be both time consum ing and error prone, the value for a param eter is set only once and it is automatically propagated to all synchronized variables in multiple views. A nother possible operation that can be applied to a medley is composition. Composition can be achieved by synchronizing an output port o f a view to the input port of another. In our example, composition could be used to pass the mesh derived by the two isosurface views to the view that derives the qual ity histograms. Note that because pipeline views reduce the num ber of components that are exposed for modification, they make it easier to identify how pipelines can be integrated and synchronized.
V is M a s h u p s . A vismashup (application) is a flexible G UI autom at ically generated from a medley specification. Instead of interacting directly with a dataflow network or a very general and complex GUI, users manipulate and execute a set of pipelines in a medley through a small num ber of graphical widgets. Figures 8 and 9 show examples
Fig. 6: W indow to control the mining options and filtering conditions to select pipelines.
o f vismashups. Application maintenance is simplified, since when the underlying medley changes, the GUI can be automatically updated. Furthermore, besides setting param eter values and synchronizing p a ram eters, users can customize a mashup: they can hide, show, and move widgets around. Changes made to the pipeline views through the mashup are propagated down to the pipeline level and sent to the visualization system for execution.
An important component o f the mashup generation and execution sub-systems is that they maintain detailed provenance information. VISMASHUP maintains provenance o f the mashup design process— it keeps all versions and variations o f a mashup created as the visualiza tion expert interacts with a user, using a model sim ilar to the change- based provenance proposed in [19]. Besides, log information o f the use o f a mashup is also kept (e.g., when the mashup was executed, the values provided). The log information can be used to further refine the views and medleys.
4 T h e Vi sMa s h u p S y s te m
We have built a prototype V i s M a s h u p system using Python, Qt, PyQt, and VisTrails as the underlying dataflow system. VisTrails sup ports a flexible set o f libraries, including VTK, ITK, matplotlib, SciPy and Web services. As illustrated in Figure 2, the V i s M a s h u p system has four main components: pipeline acquisition and analysis; template and view creation; medley creation; and application generation. The implementation o f these com ponents and their user interfaces are de scribed in detail below.
4.1 Pipeline Acquisition and Analysis
Although the pipelines for a mashup can be built from scratch, of ten, as visualization experts (designers) interact with domain experts (users), they construct a series o f pipelines to explore different as pects o f a data set, or different ways to visualize the data. The ac tual pipelines and their provenance, including information about the different runs, param eters set and their values, can be useful for de signing the views that serve as the basis for the custom application. The Pipeline Acquisition and A nalysis component allows the designer to explore a pipeline collection to identify relevant pipelines as well as identify important param eters and associated values.
Based on the metadata and provenance associated with a pipeline, we provide a filtering mechanism for developers to select pipelines satisfying simple conditions (see Figure 6). These conditions can be based on time(when the pipeline was created), the userthat created the pipeline, execution(w hether a pipeline was successfully executed and when), tagsand notesassociated with a pipeline. These rules are com piled into a simple regular expression matching over the text descrip tions o f the pipelines. Note that it is also possible to integrate more advanced interfaces that allow structural queries over the pipelines (e.g., [2,24]). Besides filtering, this component also provides an algo rithm to help organize the pipeline collection into groups and extract information about param eter changes (see below). If there is prove nance information about param eters that have been set across different executions o f a pipeline and their values, this information can be ex plored both to suggest which param eters to expose in the pipeline view as well as to create a range o f values that can be used as suggestions for the exposed param eters (Sec. 3.2).
Fig. 7: VisMashup M ining Interface: (a) Relevant pipelines organized in a Hasse Diagram; (b) Examining the param eters returned from the mining process using the Template/Pipeline View Editor.
Given a set o f pipelines D, the procedure GROUP-AND-MlNE- P a r a m e t e r s initially groups together pipelines that have the same structure (modules and connections), i.e., isomorphic graphs (line 2). For each group, the param eters and values stored in the pipelines and in their provenance (if available) are extracted and attached to the group (lines 3-12). Finally a H asse diagram [3,31] o f the groups is generated by calling procedure B u i l d - H a s s e - G r a p h . The Hasse diagram is a tree where each node corresponds to a group o f isomor phic graphs, and edges between a parent and a child node indicate con tainment. It shows how pipelines are related with respect to structure: the graph o f a parent node is contained in the graph o f the child node. Figure 7(a) shows an example o f a Hasse diagram for a collection o f 21 pipelines. Each pipeline is identified by a label and a thumbnail o f the visualization it generates. Although the Hasse diagram resembles an image graph [17], the latter only captures the relationship between visualization param eter changes and are created for a single pipeline. Gr o u p-a n d-M in e-Pa r a m e t e r s(Z))
1 hasse-nodes<— Ma k e-No d e s-Fr o m- Pip e l in e s(Z))
2 hasse-nodes<— MERGE-WlTH-SAME-STRUCTURE(/!a.v.ve-;?of/e.v) 3 fo r nin hasse-nodes
4 n .param -list<— DICTIONARY!;) 5 fo r din n . pipelines
6 param s<— GET-PARAMS-FROM-PROVENANCE(rf) 7 param s <— p a ra m s+ d ■ parameters
8 fo r Pin param s
9 if P .n a m en o t in;? .param -list.KEY S () 10 n ,param-list[P .name] = [ ] 11 n . param -list [P. nam e] <— P . value) 12 B U il d-H ASSE-GRAPH (hasse-nodes)
To discover the containm ent relationships, it is necessary to com pute subgraph isomorphism between all pipeline group pairs. For our prototype, we implemented the algorithm proposed by Ullman [31]. We note that, although computing subgraph isomorphism is com pu tationally hard for general graphs,4 we have observed that, in prac tice, this computation can be efficient for pipelines represented as dataflows. Just to give an idea, for a collection o f over 7,000 pipelines, it took 140 seconds to generate their Hasse diagram. Besides, even if
4This problem is trivially reducible from the M A X-CLIQUB problem , a well-known NP-com plete problem |1 11.
this com putation takes long, it can be done in an offline process once for a collection, and be re-used m ultiple times.
The interface for the Hasse diagram is interactive, with zoom and pan functionality. This diagram gives a developer an overview of the collection and shows which pipelines share the same structure but have different param eter values. By clicking on a node of the diagram, the developer has access to another screen that provides details about all the pipelines in that group. The pipeline is displayed together with all the parameters that were changed, the num ber of tim es they were changed, and the set of values used to bind them. If the pipeline stores information about its executions, a plot of the execution times is also shown. This information is then used to help the construction of pipeline tem plates and views (Figure 7(b)).
4.2 Template and Pipeline View Creation
After selecting the interesting pipelines and extracting information about im portant param eters and values, the developer can use the Pipeline Template Editor to define the configurable pieces of the pipelines, by labeling subpipelines and parameters. To select a pipeline to be used as a tem plate, the designer simply clicks on the corresponding node in the Hasse diagram. This causes the Template E ditor to be invoked. W hen the developer labels a param eter or a subpipeline, all the relevant information associated w ith these com ponents that had been collected during the mining process is auto m atically added to the tem plate (e.g., all the values associate w ith the parameter). This is illustrated in Figure 7(b), which shows a set of parameters extracted from one o f the pipelines in Figure 7(a),
Once a tem plate is created, one of the operations supported by the Template Editor is view creation. W hile configuring a view, users can set the visibility of the parameters and configurable subpipelines, as well as select suggestions from the list stored in the template. Note that the information about both values as well as change frequency is very useful for configuring a view. Clearly, parameters that have had many different values are good candidates for being exposed. As shown in Figure 7(b), the value for param eter omega_f ram e was modified 178 times, while the param eter p r o p a g a tio n _ tim e changed 98 times. The values for these param eters can be used to create a list o f sug gestions for variables in the view. As we describe below, suggestions are included in the m ashup to guide the user interaction, e.g., besides typing a value in the interface, the user can also select a value from a list of suggestions. Note that both tem plates and views are stored in a repository where they can be accessed at a later time,
4.3 Medley Creation and Mashup Generation
To combine pipeline views in a medley, the designer uses the Medleys Editor. The views stored in the Pipeline View Repository are displayed on a panel and they can be dragged and dropped on a canvas. Once on the canvas, the medley operations (synchronization and composition) can be applied to the views, A screenshot of the M edleys E ditor is shown in Figure 8,
Each variable in a view has an associated handle— the circles on the left and right of each variable name in the pipeline view in Figure 4(c), By connecting the handles for two variables in distinct views, their val ues are synchronized. To simplify the task of identifying variables to be synchronized, when the designer starts a connection all the vari ables that are compatible with that variable are highlighted.
Vi sMa s h u p uses th e ch an g e-b ased p rovenance m o d el [19] to c a p tu re all th e c h an g e s m ad e to a m edley. W e d esig n ed and im p lem en ted a ch an g e alg eb ra th at cap tu res th e actions ap p lied to a m ed ley (e.g., sy n ch ro n ize v ariables) as w ell as to its c o m p o n en ts (e.g., h id e/expose view variables).
A m ashup is generated from a medley using the following algo rithms:
G F-N F-R ATE-A PP (m edley)
1 widgets = TREE()
2 window= C R FATE-WIN DOW (med ley) 3 fo r pipeline-viewin medley, pipeline-views
4 B viLD -G vi-'W lD G ETS(pipeline-view .root .window. widgets) 5 fo r sync in medley .syncs
6 Li n k-Wi d g e t s- Fr o m- Sy n c(4w )
Bu il d-Gu i-Wid g e t s (tem plate-node. parent .node)
1 widget = CREATE-COKTAIKER(parent.template-node) 2 child = MAKE-TREE-KODE(widget)
3 node. AD D -cm LD (child)
4 f o r var i n tem plate-node .children
5 B uiL D -G u i-W lD C E T S (v rfr. widget.child)
6 f o r pa r in var .param eters
1 widget-type — GET-FROM-REGISTRY(p«r. type)
8
wp CREATE-WIDGET(M7rf£'t7-/vpt\ w idget.par)G e n e r a t e - A p p autom atically derives a u se r in terface fo r a given m edley. T he in terface c o n sists o f a set o f w id g ets rep resen ted as a tree w hose root co rre sp o n d s to th e m ash u p w indow . F o r each v iew in th e m edley, th e alg o rith m iterates th ro u g h the view c o m p o n en ts and derives th e ir w id g ets by invoking B u i l d - G U I - W i d g e t s (lin es 3-4). A fter th e w id g ets are created, the w idgets that co rresp o n d to sy n c h ro n ized v ariab les in the m ed ley are linked (lines 5-6) — th is en su res that w h en the value is set fo r a w idget vr, th e sam e value is p ro p ag ated to all w id g ets linked to vr,
B u i l d - G U I - W i d g e t s generates the widgets for a pipeline view. It first creates a container for the view (line 1), and then recursively builds a widget tree following the view tem plate tree (Sec. 3.2). The widget types associated to the types of the variables are stored in a Registry. A widget is selected for a variable based on the mapping stored in the Registry. In the current implementation, the Registry is populated based on the types available in VisTrails, where designers can define their custom types and widgets, A planned extension to V is M a s h u p is to allow the designer to edit the Registry and config ure the choices independently of the underlying dataflow system. In addition to the widgets, canvases are created to display each of the outputs of a view. Note that the algorithms above are used to gener ate both client applications as well as W eb-based mashups. The main differences between the two kinds of apps is that the comm unication between a Web app and a medley is done via a Web service and it provides a more limited interaction w ith the visualizations,
4.4 Mashup Interaction
W hen a m ashup is created, a default layout is selected for the widgets. By activating the m ashup edit mode, the user can move the widgets around, hide and show widgets, enable and disable synchronizations. The new custom layout is saved as an attribute o f the medley associ ated w ith the m ashup, and the next time the m ashup is invoked, the custom layout is loaded.
When a container widget changes its value (e.g., changing from Cylinder to Cube in the pipeline view described in Figure 4), the mashup window needs to be updated accordingly. As the widgets in the window follow the hierarchy of the pipeline template, updates can be applied locally to that node—it is not necessary to update the other widgets in the window. The update procedure is shown below, UPDATE-APP(vi7f!rfovr.;rt't' — node)
1 parent ■— tree-node .parent
2
tem plate-node *— tree-node. w idget. template-node3 B uiLD -G ui-W lD G E T S(/«7;p/«/t'-?!orfe. parent .w idget. p a re n t)
4 RFMOVE-LINKS-FROM-WIDGFTS()
5 f o r sync i n window.medley.syncs
6 Lin k-Wid g f t s-Fr o m-Sy n c(4w )
Note that before U p d a te -A p p is called, the medley associated with that window detects the change events and stores the corresponding provenance information. Since variables can be removed, the syn chronization information may need to be updated as do the associated links between widgets. Finally, executing a mashup causes all pipeline views to update their corresponding pipelines using the values on the medley (the same as in the GUI) and trigger their execution,
5 Ca s e s t u d ie s
5.1 Sharing Astrophysics Analyses
Professor Joel Tohline's group at Louisiana State University (LSU) has been developing computational fluid dynamics (CFD) techniques
Fig. 8: Astrophysics VisMashup for comparing different visualiza tions. (a) Medley created for the VisMashup using 3 instances of a pipeline view with parameters p„„>, and propagation time synchro nized. (b) Using the VisMashup interface, the user explores different values for Q.frame. From top to bottom, the values used are —0.06, -0.041, and 0.0.
to model various astrophysical phenomena, including simulation of mass-transfer instabilities in binary star systems [7]. They use sci entific visualization tools and techniques to help them explore the results of these complex CFD simulations. They use VisTrails to construct complex pipelines that involve VTK modules to generate streamlines within each binary mass-transfer simulation, and custom analysis modules for identifying values for important parameters as sociated with the flows [29,30].
A binary star system consists of two stars orbiting around a com mon center of mass with an orbital period P. When the system is viewed from a frame that is rotating with an angular frequency & fram e = 2 7i/P, the system will appear to be stationary. During a
simulation, as mass and angular momentum are transferred from one star to the other, the binary system's orbital period together with the value of fI fmme is expected to vary. Using the most recent pipelines they developed [29], the scientists are able to examine the properties of binary mass-transfer flows from reference frames having a range of different angular frequencies Slframe = (Slo + A£2), where Qq is the frame of reference's angular frequency at the beginning of the sim ulation. As a result, they are able to determine which value of ASl provides the best measure of the true orbital period of the binary star system.
The LSU group has published these pipelines on their Web site [29], where they encourage people to try the different values of fI frame ar|d examine the behavior of the streamlines. Together with the pipelines, they provide annotations where they describe the relevant parameters and values. But to try these pipelines, users must download and install VisTrails, and also learn to use the system. In contrast, using V i s M a s h u p , a simple mashup can be created based on the LSU pipelines and deployed as a Web application. Users can then conveniently try the different Cl frame values using simple form-based interface in a Web browser.
The first mashup we developed was based on the pipeline shown in Figure 1. A limitation of this mashup is that, since it contains a single
ume rendered visualization. To ensure that the plots and the visualiza tion are derived for the same patient, the variables in the pipeline views corresponding to the patient (i.e., the input data set) are synchronized. 3D view, it does not easily support the comparison of different pa rameters. To address this problem, we added more views of this same pipeline to the medley and synchronized the parameters p„„>, and prop agation time in all of them (see Figure 8(a)). The new mashup is more suitable for the exploration of the SI frame parameter, allowing multi ple visualizations to be displayed and compared side by side. The app, shown in Figure 8(b), has three 3D views with a set of widgets for manipulating the parameters of each view. Users can then set a dif ferent value for SI frame >n eac'h window and compare the streamlines. This comparison is facilitated by the synchronization of the 3D view cameras.
5.2 Visualization in Neuroscience
The study of cognition and memory in humans has been an area of in tense study in recent years. Current literature shows that a wide variety of psychological disorders have a marked decrease in working mem ory performance and that a primary indicator of working memory is the spectral properties of the alpha band (8-12 Hz) in the dorsal lateral pre-frontal cortex (DLPFC) [26]. One method underdevelopment to help improve working memory performance is repetitive Trans-cranial Magnetic Stimulation (rTMS). lTMS has shown to be capable of pos itively manipulating the underlying spectral dynamics of human alpha rhythms to influence working memory performance [1].
In order to adequately measure the effects of lTMS on indi vidual alpha-band spectral dynamics and explore signal patterns in the desired region of the brain. Electro-encephalography (EEG) and Magneto-encephalography (MEG) are employed in conjunction with Magnetic Resonance Imaging (MRI). Commonly in collaborative studies, the data processing and visualization experts are unable to ad equately analyze the results and implications of the analysis pipelines they create. Likewise, the scientists who can analyze the spectral prop erties of cognitive dynamics do not have the experience required to write the robust pipelines needed in the study.
V i s M a s h u p supports collaboration among the different experts. Experts in data processing and visualization generate a series of pipeline views which expose only the functionality the scientists need. The scientists analyzing the results can then explore these views with out having to deal with complexities of the corresponding pipelines.
Figure 9 shows a mashup constructed from a medley that consists of two pipelines: one that generates a plot of a single EEG sensor's raw data and its S-Transformed representation, and another that creates a volume rendered image of a patient's brain. By using vismashups like this, the psychiatrist conducting this study was able to explore the pa tients' data more freely and more extensively without having to learn how to use the underlying visualization system. The visualization ex perts working on this study also benefited from using V i s M a s h u p because it allowed them to generate the final apps more quickly, re quiring less time spent training the scientist to manipulate complex pipelines.
Before having access to V i s M a s h u p , the expert responsible for creating the multi-modal visualizations needed in this study had designed had a single pipeline consisting of several disjoint sub pipelines. Each of these sub-pipelines handled a single data modality or processing technique. But for medleys to be effective, it is im
portant that the pipelines are modularized. Since medleys are com posed by distinct pipeline views, a medley consisting of composite pipelines is inherently difficult to manipulate. By enforcing stricter modularization on the development of pipelines, medley-enabled sys tems can benefit not only from more concise pipeline descriptions, but from more flexible display of the results.
6 Co n c l u s io n
We have described VISMASHUP. a new framework that simplifies the creation of custom visualization applications. Using VISMASHUP. an application developer can quickly assemble custom applications by leveraging an existing collection of visualization pipelines and their provenance. The mashups produced by V i s M a s h u p are not a sub stitute for more comprehensive, domain-specific applications such as CDAT. Instead, our target are simpler, exploratory applications.
Although V i s M a s h u p simplifies the development of one-of-a- kind. domain-specific visualization applications, it has some limita tions. The integration of different libraries can sometimes be compli cated by a number of practical issues, such as compatibility of under lying interface toolkit (e.g.. Tk vs Qt). Also, while we try to make sensible choices on the automatic layout of the interface, and we allow the users to tine tune it. this does not guarantee that the most appropri ate and intuitive interface for the task at hand is created.
There are several areas of future work that we would like to pur sue. First and foremost, we need to perform a more detailed eval uation of the effectiveness and usability of V i s M a s h u p . To do so. we will carry out user studies. To provide more flexibility in fil tering and selecting relevant pipelines, we plan to integrate more sophisticated interfaces that allows structural queries to be speci fied by example [2. 24], We also plan to explore alternative tech niques for mining the pipeline collection. For example, it can be useful to support different grouping/clustering strategies [23], Last, but not least, we would like to investigate environments where users can share and collaboratively develop applications. Such environ ments have been successfully deployed for Web mashups (see e.g.. http://www.programmableweb.com). But we believe that the ability to share visualization applications, in addition to data, will help advance existing efforts on collaborative data analysis [33] and it also has the potential to broaden the use of visualization techniques.
Ac k n o w l e d g m e n t s
We thank Joel Tohline for the astrophysics, and Erik Anderson and Gil Preston for the neuroscience case study. We thank the Vis Trails team members for their help with this work. Our research has been funded by the National Science Foundation (grants IIS-0905385. IIS-0746500. ATM-0835821. IIS-0844546. CNS-0751152. IIS- 0713637. OCE-0424602. IIS-0534628. CNS-0514485. IIS-0513692. CNS-0524096. CCF-0401498. OISE-0405402. CCF-0528201. CNS- 0551724). the Department of Energy SciDAC (VACET and SDM cen ters). and IBM Faculty Awards (2005. 2006. 2007. and 2008). E. San tos is partially supported by a CAPES/Fulbright fellowship.
Re f e r e n c e s
|11 I i A nderson, G. Preston, and C. Silva. Towards developm ent o f a cir cuit based treatm ent for im paired memory: A m ultidisciplinary approach.
IE E E E M B S Conf. on N eural Engineering, pages 3 0 2-305, 2007. |2 | C. Beeri, A. By a 1, S. Kamenkovich, and T. Milo. Q uerying business
processes. In VLDB, pages 3 4 3 -354, 2006.
13 ] G. Birkhoff. Lattice theory. Am erican m athem atical society, Providence, RI, revised edition, 1948.
|4 | J. M. Carroll and C. Carrithers. Training wheels in a user interface. C om m unications o f the A CM , 27(8):800-806, 1984.
151 Clim ate Data Analysis Tools (CDAT). http://www-pcmdi.llnl.gov/software- portal/cdat.
16| H. Childs, Ii. S. Brugger, K. S. Bonnell, J. S. M eredith, M. Miller, B. J. W hitlock, and N. Max. A contract-based system for large data visualiza tion. In IE E E Visualization, pages 190-198, 2005.
17 1 M. D 'Souza, P. Motl, J. Tohline, and J. fran k . Numerical Sim ulations o f the O nset and Stability o f D ynam ical Mass transfer in Binaries. The A strophysical Journal, 643(1 ):381 —4-01, 2006.
181 D. f’oulser. IRIS Bxplorer: A framework for investigation. A C M S1G-GRAPH C om puter Graphics, 29(2): 13-16, 1995.
I9| J. f’reire, D. Koop, I i Santos, and C. T. Silva. Provenance for com puta tional tasks: A survey. Com puting in Science & Engineering, 10(3): 11 21, M ay-June 2008.
110| P. I i H aeberli. ConM an: A V isual Program m ing Language for Interactive G raphics. In Proceedings o fS lG G R A P H '8 8 , pages 10 3 -1 1 1 ,1 9 8 8 . 1111 J. Hastad. Clique is hard to approxim ate within A cta M athem atica,
182:105-142, 1999.
|1 2 | IBM. O penDX. http://www.research.ibm.com/dx.
113| C. Johnson, R. M acLeod, S. Parker, and D. W einstein. Biom edical com puting and visualization software environm ents. Com m unications o f the A CM , 4 7 (1 1):64—71, 2004.
114) Kitware. The Visualization Toolkit (VTK) and Paraview.
http://www.kitware.com.
115) D. Koop, C. Scheidegger, S. Callahan, J. f’reire, and C. Silva. Viscom- plete: Data-driven suggestions for visualization systems. IE E E Transac tions on Visualization and Com puter Graphics, 14(6): 1691 -1 6 9 8 , 2008. 116| I i A. Lee and T. M. Parks. Dataflow Process Networks. Proceedings o f
the IEE E, 83(5):773—801, 1995.
117| K.-L. Ma. Im age graphs- a novel interface for visual data exploration. In
IE E E Visualization, pages 8 1 -8 8 , 1999.
118| R. Macleod, D. W einstein, J. de St. Germ ain, D. Brooks, C. Johnson, and S. Parker. S C IR un/B ioP S Ii Integrated problem solving environm ent for bioelectric tield problem s and visualization. In Proceedings o f the Int. Symp. on Biomed. Im ag., pages 6 4 0-643, 2004.
119| J. f’reire, C. T. Silva, S. P. Callahan, I i Santos, C. I i Scheidegger, and H. T. Vo. M anaging rapidly-evolving scientific workflows. In Interna tional Provenance and A nnotation Workshop (IPAWI, LN CS 4145, pages 1 0 -1 8 ,2 0 0 6 .
|2 0 | Mercury Com puter Systems. Amira. http://www.amiravis.com.
1211 T. M unzner, C. Johnson, R. Moorhead, H. Ptister, P. Rheingans, and T. S. Yoo. NIH -N Sf’ visualization research challenges report summary. IEE E Com puter Graphics a n d Applications, 26(2):20-24, 2006.
I22| S. G. Parker and C. R. Johnson. SCIRun: a scientific program m ing envi ronm ent for com putational steering. In Supercom puting, 1995.
12 3 1 I i Santos, L. Lins, J. P. A hrens, J. f’reire, and C. T. Silva. A first study on clustering collections o f workflow graphs. In IPAW, pages 160-173, 2008.
|2 4 | C. Scheidegger, D. Koop, H. Vo, J. f’reire, and C. Silva. Q uerying and creating visualizations by analogy. IE E E Transactions on Visualization a n d Com puter Graphics, 13(6): 1560-1567, 2007.
12 5 1 B. Shneiderm an. Prom oting universal usability with m ulti-layer interface design. In Proceedings o f the Conf. on Universal Usability, pages 1-8, 2003.
I26| H. Tan, W. Choo, S. f’ones, and W. Chee. Neuropsychological perfor mance in schizotypal personality disorder: Im portance o f working m em ory. The A m erican Journal o f P sychiatry, 162(10):1896—1903, 2005. 127| A. Telea and J. van Wijk. SM ARTLIN K: An agent for supporting
dataflow application construction. In Proceedings o f IE E E VisSym 2000,
pages 189-1 9 8 ,2 0 0 0 .
|2 8 | R. Telea and J. Van Wijk. VISSION: An Object Oriented Dataflow Sys tem for Sim ulation and Visualization. P roceedings o f IE E E VisSym 1999,
pages 9 5 -104, 1999.
I29| J. Tohline. LSU using VisTrails. http://www.phys.lsu.edu/tohline/vistrails/.
|3 0 | J. Tohline, J. Ge, W. liven, and I i Anderson. A custom ized python m od ule for C f’D flow analysis within VisTrails. C om puting in Science & Engineering, 11(3):68-73, 2009.
1311 J. R. Ullmann. An algorithm for subgraph isom orphism . J. ACM ,
23(1 ):3 1-42, 1976.
|3 2 | C. Upson, J. Thom as f’aulhaber, D. Kamins, D. H. Laidlaw, D. Schlegel, J. V room , R. G urw itz, and A. van Dam. The Application Visualiza tion System: A Com putational Bnvironment for Scientific Visualization.
IE E E Com puter Graphics a n d Applications, 9(4):30—4-2, 1989.
13 3 1 f’. B. Viegas, M. W attenberg, f’. van Ham, J. Kriss, and M. McKeon. ManyByes: A site for visualization at internet scale. IE E E Transactions on Visualization a n d Com puter Graphics, 13(6): 1121-1128, 2007. |3 4 | V isit Visualization Tool, https://wci.llnl.gov/codes/visit.
13 5 1 The VisTrails Project, http://www.vistrails.org. |3 6 | Yahoo! Pipes, http://pipes.yahoo.com.
|3 7 | f’. Yang, N. G upta, C. Botev, I i f’. Churchill, G. Levchenko, and J. Shan- m ugasundaram . W ysiwyg developm ent o f data driven web applications.