III Analytical Methods
III.1 Outline of chemical analysis in the environment
III.1.1 Analytical order of chemicals in the environmental samples
In order to be able to determine very small amounts (very low concentrations) of chemicals in the environment, it is necessary to follow a series of operations :
1) isolation (extraction and separation) of the target chemicals from sample matrix (air, water, sediment, living things, etc.).
2) separation and purification of the target chemical from co-extracted, non-target chemicals (sample clean-up).
3) sample concentration.
4) measurement by highly selective and sensitive analytical equipment, such as gas chromatography / mass spectrometry (GC/MS). Occasionally it is also necessary to derivatise (chemically modify) non-volatile and heat degradable target chemicals prior to analysis by the two most commonly used instrumental methods in environmental analysis, GC or GC/MS.
The following sections describe this series of analytical operations in more detail, and introduce some of the main analytical methods for environmental pollutants.
III.1.2 Sample preparation methods
III.1.2.1 Extraction / separation methodsA. Water samples
a) Selection of extraction methods
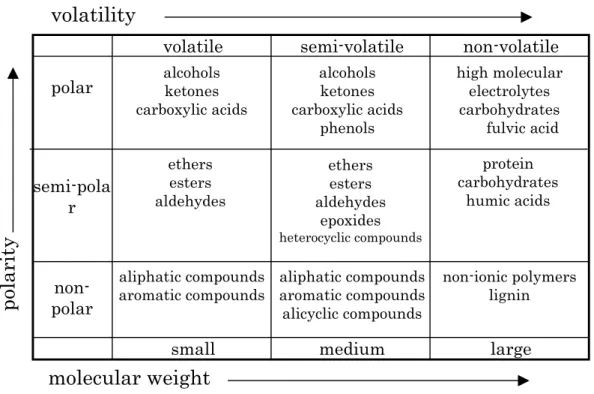
It is possible to categorise chemical substances and their solubility in water based on simple physico-chemical characteristics, such as their molecular weight, boiling point, and polarity (Figure III-1-1). Methods for isolating chemicals from water based on these broad chemical categories are shown in Figure III-1-2.
Figure III-1-1 Classification of chemicals by physicochemical character1)
Figure III-1-2 Chemical separation method for water samples1)
volatile
small
medium
large
non-volatile
semi-volatile
non-
polar
polar
semi-pola
r
alcohols ketones carboxylic acids ethers esters aldehydes ethers esters aldehydes epoxides heterocyclic compounds aliphatic compounds aromatic compounds alicyclic compounds alcohols ketones carboxylic acids phenols aliphatic compounds aromatic compounds non-ionic polymers lignin protein carbohydrates humic acids high molecular electrolytes carbohydrates fulvic acidpo
la
ri
ty
molecular weight
volatility
small
medium
large
volatile
semi-volatile
non-volatile
pH adjustment head space liquid-solid phase extraction none
non-
polar
reduced pressure distillation derivatisation freeze dry reversed permeation ultrafilirationpolar
semi-pola
r
purge & trap
liquid-solid extraction liquid-liquid extraction distillation liquid-liquid extraction liquid-solid extraction liquid-solid extraction liquid-liquid extraction
volatility
molecular weight
polarity
b) Volatile organic compounds
The two main methods for the isolation of volatile organic compounds from water are the purge and trap method and headspace method. These are described below;
(1) Purge and Trap Method (P&T)
This method, also known as the dynamic headspace method, removes (separates) volatile compounds from the sample matrix (in this case, water) by passing an inert gas such as helium or nitrogen through the matrix (purging). The target, volatile compounds are desorbed from the aqueous phase to the gas phase (purged) and are then separated from the stream of gas (trapped) by adsorbent filters. The adsorbent material is then heated in a stream of GC carrier gas (usually pure helium). This releases the trapped substances into the carrier gas, the target analytes are introduced to GC, and analysed. Typical trapping (adsorbent) materials are porous polymer beads, activated charcoal, silica gel, other GC column packing materials, or combinations of such materials.
Practically, this method can only be undertaken using one of a few specified instruments which are fully automated from the purging step, through trapping, releasing the target analytes, and introduction into to the GC.
The P&T method has following features and points:
1) The method is appropriate for micro-level analysis (ppt - ppb concentrations) because it is possible to analyse the whole volatile compounds in water samples.
2) The gas used to purge the sample absorbs significant amounts of water in addition to the volatile chemicals. One must remove this water prior to analysis because water causes interference in the GC/MS system.
3) After the volatile chemicals are released from the adsorbant by heating, one must introduce these compounds into GC column as a narrow band. If wide bore column is used, there is no need for any special treatment because it is possible to pass large carrier gas flows into the GC/MS system. However, when regular bore column is used, the end of column must be cooled (cryo-focused) at -100°C by liquid nitrogen to narrow the width of the band of chemicals.
4) Some volatile compounds are found extensively in the environment. The P&T method is highly sensitive, and analysis tends to be influenced by such extraneous, volatile compounds found in the purge gas and surrounding atmosphere. It is therefore necessary to protect the purified purge gas and the analytical system from contamination. Blank samples should be treated in the same manner as other sample in order to make sure there is no
contamination.
(2) Headspace method (HS)
Also known as the static headspace method, this method is less sensitive (ppb level) compared to the purge & trap method, but operation is simple, easily automated. The sample is placed in a sealed container, such as a vial, and left at a constant temperature until the gas and liquid phase are in equilibrium. The target substances in the gas phase (headspace) are collected by gas tight syringe. This is injected into the GC/MS. Calibration curve are made by dissolving the target chemicals in purified water, and then treated in the same manner. However, the air-liquid phase equilibrium is very much affected by matrix in which the sample is dissolved, so in a lot of cases standards dissolved in purified water might not be appropriate surrogates from which to prepare calibration curves. In such cases it is necessary to saturate samples with salt, add an external standard and then quantify the target chemicals (Standard addition method). Also, for samples which exist as ions in water the pH must be adjusted. For example, it is easy to analyse fatty acids in alkaline solution, if first the solution containing the fatty acids is acidified by sulfuric acid. It should be noted that pH adjustment is also often needed for the purge & trap method.
(3) Notes on the analysis of volatile compounds (i) preparation of purified water
One of the most difficult aspects of trace analysis of volatile compounds is to prepare water blanks not containing extraneous volatile compounds. It is common to use commercial mineral water, such as Evian, because it is so difficult to make one’s own blank water. In order to make one’s own, the following two methods might be tried:
1) purge purified water with high quality helium
2) boil hard ordinal purified water on a gas fire for more than one hour, and then cool down outdoors in an environment where there is naturally no volatile compound contamination place.
(ii) notes for using cryo focus
There are some trapping materials e.g. silica gel or charcoal, which do not remove enough water. As a result, water will freeze at cryo focus. The GC retention times of the target analytes will change unless sufficient water is removed by another method e.g. dry purge, etc.
c) Semi-volatile chemicals
Methods to extract semi-volatile compounds from water include liquid-liquid extraction, solid phase extraction, and recently developed solid phase microextraction (SPME)2).
(1) Liquid-liquid extraction
Solvent extraction methods use non-polar solvents which are miscible with water to extract the target compound from water by using the greater solubility of the target compound in the solvent than water. Ideally, one selectively extracts the target compound by using a solvent whose polarity is close to that of the target compound. Volatile solvents such as hexane, benzene, ether, ethyl acetate, and dichloromethane are usually used for the extraction of semi-volatile compounds from water. Hexane is suitable for extraction of non-polar compounds such as aliphatic hydrocarbons, benzene is suitable for aromatic compounds, and ether and ethyl acetate are suitable for relatively polar compounds containing oxygen. Dichloromethane has high extraction efficiency for a wide rage of non-polar to polar compounds. Dichloromethane is suitable for simultaneous analysis because of the following advantages: its boiling point is low and easy to reconcentrate after extraction, it is easy to separate from water because of its higher specific gravity, and it is non-flammable. However, dichloromethane, like benzene, is carcinogenic, and recent trends have been to refrain from using these solvents in liquid-liquid extractions. It is sometimes possible to selectively extract semi-volatile compounds from water by changing the character of samples, not changing solvents. For example, by changing the pH of samples, only acid or basic substances can be extracted. When pH of the water is less than 2, basic compounds become fully ionised and are not extracted by the solvent, allowing selective extraction of acidic and neutral compounds.
When extracting compounds which are relatively soluble in water, salting-out techniques are used in order to increase extraction rates. Adding salt to an aqueous sample decreases the solvation power of the solution and the solubility of target compounds. This is useful not only for liquid-liquid extraction but also for headspace and solid phase extraction methods.
Extraction is commonly achieved by shaking the water sample and solvent in a separating funnel. However, occasionally large amounts of emulsion are formed, and it is difficult to separate the solvent from the aqueous phase. If this occurs, the emulsion is often efficiently dispersed (broken down) by adding either a small amount of ethanol, by sonicating the mixture in ultrasonic bath, or by adding anhydrous sodium sulfate, or continuous liquid-liquid extraction can be performed on samples which form emulsions. Continuous liquid-liquid extraction methods repeatedly circulate solvent in special glassware but, although this method has good extraction efficiency, it is not suitable for thermally unstable compounds because the extraction time is long.
(2) Solid-Phase Extraction (SPE)
Solid phase extraction (SPE) is a more rapid, modern alternative to liquid-liquid extraction. SPE is based on the principle that the components of interest are retained on a special sorbent
contained in a disposable mini-column (cartridge). By using SPE one can remove matrix interferences (these either pass through the cartridge or are subsequently washed off) and then isolate with selective enrichment one’s target compounds. Solvent use is small. Common cartridges packing materials (solid phases) are charcoal3),4) and XAD5) resin, silica gel chemically bonded with ODS6),7), and high-polymer resin such as polystyrene8),9) and polyacrylate9). Cartridges pre-packed with known quantities of adsorbent are on the market, and they are ready to use after simple conditioning.
There are some disadvantages to solid-phase extraction, which are:
• Although solvent use is small, the solvent flow rate affects the recovery rate.
• For samples which include suspended solid (SS), it is necessary to separate SS composition. • For samples which are heavily contaminated, it is possible to get analyte break through. • In order to have high and stable recovery rates, it is important to choose the most
appropriate solid phase for the target compounds (refer to solid phase manufacturers’ manual). One must undertake recovery tests by adding known quantities of standard into the sample matrix, passing such samples through cartridges, eluting the target compounds, then determining the amount of analyte recovered.
(3) Solid phase microextraction (SPME)2)
SPME is a method used to both extract and concentrate organic compounds in which a fibre needle attachment which has been chemically coated with a fused silica equivalent to a GC liquid phase, is dipped directly into liquid samples, or exposed to the headspace vapors from liquid or solid samples. Because SPME has only recently been developed, there are few reports of its use with real environmental samples, and we must wait for the results of future investigation before recommending use. However, the fact that organic compounds can be analysed easily and quickly without using any solvents suggests that this is the direction in which the next generation of analytical methods should proceed.
B. Sediment, soil, and biological samples
a) Purge & trap method (P&T, dynamic headspace method)
The purge & trap method can be used to extract volatile compounds from solid samples such as sediment. The sample (less than 1 g) is placed into the purge bottle, suspended in adding water, then treated and subsequently analysed in the same manner as water samples. Samples which include high concentration of VOC are extracted with methanol, and then a part of extract is analysed by purge & trap after being added to blank water.
b) Organic solvent extraction method
There are three organic solvent extraction methods for semi-volatile compounds from solid samples: 1) Soxhlet extraction, 2) extraction after mechanical mixing such as shaking, homogenisation, or stirring, and 3) ultrasonic extraction.
(1) Soxhlet extraction
In soxhlet extraction, organic components in solid samples are extracted from the matrix by continuously washing the solid with a volatile solvent in a specialised piece of glassware (soxhlet extraction apparatus). This is the most common method for extraction of organic compounds from solid samples, and is used as an extraction rate standard for the newly developed extraction method known as supercritical fluid extraction. Non-polar solvents such as benzene or dichloromethane, polar solvents such as methanol, or mixtures of polar and non-polar solvents whose boiling points are close to those of ethanol / benzene, or acetone / hexane are used. Benzene is known to be an especially efficient extraction solvent for PAHs, and acetone for sulphur-containing compounds. However, soxhlet extraction takes long time to get high extraction efficiency, and is not suitable for organic compounds which are thermally unstable.
(2) Methods extraction after mechanical mixing such as shaking, stirring, or homogenization
Shaking and stirring: These methods are in essence derivations of liquid-liquid extraction. Sample extraction is achieved by simply placing solid samples in centrifuge containers with organic solvents and shaking. After extraction, separate sample matrix and extracts by centrifugation or filtration.
Homogenization: This method is suitable for the extraction of non-polar compounds in biological samples. Anhydrous sodium sulfate is added to the sample, the sample is then homogenised in the presence of a non-polar solvent. After extraction, separate sample matrix and extracts by centrifugation or filtration. Extracts usually include lipids, so defatting processes are required before analysis.
(3) Ultrasonic extraction
Ultrasonic extraction uses ultrasonic vibrations to extract samples with polar solvents in an ultrasonic bath. This is often used for chemical extraction from solid samples because it’s simple.
c) Steam distillation (including circulating steam distillation)
In steam distillation, steam is introduced into a macerated solid sample. The target analytes are co-distilled out of the sample container with the steam, and are collected after condensation of the steam to liquid water. In the circulating method, the condensate is extracted by liquid-liquid extraction using a non-polar solvent. Steam distillation is used for compounds with a relatively high vapor pressure which are not soluble in cold water. Steam distillation is an operation which has both extraction and separation / fractionation functions. Because it can separate target compounds from non-volatile compounds and sulfur contained in sediments, purification after extraction is easy.
d) Supercritical Fluid Extraction (SFE)
Gases such as CO2 and N2O become fluid when temperature and pressure reach a critical point called the supercritical phase. In supercritical fluid extraction (SFE), this fluid is used to extract target substances in solid samples. This is a relatively new method which has recently begun to be applied extensively. Instruments connecting the SFE apparatus and on line GC have been developed in which the series of steps from extraction to analysis have been automated.
The sample is placed in an extraction chamber through which the supercritical fluid is forced, the target substances are extracted from the samples and trapped in vials by small amounts of methanol or ODS resin. The amount of organic solvent used is much smaller than soxhlet extraction.
The fluids used for SFE include CO2, N2O, SF6, methanol, and water. The fluid used is chosen to meet the analytical purpose. The most commonly used is CO2. However, supercritical CO2 is very non-polar, so modifiers are added to improve extraction efficiency for polar compounds. Modifiers for CO2 include methanol, dichloromethane, acetonitrile, water etc. Modifiers are mixed with the CO2 using a pump, or spiked directly into the samples.
C. Air Samples
Air samples are categorised as being particulate and gas depending on the phase in which the target substances are found in the air. Since sampling methods for the two types of air sample are different, as mentioned in Chapter 2, sample preparation methods are explained for each sampling method.
a) Solvent Extraction from Filter Papers or Adsorbents
Filter paper is used to trap particulates, while adsorbents are used for samples containing substances intermediate between particulates and gases. Extraction methods for target substances trapped on filter papers and adsorbents are those used for solid samples and sediments etc., such as ultrasonic extraction and soxhlet extraction. However, ultrasonic extraction is not suitable for polymer adsorbents, since they are not strong enough. Use soxhlet extraction for such polymer adsorbents and polyurethane foams. On the other hand, soxhlet extraction is not suitable for volatile and thermally unstable substances. For such compounds, and other adsorbents use ultrasonic extraction. Changing solvents to meet the requirements of different adsorbents or target substances can make for more efficient extraction. When using a polar solvent such as acetone, add salt water after extraction, and then extract by liquid-liquid extraction with a hydrophilic solvent.
b) Thermal Desorption
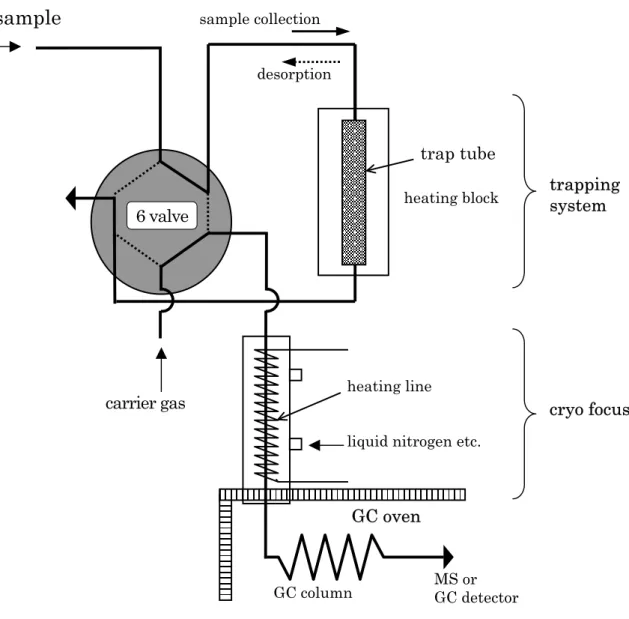
Adsorption followed by thermal desorption can introduce the whole trapped target substances into GC / MS. This makes such methods suitable for analysing volatile compounds, and samples containing low concentrations of target analytes where it is not easy to be collected large amounts of sample. The basic scheme is shown in Figure III-1-3. Adsorbed compounds are thermally desorbed by heating the adsorbent material with a heater. Changing the direction of flow of the GC carrier gas by using a three-way valve allows introduction of these compounds into the GC column. Equipment in which all procedures are automated is on the market. Such equipment generally has a cold trap, where desorbed samples are temporarily trapped in a concentration tube (cold finger) cooled by liquid nitrogen, and then introduced into the column by heating. Such cold trap functions make sample introduction quicker, and gives sharper peaks.
Figure III-1-3 Flow direction in adsorption trap-thermal desorption method
III.1.2.2 Dehydration Methods
Because extracts from liquid-liquid extractions often contain water originating from the sample, sample concentration or clean-up using columns cannot be done directly. Thus, it is necessary to dehydrate the extract. Dehydration is most commonly achieved by using anhydrous sodium sulfate. Samples are dehydrated by adding the anhydrous sodium sulfate directly to the extract and then filtering the dry solvent solution, or passing the samples through a column or funnel packed with anhydrous sodium sulfate.
sample collection desorption
6 valve
carrier gas
heating lineliquid nitrogen etc.
cryo focus
heating blocktrap tube
air sample
GC columnGC oven
MS or GC detectortrapping
system
III.1.2.3 Concentration
Use a Kuderna-Danish (KD) concentrator or rotary evaporator to concentrate the extract or column chromatography eluant. Whether the KD method or rotary evaporation is chosen depends on the boiling point of the target compounds, their sublimation character, timeframe for analysis etc.
A. KD Concentration
KD concentration takes longer than rotary evaporation, but there is less loss of target chemical through evaporation, and this method is as applicable to low boiling compounds as to high boiling compounds. This method is able to concentrate samples down to a few mL. For further concentration, one must use a micro-Snyder column or evaporate under a stream of nitrogen. Evaporating under nitrogen gas may cause evaporative loss of low boiling point compounds. However, the micro-Snyder column method can concentrate samples containing low boiling point compounds to volumes of 0.5 mL.
B. Rotary Evaporation
Rotary evaporation can concentrate large volumes of samples in a relatively short period of time. However, it has big evaporative losses and is not suitable for low boiling point compounds.
III.1.2.4 Clean-up Method
Extracts from environmental samples can be complicated mixtures. Components of these mixtures can interfere with GC and HPLC analysis by giving poor separation because of over separation capacity of a column or by containing compounds that elute at the same time as, and interfere with, the target compounds’ peaks. Also large amounts of non-volatile compounds or polar compounds can contaminate GC injection ports and columns, which in turn causes problems with analysis. It is, therefore, necessary to clean up, or remove, non target compounds as much as possible. Clean-up methods include acid - alkaline partition, acetonitrile - hexane partition, and column chromatography. Column chromatography separation can involve adsorption, partition, gel permeation, ion exchange etc. The following section describes clean-up methods usually used for environmental analysis.
A. Adsorption Chromatography
Adsorption chromatography is able to separate the constituents of complex samples according to equilibrium between adsorbent (stationary phase), solute (chemicals) and eluent (eluting agent). Generally normal phase chromatography is used. Samples are dehydrated and concentrated, then added to the column. The column is eluted first with a non-polar solvent such as hexane, and then the polarity of the solvent is gradually increased. This has the affect of progressively eluting more polar constituents. Adsorption chromatography is most suitable for the separation of relatively non-polar compounds. Adsorbents typically used are alumina, silica gel, and florisil. The relative strength of adsorption of these materials is: silica gel < florisil < alumina. The suitability or nonsuitability of these materials for the target compounds depends on the strength of adsorption. To find the most appropriate adsorbent, refer to published papers and actual tests. Perform actual sample analysis after confirming adsorption activity level, composition of eluent, and elution pattern because there are some compounds which decompose in the commonly used eluents, such as diethyl ether or acetone.
a) Silica gel
Silica gel is weakly acidic, amorphous silica. Activate this adsorbent by heating at 150 - 160 °C for several hours. It is common to contain 3 - 5 % by weight water in the adsorbent because completely activated silica occasionally does non-reverse adsorption. This material is useful for compounds containing most ionic and non ionic functional groups. However, one must be cautious when using eluents which contain methanol or ethanol because they decrease the adsorbent’s adsorption activity.
b) Florisil
Florisil is the commercial name for a magnesium silicate with an acidic character. This material is available on the market from Floridin Co. in a form which has been activated at 667 °C. This material is mostly used for clean-up of samples for GC containing pesticides, organochlorine compounds, esters, ketones, phthalic esters, nitrosoamines, organophosphate pesticides (which include a phosphorus - oxygen bond which can decompose on florisil), separating aliphatic and aromatic hydrocarbons, etc. However, florisil’s activity varies between batches, one must watch out for changes in elution patterns. In addition, it is known that some pesticides decompose in ethylether on florisil.
c) Alumina
There are three types of alumina, basic (pH 9-10), neutral, and acidic (pH 4-5). Alumina is used after dehydration at 400 - 450 °C. Water is added to the alumina to adjust activity. Basic
alumina has the strongest adsorption capacity, and is used for basic and neutral compounds, such as alcohols, hydrocarbon, steroid, which are stable in alkaline media. However, ethyl acetate cannot be used as an eluent because esters are unstable in alkaline media and decompose. Acetone cannot be used as an eluent because it causes amidol condensation and produces diacetone alcohol. Neutral alumina has lower activity compared to basic alumina, and is used for aldehydes, ketones, quinones, esters, etc. Acidic alumina is suitable for acidic pigments (dyes) or acidic compounds which are adsorbed by basic and neutral alumina.
B. Partition Chromatography
Partition chromatography is able to separate the constituents of complex samples according to partition equilibrium between a non-polar solid phase and a polar solvent (in this case separation is by reverse-phase chromatography). The non-polar solid phase is packed into a column, the sample mixture dissolved in water and loaded onto the column, then the components of the mixture, from most polar to least polar, are eluted with solvent mixtures such as water - methanol, or water - acetonitrile. This method is, therefore, most suitable for separation of high polarity compounds. The most commonly used solid phase is ODS, which has an octadecyl function bonded to the silica particle. This material is commonly used for the fractionation of samples by HPLC.
C. Gel Permeation Chromatography
Gel permeation chromatography separates molecules by size. Compounds are separated when sample mixtures are passed through a column packed with material of a known pore size. Larger molecules elute faster. Gel permeation chromatography is used as a general separation method for semi-volatile compounds. However, the separation ability is worse than other chromatography methods, so GPC is generally used to remove lipids, proteins, and natural resins from samples, not for detailed fractionation.
D. Ion-Exchange Chromatography
Ion exchange chromatography is used to separate compounds which have fully ionisable function groups. Samples are loaded onto the top of a column packed with an ion exchange resin, and eluted by an electrolyte solution. Which ions are separated and the order they are eluted depends on the ion exchange- adsorption character of the molecules with the resin.
E. Acetonitrile - Hexane Partition
Target compounds are partitioned into the acetonitrile phase, and lipids partitioned into the hexane phase. However, when the target compound’s polarity is extremely small, the target compound too can partition into the hexane phase.
F. Acid - alkaline Partition
Acid-alkaline partition is used to separate neutral, acidic, and basic components by adjusting the pH of aqueous samples. Compounds such as phenol can be extracted into organic solvent when aqueous samples are made acidic (below pH 2). Next, phenols in the extract are reverse extracted by water of pH is 12 - 13. Finally, this aqueous phase is acidified (to below pH 2), and re-extracted by organic solvent. In this manner, only phenols can be extracted from samples. Basic compounds such as amines can also be separated by pH reversal.
G. Sulfur-Cleanup
Elemental sulfur is often found in anaerobic sediment samples. Elemental sulfur can be dissolved in a number of solvents, since its solubility is quite similar to organochlorine and organophosphate pesticides. Sulfur is eluted in the first fraction eluting from florisil clean-up columns. When analysing samples which include sulfur, unless sulfur is removed, an interference peak caused by sulfur is often found between the solvent peak and that of aldrin. To remove sulfur, stir sample solutions well with either copper powder, mercury, or tetrabutyl ammonium solution. Since some compounds which contain sulfur or phosphorus, such as phosphates or pesticides, are unstable, one must check these compounds’ stability before treating the samples with sulfur removing materials.
H. Alkaline Decomposition
Alkaline decomposition is used to extract compounds which are stable in alkaline media, such as PCBs, from biological samples which contain lipids. Such samples are refluxed in alkaline ethanolic solution. This saponifies lipids. Salt solution is added to the sample, and the target compounds are extracted by liquid-liquid extraction. It is possible to remove lipids and extract target analytesat the same time using this method.
III.1.2.5 Derivatisation
Derivatisation involves chemically modifying the target compounds. It is common to convert hydroxyl group (phenols), carboxyl groups (fatty acids), amino groups (amines), and organometallic
compounds (organotins) into their trimethylsilyl, ester, acyl, and alkyl derivatives. By derivatising such chemical functional groups, one can make non-volatile compounds volatile. Thus one can analyse by GC compounds which normally cannot be analysed by GC, including compounds which are normally adsorbed by separation columns. It is, however, possible to analyse some polar compounds without derivatisation if one uses a fused-silica capillary column. One should not rush to derivatives target compounds because there are problems with derivatisation which must be carefully considered, such as yield of derivatisation, derivative recovery, stability of a derivative, identification and confirmation.
A. Esterfication
Methyl ester derivatives are generally stable, isolation is usually easy, and it is often possible to confirm the yield and stability of reaction products. After methylation, the increase in molecular weight of the methyl ester derivatives is small, some show molecular ions in mass spectra, and one may therefore use data reference systems. However there are some problems, for example, methylating reagents are often not highly reactive, and many don’t react with alcoholic hydroxyl groups and amine groups, although they are used for fatty acids.
B. Silylation
Trimethylsilylation (TMS) shows the highest reactivity of all derivatisation methods for most compounds which have active hydrogens. However, this method should only be chosen when methylation and acetylation cannot be used, since there some disadvantages:
1) products of silylation are easily hydrolysed and cannot be stored for long periods
2) products of silylation often cannot be isolated, and therefore reaction solutions often have to be analysed directly by GC
3) injection of reaction solutions into GC tends to make GC ‘dirty’ because inorganic silicone compounds are formed
4) polyethylene glycol (PEG) columns react with silylating reagents. C. Acetylation
This is one of the most often used derivatisation methods, because acylating agents react well with many functional groups, such as alcohols, thiols, and amines. Fluoroacetylation, particularly heptafluoropropionylation, is often used because highly sensitive analysis by ECD or MS is possible.
D. Other Derivatisation Methods
Pentafluorobenzylhydroxylamine (PFBOA) and 2,4-dinitrophenylhydrazine are used for derivatisation of aldehydes. Also “Grignard” reagent is used for alkylation of organotins10).
III.1.3 Instrumental Analytical Methods
Only GC / MS is discussed hereafter because of the high sensitivity, high selectivity, universality, and the large amount of information available on what is often considered the most appropriate analytical instrument for environmental analysis.
III.1.3.1 GC/MS Analysis
It is not too much to say that whether trace chemical analysis by GC / MS is successful or not depends on whether the set-up of the GC is appropriate for the target compounds or not. Recently because many analyses use fused-silica capillary columns, there has become less need to pay attention to the selection and inactivation of columns (cf. when packed columns were used). However, in order to analyse chemicals at sub-ng concentrations efficiently and accurately, it is still necessary to carefully choose columns, sample injection conditions, column temperature conditions, etc. Selection of quantifying ions directly affects MS identification and detection limit. Here follows some basic information which should be known when trace chemicals are to be identified and quantified by capillary GC / MS and things which should be considered when undertaking GC/MS.
III.1.3.2 Factors Affecting Capillary GC Analysis
Good separation in the shortest period of time is the ideal (optimum) for good GC analysis. These criteria are related to the liquid phase of columns,film thickness, length, internal diameter, and temperature.
A. Selection of capillary column
a) Selection of liquid phase of capillary column
Capillary columns are available with many kinds of liquid phase, from non-polar methylsilicones to highly polar polyethylene glycols. For the analysis of most compounds it is sufficient to use four types of liquid phases - methylsilycones, phenylmethylsilicones, cyanopropyls, and polyethylene glycols. Selection of the most appropriate liquid phase, and hence column, to
separate target compounds is dependent on partition coefficients. For instance, to separate non-polar components such as n-alkanes, use non-polar columns - these have the largest partition coefficients for such components. Highly polar liquid phase columns, such as PEGs, are suitable for analysis of highly polar compounds such as alcohols. However, polar columns (especially PEGs) are often thermally unstable and oxygen sensitive, and often have problems with column bleeding. As a result, their operating temperature is limited compared to non-polar columns. These disadvantages make columns with highly polar liquid phases difficult to use. Therefore, if a target chemical shows a sharp peak with no tailing peak, one has to choose a column with a lower polarity liquid phase. Choose columns by referring to analytical method information supplied in column suppliers’ catalogues and published analytical methods.
b) Column length
The length of a column length directly affects separation efficiency and analysis time. Although separation efficiency is proportional to the square root of column length, it is not recommended to use very long columns in order to improve separation because analysis time is proportional to column length. For example, when a 30 m column is exchanged for a 60 m column, separation improves 1.4 times but analysis time is doubled. However, simply cutting a few meters off the end of a dirty column doesn’t make a big difference to separation efficiency.
c) Column internal diameter
The internal diameter of a column affects column efficiency, retention character, and the amount of sample that may be loaded onto the column while still obtaining analyte separation. The smaller internal diameters, the better separation efficiency, but the less sample may be loaded onto the column. For environmental analysis, column bore of internal diameter 0.2 - 0.35 mm is generally used. Columns whose internal diameter is about 0.25 mm give good separation, although one can load larger samples onto columns whose internal diameter is about 0.32 mm. Wide bore columns, i.e. with an internal diameter of more than 0.5 mm, can be used as substitute for packed columns because the amount of sample that may be loaded is usually several µg for each constituent. However, such columns cannot be used for GC/MS unless the GC/MS has a large vacuum pump (and even so regular bore column resistant tubing is needed), or an enricher (apparatus which separates helium at the interface between the GC and MS).
d) Film thickness
The film thickness affects the column’s relative character and amount of sample that may be loaded onto it. The thicker film is, the larger the sample that may be loaded onto the column. Columns with thicker films are suitable for the analysis of low boiling point compounds because
solute constituents are held strongly by the column. Conversely, thinner columns are suitable for the analysis of high boiling point compounds (analysis of high boiling point compounds using thicker film columns requires higher column temperatures, which in turn causes increased column bleeding). For GC/MS, columns should be used which have little column bleeding and unnecessarily thick film columns and non chemical bonding type columns should be avoided. Because small internal diameter and thin film columns can only be loaded with small amounts of sample, it is necessary to take measures to prevent peak shape abnormalities, such as leading, by minimising the amount of sample loaded onto the column or by using a different column.
e) Basic columns
In light of the factors outlined above, the following columns should be considered for chemical analysis of environmental samples:
• For volatile compounds: liquid phase, methylsilicone; length, 60 m; i.d., 0.32 mm, film thickness, 3 µm.
• For semi-volatile compounds : liquid phase, methylsilicone or 5% phenyl 95% methylsilicone; length, 25 - 30 m; i.d., 0.2 - 0.32 mm; film thickness, 0.1 - 0.5 µm.
B. Sample Injection Methods
For capillary columns, there are three principle requirements for any injection method, namely to introduce samples as a narrow width band, to not change sample composition, and to have good reproducibility. Common sample injection methods recently are direct injection, split/splitless injection, and on-column injection methods. In order to select the method that is most suitable for the samples in hand and meet the above criteria, one must understand some of the key features of these methods.
a) Direct injection
In direct injection methods, the whole sample is introduced into the vaporising chamber. This method is used for widebore columns whose internal diameter is more than 0.5 mm, or packed columns. The injection port temperature is typically 20 - 30 °C higher than the GC oven (column) temperature for iso-thermal analysis, and also typically 20 - 30 °C higher than the final oven temperature when temperature gradient programming is used.
b) Split / splitless injection
Split and splitless injection methods can be used at the same injection port.
• Split method: In this method, the sample is vaporised instantly in the gas chamber, then a narrow sample band is introduced into the column by introducing only a small part of the
vaporised samples and discharging the rest. This is a useful method for samples with high concentrations of target analytes. It is not suitable for samples with low analyte concentrations such as environmental samples. Also, when analysing compounds which contain a mixture of components with a mixture of boiling points (low, medium, high), such as petrol, fractional distillation (discrimination) may occur in the vaporisation chamber. To prevent this, increase the temperature of the vaporisation chamber, and increase the system’s heat capacity putting deactivated glass wool into the insert (injection liner).
• Splitless method : In this method, the sample, including any solvent, is introduced onto the column through a modified heated vaporiser. Solvent is removed from the sample by venting the injection to the atmosphere when most of the solvent and essentially all of the sample have entered the column - perhaps 30 sec to 2 min. The correct lag time before venting is critical since too little time causes loss of sample, too long a time period causes a solvent peak larger than necessary and which in turn may cause spectral interference. This method is suitable for environmental samples because it is able to introduce samples with low target analyte concentrations quantitatively into columns. In addition, relatively non-volatile compounds, which often cause damage to columns, are not volatilized and therefore do not penetrate far into the column. Chambered injection port liners are used with the splitless method because this method doesn’t need to vaporize samples (cf. split method).
c) On-column injection
In on-column injection, the sample solution is injected onto the column as liquid, and then the column temperature is increased. This procedure makes this injection method suitable for the analysis of thermally unstable compounds. This is suitable for trace analysis because the whole sample is injected onto the column. However, if contaminated samples are injected, the column’s useful working life span is shortened because in this case relatively non-volatile compounds, which often cause damage to columns, are volatilized and can penetrate far into the column. Therefore, it is usual to attach a guard column to the separation column to prevent column contamination.
Recently the Septum Programmable Injector (SPI) has become popular. This equipment has improved cool on-column methods since with it is possible to control the injection temperature independently of the oven’s cooling and heating cycles. It is thus possible to setup injection conditions optimised for producing narrow sample band-widths.
There are two ways to use mass spectrometers in scanning mode or selected ion monitoring mode (SIM). In order to select the appropriate operating mode, one must understand some of the key features of these methods.
A. Scanning method
When operated in the scanning mode, the mass spectrometer records the mass spectrum of all ions detected within a defined mass range by scanning at predetermined mass (m/z) intervals. The record of total ion intensity on each scan with time is called the total ion chromatogram (TIC). The TIC is equivalent to, for instance, a GC-FID chromatogram. The data making up the TIC is recorded electronically, and specific m/z information can be extracted and printed. These latter are called mass chromatograms. The scanning method can change identifying ion freely after analysis, and there is often no need to re-analyse the sample even if there are interfering peaks.
The accuracy and reliability of analyte identification is significantly better than SIM, because one can obtain the mass spectrum of the target compound using the scanning method. However, the method’s sensitivity is theoretically much worse than SIM (several to several tens of times) in the case of magnetic field type quadrupole mass spectrometers - low resolution MS cannot perform trace analysis. Finally, the amount data collected is extremely large compared to SIM.
B. SIM method
When operated in the SIM mode, the mass spectrometer monitors specified ions with high sensitivity. This is done by setting up electric or magnetic fields (depending on the instrument design) which focus only ions of a predetermined m/z ratio on the detector. A SIM chromatogram equivalent to the mass chromatogram obtained by the scanning method can also be obtained. As mentioned earlier, the sensitivity of SIM operation is better than the scanning method because the time spent on analysis of the target analyte ions is longer. Recent GC/MS systems have been developed that can routinely detect picogram (pg) levels of organic compounds. However, the number of ions which can be measured at any one time is generally limited to ten. This means the number of compounds which can be analysed at any one time is generally limited to five (at least ten sampling points for each GC peak are needed to get an accurate area for the GC peak. Therefore, if 2 ions per compound are monitored, the number of compounds which can be measured at the same time is limited to a maximum of five). In order to overcome this limitation, a Grouping method which changes the measured ion depending on GC retention time is used.
The accuracy and reliability of analyte identification is lower compared to scanning method because the number of ions measured is limited. Selection of ions to be monitored is important in
order to get high sensitivity and high reliability of identification. Usually multiple ions per compound are measured, and it is necessary to confirm the compounds from relative isotope intensity ratio.
a) Selection of quantifying ion and confirmatory ion for SIM method
In principle one tries to select ions with high sensitivity and high selectivity. First, measure the accurate mass spectrum of the target compound, confirming compound identity by comparison with library spectra. When the intensity of the target compound’s molecular ion (parent ion) is high, make that ion the quantifying ion. If the molecular ion is small, choose an ion of high mass number (m/z) and high intensity as the quantifying ion (ions whose mass number (m/z) are less than 100 should be avoided). Choose a confirmatory ion (an ion known to be derived from the target compound and which proves the presence of the target) of high mass number (m/z) and high intensity. Compounds which contain chlorine or bromine produce isotope ions (molecular and fragment ions containing the chlorine or bromine isotopes) in the same ratio as the ratio of naturally occurring chlorine or bromine isotopes. These isotope ions are characteristic and the number produced depends on the number of chlorine or bromine atoms within the molecule. Isotope ions are ideal as confirmatory ions. After deciding which ions to monitor, measure standard solutions, and check if the desired is achieved, if the background noise is small compared to the signal intensity (S/N ratio is fine), or if there are no interferences, etc. If such parameters cannot be achieved, change the measurement ions.
III.1.3.4 Methods for the Calculation of Concentration A. External Standard Method
The external standard method uses the relationship between peak areas (or height) and analyte concentration. The calibration curve is constructed after multiple, identical injections of a number of standard solutions of known concentration into the GC/MS.
Calibration curves for wide (mega) bore columns can be constructed after manual injection of samples, since several µL of samples is injected at one time and the variation in injection volume is small compared to the total volume injected. However, for regular bore columns, use of an autosampler is desirable, since the volume of sample injected is small and autosamplers are capable of very precise injection of small volumes.
B. Internal Standard Method
the target analyte are prepared in the same way as if using the external standard method, but to each is added a known amount of an internal standard. The solutions are measured. After measurement, calibration curves are constructed using the relationships between target analyte peak intensity and that of the internal standard (target compound peak intensity: internal standard peak intensity ratio) and target analyte concentration and that of the internal standard (ratio of target compound concentration: internal standard concentration). When determining target analyte concentrations in real samples, add the same amount of internal standard to the sample as added to the standard solutions, then calculate the concentration of target analyte from the target compound peak intensity: internal standard peak intensity ratio.
When using the internal standard method, it should be noted that the relative standard deviation (coefficient of variance) of ratios of peak intensities generally becomes larger as the separation (difference in retention times) of the internal standard and the target compounds increases. Therefore, a compound whose retention time is close to that of the target compound should be used as the internal standard, and when many target compounds with wide ranging retention times are being investigated, use of multiple internal standards is desirable. Finally, the chosen as internal standards should obviously not be found in the samples, and should be sufficiently stable to allow analysis by GC/MS. Internal samples synthesized using stable isotopes, such as deuterium or 13C, are ideal compounds.
C. Relative Response Factor method
When a large number of compounds are being investigated simultaneously, it becomes difficult to make calibration curves for each measurement. In such cases, use the relative response factor method. This method is a variant on the internal standard method. First, make calibration curves (a minimum of five points from the detection limit of the instrument to the highest necessary concentration) in the usual manner. Then find linear range of calibration curves for each compound, and calculate the sensitivity against internal standard within the linear range using the following formula.
standard internal of amount injection standard internal of intensity ion g quantifyin compound the of amount injection compound the of intensity ion g quantifyin compound the of RF =
When using the relative response factor method for sample analysis, analyse a standard solution whose concentration is nearthe centre of the linear range of calibration curve, or between a standard value and the determination limit, before sample analysis, and check if prescribed result can be obtained (for example, determined value is within ± 30% of the actual concentration). If the prescribed result cannot be obtained, it may be because of functional deterioration of the GC/MS, or decomposition of the target compound in the standard solution. Only begin analysis of the actual samples after solving the problem.
When analysing trace chemicals below the nanogram (ng)level, the smaller injection amount is, the smaller the RF value is. That is, the calibration curve becomes flatter. This symptom is especially notable when the polarity of target compound is increased. In this case determine using not the average RF value but RF value of the concentration which is close to the detection level.
D. Standard addition method
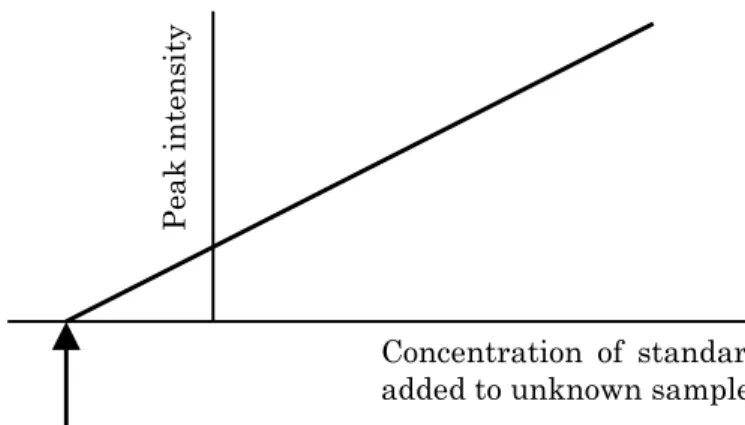
The method of standard additions may be used when components of the sample matrix influence analysis by producing physical or chemical interferences which cause calibration curves to differ from those made using purified water. To use the method of standard addition, first determine the analyte concentration in the samples, then add a small amount of a standard analyte solution of known concentration to the sample, and the analysis is repeated using identical reagents, instrument parameters and procedures. Readings must be corrected for any background signal. The result should be checked by repeating this procedure with at least one other standard addition. By this means, a plot such as Figure III-1-4 may be obtained, from which the in the samples can be determined.
P eak in te n sit y
Concentration of target compound
Concentration of standard added to unknown sample
III.1.4 Procedures for analysis of new compounds
The steps typically required when analysing for the first time compounds whose analytical method is known are as follows.
(1) Collect as mush information as possible from the literature on such things as analytical methods, manuals, physico-chemical characters of the target compounds.
(2) Obtain pure target compounds, internal standards and / or surrogate compounds, and make stock standard solutions of about 1000 mg/L. As mentioned earlier, use as an internal standard a compound whose GC retention time is close to that of the target compound under the anticipated GC conditions, which is stable, and which gives a stable GC peak. Polyaromatic compounds labeled with stable isotopes will be ideal. Also as mentioned earlier, use as a surrogate compound a compound whose physico-chemical character is similar to that of the target compound. Again, target compounds labeled by stable isotopes are ideal. For both internal standards and surrogate compounds, use compounds which are not found in the environment under investigation.
(3) Selection of a GC column. Select a column based on information found in literature analytical methods or manufacturer’s catalogues.
(4) Measurement of mass spectrum of target compounds and internal standards. Measure mass spectrum of target compounds, surrogates, and internal standards. The amount of material to be injected is the amount which will definitely give a good mass spectrum (about several ng). At this stage, it is efficient to increase the GC oven temperature from a low temperature because there is no need to repeat measurement. If it is difficult to tell which peak is the base peak because too much material was injected, decrease the amount of material injected and remeasure.
(5) After confirming, by analysis of the collected mass spectrum or by using the instrument’s library spectra-matching system, that the mass spectra collected are correct or not, decide which ions will be used for determination and confirmation. Also, finalise GC oven programming to ensure the best measurement conditions in the shortest time.
(6) Prepare a series of low concentration standard solutions for making calibration curves, and make calibration curves of target compounds and surrogates, if used. The amount of internal standard to be used will equate with the minimum amount of compound which produces a stable peak area (0.1 - 1 ng is appropriate). Next determine the instrument’s minimum detection limit. This minimum detection limit is the value at which it is possible to measure accurately and precisely the peak area (MS response) of the targets even if the GC/MS system deteriorates. A minimum signal to noise (S/N) ratio of about 10 is required. If the monitor ion is interfered with, or the S/N ratio is bad, change the monitor ion and
remeasure.
(7) Confirm the linear range of the calibration curves from instrumental detection limit to the highest concentration. Determine the volume of a sample and final concentrate for GC/MS analysis which can be analysed in the shortest possible time, while still satisfying the survey’s purpose and required detection limit, and using the least solvent.
(8) Determine the recovery and elution pattern by means of the necessary preliminary analytical experiments, such as column chromatography. The concentrations of target compounds used in such preliminary experiments will be that quantity which can be determined accurately and precisely.
(9) Conduct recovery tests, passing spiked reagent water through the full analytical process using identical reagents, instrument parameters and procedures. Conduct at least four recovery tests, as well as a blank. The amount of compounds spiked is generally several times the detection limit.
(10) Evaluate the results of overall recovery tests. Calculate the average recovery and the relative standard deviation (RSD). For water samples, it is acceptable if the recovery is more than 80 % and the RSD is less than 20 - 30 %.
(11) Conduct recovery tests using typical actual samples. The concentrations of spiked analytes should be the same as that found in the real samples (if known to contain target compounds), otherwise the concentration should be several times the detection limit. Blank samples are real samples without addition of compound.
(12) Confirm that the monitor ions are not subject to interference by matrix constituents, and that the recovery of the target analytes when spiked into the sample matrix is almost the same as the results of recovery tests using reagent water.
III.2 Practical analytical methods
This chapter summarises some practical methods for the analysis of chemicals in the environment using GC/MS.
III.2.1 Simultaneous analytical method for toxic chemicals in water and sediment
using GC/MS
III.2.1.1 Target compounds
Hexachlorbenzene (HCB), dieldrin, p,p'-DDT and its metabolized products (p,p’-DDD, p,p’-DDE), chlordanes (trans-chlordane, cis-chlordane, trans-nonachlor, cis-nonachlor), HCHs (α-HCH, β-HCH), terphenyls (o-terphenyl, m-terphenyl, p- terphenyl), BHT, benzo(a)pyrene, tributylphosphate
III.2.1.2 Summary of analytical methods
Water samples : add surrogates, extract with hexane, dehydrate, and concentrate. Finally, determine analyte concentrations by GC/MS-SIM.
Sediment samples : add surrogates. Perform acetonitrile-hexane partition by first extracting with acetonitrile, then adding water to the acetonitrile layer, and finally extracting with hexane. Dehydrate, concentrate, and partition by silica gel column chromatography. Finally determine analyte concentrations by GC/MS-SIM.
III.2.1.3 Detection limit
For the purposes of most environmental surveys and most chemicals, the minimum detection limits using these analytical methods will be approximately 0.01 ng/mL for environmental waters, and 1 ng/g (dry weight basis) for sediments.
• For aqueous samples, conduct addition and recovery tests seven times, by adding target compounds into blank samples (samples of the same / similar matrix which don’t contain the target compounds) at concentrations 3 to 5 times the lower end (minimum value) of linear portion of the calibration curve, and then calculate detection limit from the following equation.
DL=t
n-1x S
where tn-1 is the value of student t-test (99% confidence level, or 3.143 when measurements are undertaken 7 times), and S is the standard deviation of the results of the 7 measurements • For sediment samples, calculate the minimum detection limit in the same manner as for
aqueous samples (above) , by adding target compounds into blank samples (samples of the same / similar matrix which don’t contain the target compounds) so as to give final concentrations in the range 2 - 5 ng/g (dry weight basis).
• When the minimum detection limit is higher than the value required by the environmental survey’s purpose, two strategies may be followed which may achieve the desired detection limit : increase the instrument’s (GC/MS) capacity, or increase the size (volume or mass) of the sample extracted. This latter step increases the concentration of target analyte in the solution injected into the GC/MS.
III.2.1.4 Reagents and apparatus A. Reagents
• Organic solvents : pesticide analysis grade
• Target compounds : commercial standard reagents
• Surrogates (HCB-13C6, p-terphenyl-d4, benzo(a)pyrene-d12) : commercial standard reagents • Internal standards: commercial standard reagents, such as naphthalene-d8, fluoranthene-d10,
perylene-d12
• Anhydrous sodium sulfate : pesticide analysis grade or reagent special grade, heated at 700 °C for 8 hours then cooled slowly in a desiccator
• Sodium chloride : pesticide analysis grade or reagent special grade, heated at 700 °C for 8 hours then cooled slowly in a desiccator
• Purified water : wash twice with dichloromethane, and finally with hexane
• Purified 5% sodium chloride solution : wash twice with dichloromethane, and finally with hexane
• 5% hydrated silica gel : activate “Wako gel C-200,” or equivalent, at 130 °C overnight, then cool slowly in a desiccator. Place 100 g of the silica gel into a Erlenmeyer flask fitted with a glass stopper, add 5 mL of purified water, putting the stopper in, and leave for 4 -5 hours. Shake occasionally until evenly mixed.
acetone and then benzene again. Filter through glass fibre filter, and wash with a small amount of acetone. Air dry, then dry in an oven at 130 °C, and then grind to a powder in a mixing bowl. Dry again in the oven at 130 °C, then finally store in a desiccator.
• Reduction copper : reduction copper for analysis of organic elements (60 - 80 mesh). Store under nitrogen gas, and wash with the solvent being used in the experiment immediately before use.
B. Apparatus
• Silica gel columns for water samples : use a glass column (length, 30 cm; internal diameter, 1 cm) packed with 1 g of 5% hydrated silica gel. Use hexane to add the silica gel as slurry. Lay 2 cm of anhydrate sodium sulfate onto the top of the silica gel.
• Silica gel columns for sediment samples : use a glass column (length, 30 cm; internal diameter, 1 cm) packed with 5 g of 5% hydrated silica gel. Use hexane to add the silica gel as slurry. Lay 2 cm of anhydrate sodium sulfate onto the top of the silica gel.
• Activated charcoal column : use a glass column (length, 30 cm; internal diameter, 1 cm) packed with 10 g of anhydrous sodium sulfate which contains 2.5 % activated charcoal. Use hexane containing 30 % acetone to load the packing material into the column. Lay 2 cm of anhydrous sodium sulfate onto the top of the packing material.
• Kuderna-Danish (KD) sample concentration apparatus • Separating funnel
• Ultrasonic irradiation instrument (ultrasonic bath is also OK)
• Centrifuge : use a capable of spinning a 100 mL centrifuge tube at 3,000 rpm
• Gas chromatograph / mass spectrometer (GC/MS) : magnetic field type or quadrupole type with data analysis apparatus, and which have prementioned function.
III.2.1.5 Experimental
A. Sample Preparation (note 1) a) Water samples
Add 50 g of sodium chloride and the prescribed amount of surrogate (note 2) to 1 L of water sample and mix well. Add 50 mL of hexane and shake for 10 minutes. Separate the hexane layer. Repeat this extraction twice, combine the hexane layers, dehydrate with anhydrous sodium sulfate, filter, then concentrate (reduce) the hexane solution to 5 mL using the KD concentrator. Add the internal standard, then concentrate further to 1 mL by evaporating the solution under a stream of nitrogen. Finally, introduce the concentrated extract into the GC/MS for analysis (note 3).
b) Sediment samples
Put 50 g of wet mud into a 100 mL centrifuge tube, add the prescribed amount of surrogate and mix well. Add 50 mL of acetonitrile and shake for 10 minutes. Conduct an ultrasonic extraction of the mixture by placing the sample in the ultrasonic bath for 10 minutes. Centrifuge the sample at 3000 rpm for 10 minutes, and collect the supernatant liquid. Repeat this extraction procedure three times. Combine the acetonitrile extracts. Place the extracts in a 200 mL separating funnel. Saturate the extracts with hexane by slowly dripping hexane into the mixture. Then add a further 10 mL of hexane and shake for 5 minutes. Collect the acetonitrile layer. Add 20 mL of an aqueous solution of acetonitrile (5 % water, 95% acetonitrile) to the hexane layer. Shake. Separate the acetonitrile layer.
Combine the two acetonitrile extracts, and add this mixture to 500 mL of 5 % sodium chloride solution in a 1 L separating funnel. Add 50 mL of hexane and shake for 5 minutes. Collect the hexane layer. Keep the aqueous phase. Wash the hexane layer with 20 mL of 5 % sodium chloride solution. Collect the hexane layer. Combine the aqueous phase with the aqueous phase collected in the previous step. Extract the combined aqueous phases with another 50 mL of hexane. Collect the hexane layer. Wash this hexane layer with 5 % sodium chloride solution, then combine with the hexane layer collected in the previous step. Dehydrate this hexane solution with anhydrous sodium sulfate, then concentrate (reduce) the hexane solution to 5 mL using the KD concentrator. Add the internal standard, then concentrate further to 1 mL by evaporating the solution under a stream of nitrogen. Finally, introduce the concentrated extract into the GC/MS for analysis.
B. Sample Clean-up (note 4) a) Water samples (note 3)
Load the concentrated solution obtained after KD concentration in part III.2.1.5 A (a) onto a silica gel column. Elute the column with 20 mL of hexane. Collect the first 20 mL of hexane solution eluting from the column. This first fraction contains all the target compounds mentioned earlier except tributyl phosphate, β-HCH, dieldrin. Elute the column with a solution of hexane : acetone (90 : 10). Collect the next 20 mL of solvent eluting from the column. This second fraction contains tributyl phosphate, β-HCH, dieldrin. Concentrate each fraction up to about 5 mL using a KD concentrator. Add the internal standard, then concentrate further to 1 mL by evaporating the solution under a stream of nitrogen. Finally, introduce the concentrated extract into the GC/MS for analysis (note 5).
b) Sediment samples
Load the concentrated solution obtained after KD concentration in part III.2.1.5 A (b) (note 6) on to a silica gel column. Elute the column with 20 mL of hexane. Collect the first 20 mL of hexane solution eluting from the column (first fraction). Elute the column with 50 mL of hexane : acetone (99 :1) (second fraction). Elute the column with 40 mL of hexane : acetone (90 :10) (third fraction). Concentrate the three fractions using a KD concentrator to a final volume of 1 mL. Load the concentrated third fraction onto an activated charcoal column, and elute with 20 mL of hexane : acetone (70 : 30). Concentrate the eluted solution with a KD concentrator up to a final volume of about 1 mL. Add internal standard to the three fractions, then concentrate further to exactly 1 mL by evaporating the solution under a stream of nitrogen. Finally, introduce the concentrated extract into the GC/MS for analysis (note 5).
C. Preparation of blank samples
Add surrogate into purified water (the same amount as added to samples (25 mL for sediment analysis)) and then treat the blank sample in the same manner as real samples.
D. Preparation of standard solutions
Prepare standard solutions for a calibration curve by mixing target compounds, surrogates, and internal standards in hexane. Surrogates and internal standards should be added in the same amount as that added to samples. Target compounds should be added in amounts that, when the standard solution is injected into the GC/MS will produce an MS response near the high end of the linear region of the calibration curve. (if necessary anticipate this concentration based on instrumental detection limit). Prepare at least five concentrations.
E. Analysis
a) Analytical condition of GC/MS (1) GC
• column : fused silica capillary column (30 m x 0.25 mm i.d., 0.25µm) • liquid phase : methyl silicone or 5% phenylmethyl silicone
• column temperature : 50 °C ( 1 min) - 6 °C/min - 100 °C - 15 °C/min - 280 °C • injection temperature : 230 °C
• injection method : splitless method (1 min for purge-off time), 1µL injection • carrier gas : He, average linear velocity : 40 cm/sec
• inlet temperature : 280 °C (2) MS
• ionisation method : EI • ionisation current : 300 µA • ionisation voltage : 70 eV • ion source temperature : 220 °C • detection mode : SIM
(3) Monitor ions (( ) is m/z of confirmatory ion) • Target compounds
HCB : 284 (286), dieldrin : 263 (277), p,p’-DDE : 246 (318), p,p’-DDD : 165 (235), p,p’-DDT : 165 (235), trans-chlordane : 373 (375), cis-chlordane : 373 (375), trans-nonachlor : 407 (409), cis-nonachlor : 407 (409), α-HCH : 181 (219), β-HCH : 181 (219), o-terphenyl : 230, m-terphenyl : 230, p-terphenyl : 230, BHT : 205, benzo(a)pyrene : 252, tributylphosphate : 99 (151, 211)
• Surrogate compounds
HCB-13C6 : 290 (292), p-terphenyl-d14 : 244, benzo(a)pyrene-d12 : 264 • Internal standard compounds
naphthalene-d8 : 136, fluoranthene-d10 : 212, perylene-d12 : 264
F. Calibration curves
Make calibration curves for HCB, terphenyls and benzo(a)pyrene by the internal standard method using their stable isotope labelled compounds (HCB-13C6, p-terpneyl-d14, and benzo(a)pyrene-d12). For other compounds, make calibration curves by the internal standard method using internal standards (naphthalene-d8, fluoranthene-d10, perylene-d12) whose retention times are close to the retention times of target compounds.
G. Determination
Determine by the isotope dilution method when adding HCB-13C6, p-terphenyl-d4, and benzo(a)pyrene-d12 into samples. For other compounds, determine by the internal standard method.
(1) Cover and protect from light during analysis because benzo(a)pyrene is easily degraded by light. In general, protect all standard solutions etc. from light.
(2) Add surrogates to the samples in amounts similar to the anticipated amounts of target compounds in the samples.
(3) Conduct silica gel clean-up before adding internal standards if samples contain compounds that interfere with GC/MS analysis.
(4) Determine the elution pattern and recovery rate of each of the compounds during column chromatography before actual analysis, and change conditions if there are any problems. (5) May analyse combined fractions if there is no interference with GC/MS analysis. In this
case, after collecting all fractions, concentrate, then add internal standards for GC/MS analysis.
(6) When the extracts before clean-up have large amount of precipitate, conduct sample clean-up using silica gel column for water analysis as a preliminary clean-up method.
(7) Elemental sulfur interferes with GC/MS analysis, conduct a reduction copper treatment. (8) Reduction copper treatment : Add 2 g of reduction copper into the eluate, shake vigorously
to mix, then collect the eluate.
III.2.2 Analytical method for volatile compounds in ambient air using canisters
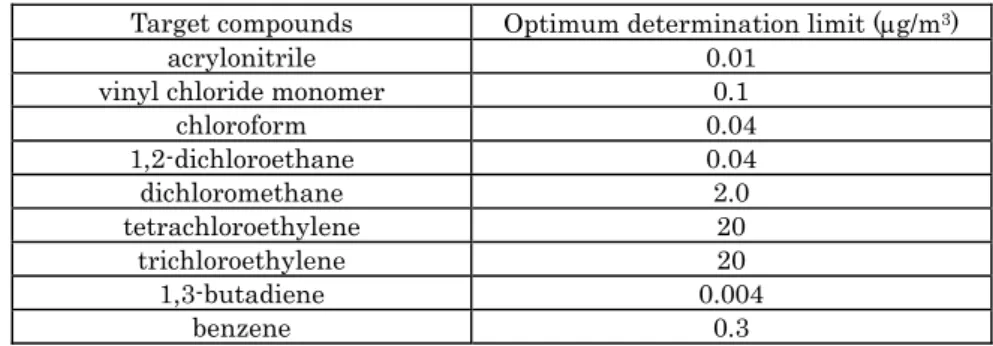
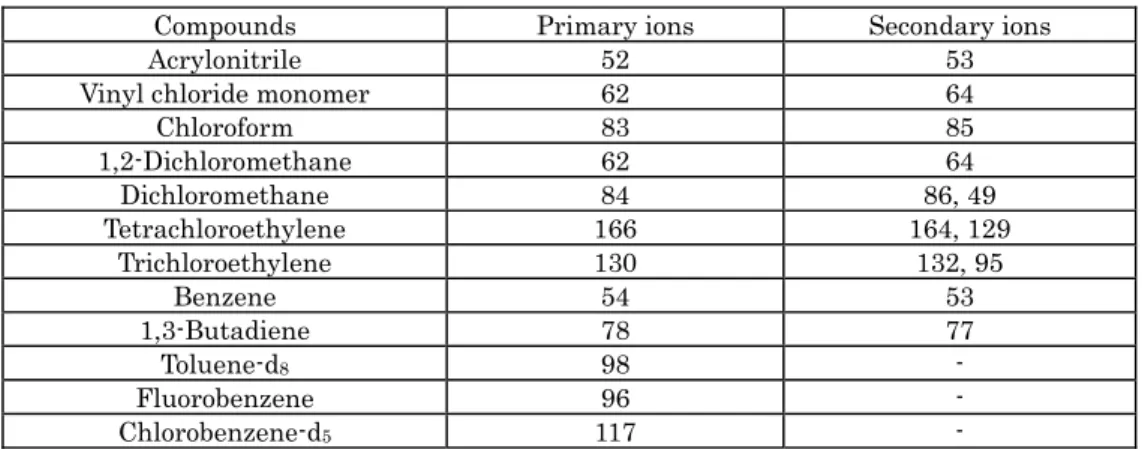
III.2.2.1 Target compoundsAcrylonitrile, vinyl chloride monomer, chloroform, 1,2-dichloroethane, dichloromethane, tetrachloroethylene, trichloroethylene, benzene, 1,3-butadiene
III.2.2.2 Outline of analytical methods
Collect the air samples under conditions of constant flow using sampling containers made of stainless steel. Analyse a specified fraction of the sample by capillary GC/MS.
III.2.2.3 Detection limit and determination limit
The optimum (target) determination limits of the above mentioned target compounds are shown in Table III-2-1. Follow all analytical procedures from sample concentration to GC/MS measurement using a sample container which is filled with a humidified mixture of standard gas. This mixture should have a concentration close to the estimated minimum determination limit obtained at the time of making calibration curve. Calculate the concentration of the humidified