Modelling the Effect of the Allocation of Social Worker Duties on Delayed
Discharges using System Dynamics in the UK
S.Sardiwal
London South Bank University 103 Borough Road, SE1 0AA
0207 815 8229 [email protected] Abstract
Social Services is the body responsible for the provision of post hospital care in the UK. Delayed discharges have become a common problem within hospital, predominately within elderly care. This is where patients become ‘blocked’ unnecessarily along the patient pathway. Historically allocation system policies were needed acting as coping mechanisms when there was a lack of social workers to carry out patient assessments and set up services. These allocation policies helped to reduce delayed discharging of elderly patients when resources were scarce.
This paper examines the formal priority and informal proportional staff allocation system used by Social Services managers to allocate patient assessments and set up of post hospital services to social workers. The priority system involves social workers prioritising one duty over another and is an alternative to the standard policy of allocating social worker duties proportionally among patients waiting for social workers along the patient process. System dynamics is used to test the effect of these allocation systems on delayed discharges for patients and the effect of an alternative integrated information system policy.
Priority policies are routinely used by Social Services. However research has shown that they are very disruptive to work schedules, as social workers change priorities to cope with a situation of diminishing capacity. Proportional policies are a less disruptive way of coping with situations of low capacity.
Introduction
The National Health Service (NHS) is the public funded healthcare system in the UK and Social Services is the organisation responsible for providing post hospital care, such as district nursing to the elderly. By looking at the wider context of the UK health and social care system it is apparent that there are numerous pressures on organisations to perform and deliver services. They are working towards numerous national government targets, meeting customer demand under great scrutiny from various stakeholders including the public. There is an overwhelming financial burden of providing health services to an aging population (Williams, 2005).
Beresford (2010) argued that the UK government were using a neo-liberalisation trick. The government had financed expensive private finance initiatives (PFIs), consequently making the private sector increasingly dominant over the public sector. As a result the government would reshape social services in line with private sector managerialism, with a market making focus. A trick was in place as social services sought informal help from the government, whilst the government were subsidising the private sector. As a result cut backs were in place on social services, and different services had to be closed due to the lack of funding.
Gibbs (2010) described the state of social services in the UK as ‘not thriving as a profession’. A number of reasons were stated including due to the training of social workers not being consistent, a poor public image and inadequate tools being in place, such as the supervision of social workers carried out by managers. In addition the issue of high workloads of social workers was seen as a cause of social services not thriving, where there was an emphasis on driving timescales rather than quality. Although social workers like other professionals in the health and social care system are under pressure not just to deliver services on time but to provide high quality services that meet public expectations. This is challenging to achieve in a health and social care environment exposed to increasingly limited resources.
Ideally sufficient capacity should be present in the health and social care system but the reality is often different. Organisations are faced with very little or no available spare capacity. In some areas resources are depleting such as with cut backs in budgets impacting service levels, where the necessary levels of public funding are unavailable. This has been seen with the closure of NHS wards up and down the UK despite public protests. Given these limited resources there is a need for the NHS and Social Services to be increasingly productive and efficient (Webber-Maybank, 2009).
Demand for services has increased as the population has grown due to people living longer. More patients need social services assessments so that services can be determined and then set in place before the patient leaves hospital. The effect of this is that a cinderalla service is in place across some areas of the NHS trusts and social services (Society Guardian, 2009). Services become fragmented as there is not enough attention being given to address service shortages.
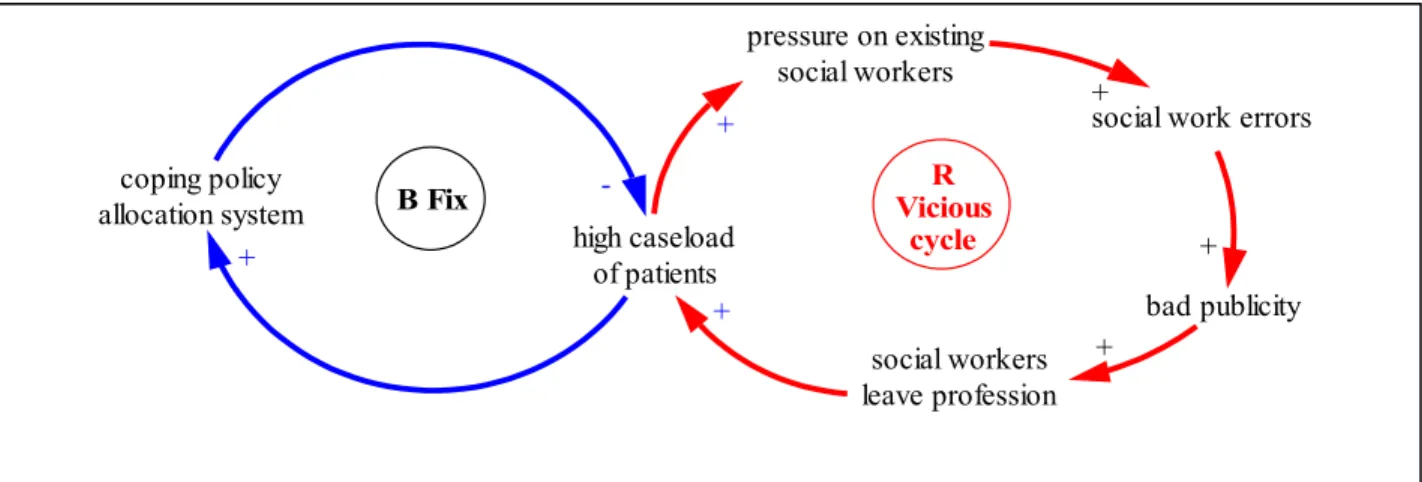
Given the nature of health and social care additional workloads are now seen as part of NHS nurses’ and social workers’ jobs. In the light of intense public and media publicity social services have been shown to fail in a number of high profile child protection cases such as in the baby P case and Victoria Climbie, where the necessary care orders were not put in place. This encourages social workers to leave their jobs creating further pressure on existing social workers.
As a result the remaining social workers increase the number of errors they make as they are under increased pressure, which creates increased bad publicity. For example this was highlighted in a UK BBC panorama programme, which highlighted that within children social services social workers had heavy caseloads of up to twenty cases to manage. As a result this increased the number of errors and failures being made as it became impossible to dedicate the necessary time to each case. As seen, Surrey Council social workers were threatening strike action (Panorama, 2009).
A vicious cycle is present as shown in figure 1. A reinforcing loop (R) is present where pressure on existing social workers creates social work errors, which causes more of the same action resulting in growth. A coping policy such as changing the allocation of social worker duties could be a possible way of dealing with the undesirable feedback loop. This coping policy introduces a balancing loop (B) that becomes dominant and sets to restore the system by reducing the high growth of caseloads of patients.
bad publicity social workers leave profession + pressure on existing social workers
social work errors + + R Vicious cycle coping policy allocation system high caseload of patients -+ B Fix + +
Figure 1: Vicious cycle and counter measure to help control a high caseload of patients
Hospital social workers dealing with elderly care carry out two main duties. Firstly social workers carry out an assessment of the patients needs referred to as a section 2 notification, followed by the setting up of post hospital services referred to as a section 5 notification. The way in which social workers allocate between these two main tasks is extremely important affecting the throughput of patients through the health and social care system. If the allocation of tasks is not efficient patients could experience delayed discharges1 at various points through the system for no apparent reason.
This results in numerous resources being wasted with a detrimental effect of patients experiencing delayed discharge.
Previous Work on Allocation Policies
Previous work on modelling the allocation of management policies carried out by Wolstenholme (1982) has focused on the policies adopted by colliery management in addressing the management of manpower. For example by controlling the allocation of men and the number of machines allocated during times of a lack of available men capacity. It was highlighted that it was important to use allocation policies as long as possible to enforce managerial control for a fixed period to avoid the disruption caused by changing the allocation policies. The models produced importantly incorporated ways to include spare capacity for any further events or shocks.
However it is not always easily possible to create spare capacity in some systems such as with the social care system, hence the need for some effective allocation system policies during times of limited capacity. The isomorphic nature of allocation policies was addressed in the control of resources in a coal transportation system highlighting the applicability and importance of such allocation policies in coping with situations of limited capacity (Wolstenholme, 1990).
Wolstenholme et al (2005) highlighted that in reality there are often inconsistencies and mismatches between actual processes and policies used by health and social care organisations and management, and the system dynamics models as numerous informal coping policies are adopted by organisations. Coping policies are used importantly to minimise the extent that capacities are exceeded. However when these coping policies are excessive these policies can have detrimental
1 Delayed discharges are often referred to as ‘blocked beds’ as patients are kept in their beds unnecessarily along the
effects to the patients, which are the negative unintended consequences taking effect. For example some patients may be readmitted into hospital due to the coping policy of moving patients into other post hospital service provision when they are waiting for another type of service provision. Southwark Social Services Allocation Policies
The proportional allocation system was the standard policy put in place by Southwark Social Services management. This involves allocating duties to social workers based on the proportion of patients waiting for section 2s and 5s. This was the specific action put in place by the organisation to deal with delayed discharges that were caused by patients either waiting for social services assessments or set up of services.
A larger project was conducted investigating the effect of integrated information systems on delayed discharging (Sardiwal, 2009b). This research on allocation polices emerged from this project. The qualitative data collected from interviews with health and social care managers and social workers revealed the informal coping policy that was used by social workers when dealing with backlogs of patients waiting for assessments and the setting up of services. The priority allocation system was the main coping mechanism in place for dealing with increased social workers’ workload avoiding further bottlenecks in the patient process and ensuring a more seamless service. This is illustrated below highlighted by the Acting Ward Manager comments. From the research participant A9 the Acting Ward Manager when asked ‘What factors need to be considered when there is increased staff workload?’ the response was ‘People need to understand that we have busy periods, and that we cannot just throw more staff on it, we need to prioritize’.
This was supported by the response to the following question. When asked ‘How would you resolve increased workload on nurses in meeting targets of prompt discharge?’. The Acting Ward Manager replied ‘We have a traffic light system, green, amber and red to illustrate how many beds we have in the wards. We have no beds and this illustrates that we have a high workload. Doctors
will then look at who can be discharged at an earlier date’. Following the doctors’ advice on
which patients to discharge, nurses will contact social services to set up services for the relevant patients concerned. This fits in with health and social care literature, where often priority systems are focused around patient need to achieve greater efficiency (Hirsch et al, 2004).
Aim and importance of the research
The aim of this paper is to investigate the effect of these two social services allocation systems, a ‘priority’ and a ‘proportional’ system on delayed discharging of patients. This paper serves as a technical paper for documenting the modelling of the allocation process that reflects the formal and informal coping processes used in practice by hospital social workers. This is important, as often there is a gap in the literature of technical papers being published by system dynamists, as the details of how models have been built are often omitted where previous research tends to focus on the description of the models.
Additionally within the published system dynamics literature less attention has been given to modelling the routine issues embedded within social care, such as looking at the social services allocation systems in place for section 2s and 5s. The allocation systems provide high leverage points for change affecting the flow of patients, in which there has been a tendency for the literature to focus on the stocks, such as examining bed capacity.
This research is very important given the recent financial crisis taking place in the UK and globally. The UK government have used tax payers’ money to bail out the banks, which has had a knock on effect for the NHS and Social Services where there are continued funding cuts. The recession has effected the populations’ well being and this has generated the unintended consequence of more people being ill and demanding NHS and Social Services. The NHS is under pressure to look at ways of being more productive without increasing expenditure on services. For example by looking at the processes in place, such as how patients are allocated to see if they can be made more effective. Changing the allocation system for section 2s and 5s could have an impact on the discharge procedures, which impacts patient flows and bed capacities.
Methodology
The system dynamics methodology has been used to explore the two allocation systems, the priority system and the proportional system. In addition from the Soft Systems Methodology (Checkland, 2000) the approach of using a rich picture was used to help understand the qualitative data collected from primary interviews better and conceptualise the problem situation.
The priority system prioritises the task of setting up services when social workers have received section 5s notifying them that the patient is ready to leave hospital over the task of social workers carrying out section 2 referrals. Section 2 referrals have been received by social workers from the NHS when patients need social services’ assessments to determine their post hospital care they may need.
The nature of the problem of delayed discharging of patients has dictated the use of system dynamics, where there are problematic areas around group processes, mental models and system complexity. A web of complexity exists around service capacity, demand and service provision that is often difficult to understand. Different feedbacks within the health and social care system compound resulting in a worse before better trade-off taking place. System perspectives can be compared to being like an iceberg. People tend to only see the iceberg sitting on top of the water, the events (see figure 2). They fail to see the underlying structure and patterns of behaviour that exist under the surface (Lane, 2009).
System dynamics has helped in addressing the unintended consequences of our decision-making, helping the decision maker to make more robust policies. This was seen when system dynamics was used by the NHS and the Local Government Association to test the complexities involved in the reimbursement policy, which was introduced to fine social services over delayed discharging of patients (The NHS Confederation, 2005). The government were able to see from the system dynamics model that an increase in hospital capacity during times of high demand in the acute sector, would result in an increased number of people in hospital as empty hospital capacity would be filled. This would result in the unintended consequence of increasing hospital delays. The effect of the system dynamics model on the government was to delay the implementation of the reimbursement policy and to increase funding to social services to increase care capacity before the fining policy was introduced.
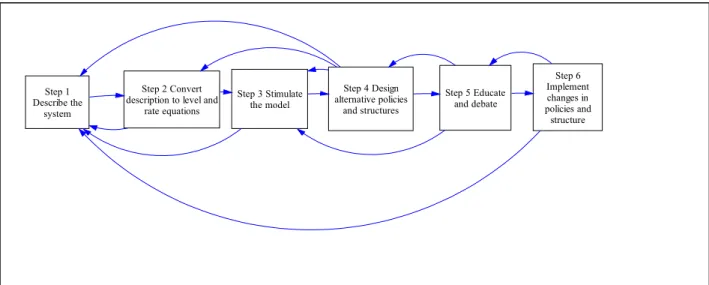
The modelling process in system dynamics involves six key steps as outlined in figure 3. The system dynamics process starts with an undesirable event and through a series of processes possible policies are devised to improve the problem situation (System Dynamics Society, 2009). Essentially there are numerous feedback processes between the stages. For example key to the success of this is understanding how the structure of the system drives behaviour in order to identify which control mechanisms could be put in place. Additionally the behaviour of the model helps to inform the structure.
Step 1 Describe the
system
Step 2 Convert description to level and
rate equations Step 3 Stimulate the model Step 4 Design alternative policies and structures Step 5 Educate and debate Step 6 Implement changes in policies and structure
Figure 3: System dynamics steps from problem symptoms to improvement, System Dynamics Society (2009)
The modelling work
A case study was carried out of St Thomas and Kings College NHS Trusts’ elderly care wards and Southwark Social Services (Sardiwal, 2009a). The focus of this study was to investigate the problem situation of delayed discharges, which historically in 2003 was becoming a serious problem for the patients, the NHS and Social Services. There was a huge waste of financial resources keeping patients in hospital and patients’ conditions were likely to deteriorate as they were exposed to other illnesses in hospital. The main contributory factors of delayed discharge were due to the lack of social workers being able to carry out patient assessments and the availability of post hospital provision.
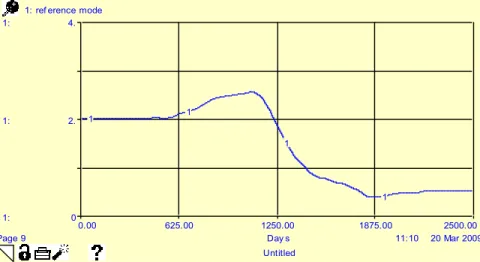
The reference mode data for hospital delayed discharges from Kings and Guys and St Thomas NHS hospital trusts is from the period of 2001/2 to 2007/8. It illustrates a stable period of delayed discharges between 2001 to 2002, then steady growth 2002-2003 peaking in 2003. This is followed by a steady decline in delayed discharges reaching minimal numbers of delayed discharges in 2008 as shown in figure 4. Actual delayed discharge figures are provided in figure 5.
11:10 20 Mar 2009 Untitled Page 9 0.00 625.00 1250.00 1875.00 2500.00 Day s 1: 1: 1: 0 2. 4. 1: ref erence mode
1 1
1
1
Figure 4: A graph illustrating the reference mode behaviour of delayed discharges of elderly people from 2001 to 2008
Year Delayed discharge of older people over 65 at Kings and Guys and St Thomas for Southwark’s patients
(average number delayed per day rounded to 2 decimal places)
2003/4 2.56
2004/05 0.87
2005/06 0.37
2006/07 0.49
2007/08 0.51
Figure 5: Harris (2008), Delayed discharge numbers of older people over 65 per month from 2003-2008
The UK government’s policy has been to focus on the integration between health and social care, where integrated information systems are central to achieving joined up services. However there have been a number of information system projects which have failed in this area. For example this was seen with the London Ambulance Services’ computer aided dispatch system resulting in numerous ambulances being deployed late (Collins et al, 2005). Little is known about the potential affects that integrated information systems could have on the historic problem of delayed discharges. A study was carried out investigating the effect of integrated health and social care information systems on reducing delayed discharges of elderly patients.
The study involved carrying out 21 initial interviews with a number of stakeholders such as Elderly Care Matrons and Social Services managers, to collect the necessary qualitative data to
inform the model building process. Through the primary research with the NHS and Southwark social services the need to examine the management of social worker workloads emerged as an important factor to examine in investigating delayed discharges, which this paper addresses.
Substantial quantitative data was collected from a range of sources. This included collecting from Southwark Social Services referral rates of patients, delayed discharge numbers and from the NHS information department admissions rates of patients to the elderly care ward. Follow up interviews with stakeholders involved in the initial interviews were conducted to evaluate the simulation model.
The steps described in the system dynamics methodology are covered below. Step 1: Describe the system
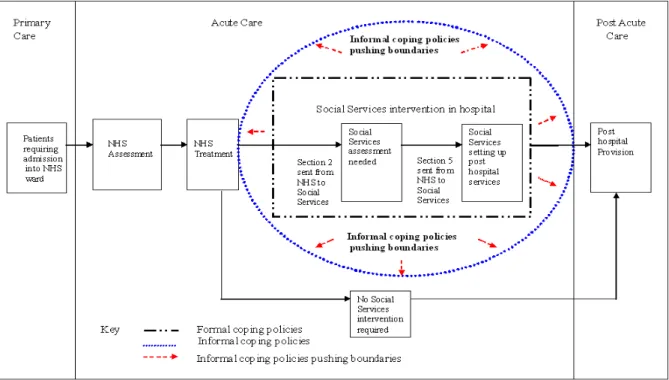
The patient process can be seen in figure 6 below, where elderly patients move from primary care, to acute care followed by post acute care. Social Services hospital intervention happens in the acute sector, where social services carry out patient assessments once they have received a section 2 referral from the NHS. Social services set up post hospital services when they are notified through a section 5 that the patient is ready to be discharged by the NHS.
Figure 6: Elderly Care patient process from primary care to post acute care
Formal organisational policies are in place, such as those concerning the allocation of social worker duties. However informal coping policies are often used in practice by social workers extending the social services organisational boundary, resulting in numerous unintended benefits from occurring. For example as well as social services using the priority system for the allocation of social worker duties to reduce delayed discharges an additional benefit is that social services communicates more with the NHS. More post hospital services are set up increasing the discharge rates of elderly people from the wards, reducing the backlogs of patients waiting for section 5s.
Step 2: Convert system description to level and rate equations
This step has involved structuring information from the rich picture which summarised interview data using annotated system dynamics diagrams.
A reinforcing loop is self reinforcing and promotes more of the same action, where as a balancing loop is self-correcting, controlling, where the loop counteracts change. The major balancing loops are outlined in figure 7. There are predominately balancing loops in the model.
The main reinforcing loops are when there are more patients that have finished section 2s and 5s, which creates increased spare notifications, capacity for social workers to forfill section 2 and 5 requirements. This is the ‘one in one out’ principle. The main balancing loop is B12, which is a loop controlling those patients ‘in assessment’ to ‘total notifications’ for section 2s. The same principle is applied with loop B15 to section 5s.
Figure 7: Annotated Stock And Flow Diagram Illustrating The Balancing Loops Present
Social Worker Sector
A number of balancing loops exist (B19 to B22) where patients are in bed at different stages of the patient process. This has led to an increase in the number of patients in occupied beds and a decrease in the number of free beds available. Any free beds available increases the number of new patients being admitted to the ward which leads to an increase in the number of patients in beds. There are some patients that do not require any section 2s or 5s as they do not require any post hospital social services provision and they bypass social services involvement.
The main internal policy levers that exist to reduce delayed discharging are:
1. Decreasing the number of patients that are referred to social services for a patient assessment
2. Reducing the number of patients that enter the elderly care ward 3. Decreasing social worker time spent on other duties
4. Increasing social worker’s productivity 5. Hiring new social workers
6. Increasing bed capacity
7. Increasing post hospital social services capacity such as in residential and nursing homes and the number of district nurses available
Model Description and Building
The system dynamics model has been made up of nine sectors. A high level model of the sectors has been illustrated (see figure 8). This has reflected the main areas that have made up the health and social care patient process and has demonstrated the linkages between the sectors.
Figure 8: High Level Model Of The Sectors Present In The Health And Social Care System Dynamics Model
The health and social care model was built in a series of steps. The NHS sector was built first and the model was expanded out to consider the interface of the NHS with the social services sector and the bed sector. The links between the variables were based on the stock and flow diagrams seen earlier, information gathered from the interviews and published data on the patient process. Then the post hospital sector was considered followed by the social worker recruitment sector in order to complete
the patient process. The delayed discharge sector was devised to illustrate the total number of delayed discharges occurring along the patient process. This generated the reference mode behaviour for delayed discharges from the system dynamics model. The post hospital sector was considered further by considering capacity changes for district nurses and other post hospital capacities, which were each devised into separate sectors.
Policies were carefully reviewed and incorporated into the model to reflect the events that had taken place in practice by Southwark Social Services, Guys and St Thomas NHS trust and Kings NHS trust. A large amount of time was spent ensuring that the reference mode was accurately reproduced from the system dynamics model.
The main system dynamics model where social service intervention occurs involves the following up of section 2s and 5s being driven by the number of social workers available on duty. This influences the social worker capacity available to carry out patient assessments and set up of services. The social worker capacity affects the total patient duties available from social workers. The allocation systems are then used by social work managers to disseminate the duties available among patients waiting for section 2s and 5s. Two types of allocation systems were built based on the policies that were used in practice by social work managers that emerged through the interviews, as illustrated in figure 9.
Policy 1: The proportional allocation system
Social worker duties are allocated based on the proportion of patients waiting for section 2s and 5s Policy 2: The priority
allocation system Prioritisation of social worker duties to the allocation of section 5s over section 2s
Figure 9: Southwark Social Services policies for the allocation of social worker duties
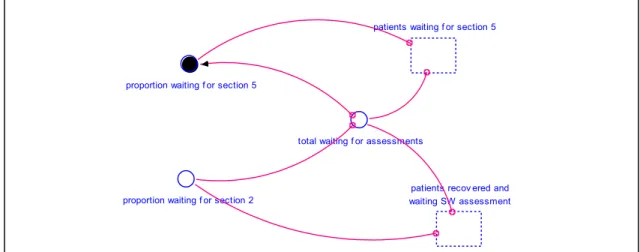
The way in which these two policies were modelled are highlighted below. The Proportional allocation system
The proportion of patients waiting for section 2 is calculated by taking into consideration those waiting for section 2 compared to the total number of patients waiting for assessments. The same principle is applied to section 5’s as shown in figure 10.
proportion waiting f or section 5
proportion waiting f or section 2
total waiting f or assessments
patients waiting f or section 5
patients recov ered and waiting SW assessment
Figure 10: Modelling of the proportion of patients awaiting for section 2s and 5s These proportions of patients waiting for section 2 and 5 are used to influence the actual number of total duties being allocated to patients for section 2 and 5s, as shown in figure 11 at points A and B.
Similarly the same principle applies to the priority allocation system as highlighted below.
The Priority allocation system
At point C the priority allocation system drives the total social services duties being allocated. A switch was incorporated into the simulation model as shown at points D and E to change between the two allocations systems. Having devised an appropriate system structure reflecting the policies in place by Southwark Social services as verified with the organisation these system dynamics models were simulated. Consideration has been given to the situation when the coping allocation system policy is effective during times of capacity shortage as shown in step 3 below.
Key:
Points A, B- Areas where the proportional number of patients waiting for social services drives the total social services duties being allocated
Point C- Area where the priority allocation system takes effect Points D, E- Areas where the allocation system switches are present
Figure 11: A stock and flow diagram illustrating the proportional system effecting patients waiting for section 2s and 5s
14 Point A Point B Point C Point D Point E
Validation
The system dynamics model of the health and social care system has been design orientated. It is essential to ensure that the internal structure is valid, where the right behavior is generated for the right reasons. For such reason it is important to build a wide range of tests into the system dynamics process, to test the robustness of the model and any limitations that exist. The main tests used have been indicated below: Generation of the reference mode behavior within the system dynamics model The reference mode of delayed discharges of patients was generated from a number of different parts of the patient process. Delayed discharge of elderly patients in hospital is caused by a number of factors as shown in figure 12. This gives rise to high levels of system complexity.
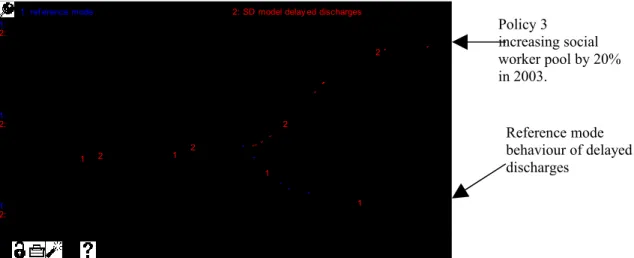
Figure 12: Causes Of Delayed Discharge (DD) Of Elderly People In Hospital Organisational policy in response to this peak of delayed discharges in 2003 was to increase social worker pool by 20% (policy 3) shortly after the high delayed discharge numbers became apparent. The intention was to increase the total number of assessments available for patients by recruiting more social workers, eliminating any backlogs of patients waiting for assessments at different stages of the patient pathway. This policy was shown to reduce the backlog of patients waiting for assessments upstream2. However this policy has translated to a backlog of patients waiting to be
discharged from hospital into the appropriate post hospital capacity downstream. This is due to patients experiencing limited district nursing capacity and other post hospital capacities further along the patient process, such as there being limited residential and nursing homes available. This has caused delayed discharges to increase significantly as shown in figure 13. The delayed discharges of patients reach a maximum level due
2 Downstream refers to along the end stages of the patient process, away from patients being admitted
to the ward and upstream is toward the source of patients being admitted into the ward.
to the lack of available beds to admit patients, stopping any further delayed discharges from occurring. 13:54 19 Mar 2009 Untitled Page 1 0.00 625.00 1250.00 1875.00 2500.00 Day s 1: 1: 1: 2: 2: 2: 0 3.5 7.
1: ref erence mode 2: SD model delay ed discharges
1 1 1 1 2 2 2 2
Figure 13: Model Behavior As A Result Of Increasing Downstream Capacity And Keeping Upstream Capacity The Same
It was necessary to then go back to Southwark Social Services to see what other policies they used to reduce delayed discharges of elderly patients. It was discovered historically to avoid large increases of continued delayed discharge as shown in figure 13 organisational policy 4 was adopted to increase the district nurse capacity (see figure 14). Policy 5 was used to increase other post hospital capacity (policy 3) in 2003 slightly after increasing social worker capacity, leading to the overall policy 6.
Delayed discharge policies Policy 3 To increase social worker pool by 20% Policy 4 To increase district nurse capacity
Policy 5 To increase other post hospital capacity, such as residential, nursing homes
Policy 6 To increase social worker pool by 20%, increasing district nursing and increasing other post hospital capacity
Figure 14: Southwark Social Services Policies Used To Reduce Delayed Discharges In 2003
This investment in increasing capacity upstream as well as downstream ensures that delayed discharge continues to fall. This reinforces the important point that delayed discharges are multifaceted as seen earlier (see figure 12) and occur in a number of different places along the patient process. As patients flow from one point of the system to another, changes in one part of the system will cause effects in other parts of the system.
The reference mode behaviour of delayed discharge is generated in the system dynamics model by increasing both downstream and upstream capacity, with the model output illustrated against the actual reference mode behaviour as shown in figure 15 The introduction of policy 4 gives increased closeness of fit between the
16 Policy 3 increasing social worker pool by 20% in 2003. Reference mode behaviour of delayed discharges
reference data and the computer generated mode, helping to validate the system dynamics model. 11:49 20 Mar 2009 Untitled Page 9 0.00 625.00 1250.00 1875.00 2500.00 Day s 1: 1: 1: 2: 2: 2: 0 2 4
1: SD model delay ed discharges 2: ref erence mode
1 1 1 1 2 2 2 2
Figure 15: Reference Mode Behaviour Against The Output Of The System Dynamics Model
Unit Consistency and Sensitivity Analysis
Unit consistency was applied to the model. Some examples of sensitivity analysis can be seen below together with the hypothesis that has been tested.
Hypothesis 1: As the actual number of patients requiring assessments increase from 38 to 41%, the actual number of delayed discharges for section 5 and 2 increase
Hypothesis 1 has shown to be correct and actual delayed discharges increase as a result of increasing the number of patients requiring assessment (see figure 16).
17 41% of patients (run 1) 38% of patients (run 2) system dynamics model delayed discharges (Run 1) Reference Mode (Run 2)
Figure 16: The effect of increasing the actual number of patients needing social worker assessment on delayed discharge
Hypothesis 2: Increasing social worker productivity from 1 to 2 assessments would reduced delayed discharges significantly
Hypothesis 2 was correct the system dynamics model proved to be highly sensitive to changes in social worker productivity reducing delayed discharges (see figure 17).
Figure 17: The effect of increase social worker productivity on delayed discharges
Extreme Condition Testing
Hypothesis 3: Increasing the percentage of time social workers spent on other duties from 44% to 70% will significantly increase the number of delayed discharges.
Figure 18: The effect of changing the percentage of social worker time spent on other duties on delayed discharging
18 1 social worker assessment per day (run 1) 2 social worker assessment per day (run 2) 44% percentage time social workers spent on other duties (run 1)
70% percentage time spent on other duties (run 2)
This hypothesis has proved to be correct as patients arriving are not able to enter the ward due to there not being any free beds available (see figure 18).
Validation with Southwark Council
Validation has taken place with the users of the health and social care model. One of the key aspects of validation is the need to build validity in the model by communicating with the user of the model, with Southwark social services and Guys and St Thomas NHS Trust. This was carried out in the following ways. Individual meetings were carried out with the Elderly Care Matron to discuss and validate the structure and behaviour of the model as the simulation model was being built.
A presentation in May 2009 was conducted to the Elderly Care department at St Thomas hospital on the findings of the project. Reporting on the research conducted fed into the departments own NHS Governance Framework. A demonstration was given of the simulation model, whereby attendees felt that both the structure and behaviour of the model was representative of the real system. It was mentioned that it was felt that the correct policies of delayed discharge had been represented in the model.
Step 3: Simulating the model during times of capacity shortage
The simulation model highlighted that social worker allocation systems had a significant effect in changing delayed discharge numbers, as shown in figure 11 when patient backlogs waiting for section 2s and 5s were small. Usage of policy 2 with the priority system (the coping policy) has shown to have greater impact on reducing delayed discharges compared to policy 1 (the non-coping policy), where better patients flow is present. The priority system provides benefits among one group of patients waiting for post hospital services, whilst the proportional system provides benefits to all patients waiting for social services intervention in elderly care. Historically the coping policy was not used all the time by Southwark Social Services due to its unintended consequences.
Ineffective priority allocation system
With the priority coping allocation system used increasing the number of new patients entering the ward from 8 to 12 results in increased numbers of delayed discharges (see figure 19). With no spare capacity available the priority allocation system becomes ineffective, as patients become delayed against limited capacities. The backlog of patients waiting for social services intervention and post hospital exceeds available capacity.
19:31 28 Jun 2009 Ref erence Mode behav iour of delay ed discharges of Southwark elderly patients f rom 2001 to 2008 Page 1 0.00 625.00 1250.00 1875.00 2500.00 Day s 1: 1: 1: 2: 2: 2: 0 8 15
1: ref erence mode 2: SD model delay ed discharges
1 1
1
1 2
2 2 2
Figure 19: Simulation model outputs for the two allocation policies
When capacity levels for social workers, district nursing and post hospital capacity were increased in 2003 by Southwark Social Services delayed discharged started to decrease. With a large backlog the priority system is shown to have limited effect, although delayed discharges slightly decrease as shown in figure 20. Any capacity increases are filled by incoming patients.
18:42 28 Jun 2009 Ref erence Mode behav iour of delay ed discharges of Southwark elderly patients … Page 1 0.00 625.00 1250.00 1875.00 2500.00 Day s 1: 1: 1: 2: 2: 2: 0 6 12
1: ref erence mode 2: SD model delay ed discharges
1 1 1 1 2 2 2 2
Figure 20: Adding social care capacity when using the priority allocation system There are limitations affecting the success of coping policies. If social workers become stressed they may take time off work, leaving the remaining staff unable to cope with the large patient backlogs. This then raises other questions for management in regards to resource allocations of how these backlogs can be reduced.
20
12 new patients arriving per day
Reference Mode
Reference Mode Policy 6 with a large backlog of patients
Step 4: Design alternative policies and structure
An information system policy verses the priority allocation system
An alternative policy 7 of using a health and social care integrated information system is tested, as highlighted in figure 21. The information system serves to inform the capacity changes that are needed throughout the system based on backlogs of patients waiting for social services. As the responsiveness of the capacity changes are increased, this policy 7 is more effective in reducing delayed discharges than policy 2 of using the priority allocation system.
In combining the priority allocation system with the integrated information system as in policy 7, this has no further effect in reducing delayed discharges as shown in figure 22. This is due to the limiting effects of prioritising social worker duties, this can only done to a certain extent as seen earlier. Patients become delayed against capacity constraints.
Policy 2: The priority allocation system
Prioritisation of social worker duties to the allocation of section 5s over section 2s Policy 3: An integrated
information system policy
Using an integrated information system to inform capacity changes based on backlogs of patients waiting for services
Policy 7: Combination of polices
Combining the priority allocation system with the information system policy
Figure 21: An alternative information system policy
20:54 04 Jul 2009 Untitled Page 1 0.00 625.00 1250.00 1875.00 2500.00 Day s 1: 1: 1: 0 1 3
SD model delay ed discharges: 1 - 2 - 3 -
1 1 1 1 2 2 2 2 3 3 3 3
Figure 22: Simulation model outputs of the information system policy verses the coping policy
21 Policy 2
Step 5: Educate and Debate
Backlogs of patients waiting for social services intervention are a critical issue causing delayed discharge. The research has demonstrated that informal coping policies are important for maintaining control, as often there are constraints and delays around increasing resources to tackle delayed discharges.
When there is a small backlog of elderly people waiting to be admitted the priority allocation system is useful in helping to make beds available for patients to be admitted into the ward. This coping policy is useful by introducing a balancing loop to reduce the backlogs of section 2s and 5s; delayed discharges reduce as a result. However the research has shown this prioritisation coping policy is ineffective when there are large backlogs of patients waiting for section 2s and 5s. Dominant reinforcing loops are present driving the backlogs of patients waiting for social services to increase, resulting in the balancing loop failing to take effect to reduce the backlogs. Organisations tend to rely on coping policies, making things dangerous as organisations work beyond their safe capacities. Consequently other policies such as using an integrated information system to inform capacity changes is needed to be introduced by the organisation as informal policies only work to reduce delayed discharges to a limiting extent. As patients fill post hospital capacity, the flow of patients downstream in the post hospital section affects patients upstream from being able to move along the patient process.
Step 6: Implement Changes in Policies and Structure
The system dynamics model was developed into a flight simulator for research participants to experiment with the model. Responses from follow-up discussions and evaluation questionnaire indicated that the use of integrated information systems to inform capacity changes is something Southwark Council would consider implementing in the future. The integrated information system policy was well received as it was seen as an innovative approach to reducing delayed discharges. Often the NHS and Social Services information systems are used for inputting patient information and are not for making best use of the data generated from the information systems, which this policy has addressed.
Conclusion and Recommendations
The research has implications for social services management in helping them to decide on the best allocation policy of social worker duties of section 2s and 5s based largely on patient backlogs. Coping policies are routinely used within the NHS and Social Services. They are seen necessary as they minimise some of the unintended consequences and they make an invaluable contribution to service delivery. For example in the priority system those patients waiting for services are prioritised over those people waiting for initial social services assessments, so that their condition is less likely to deteriorate as a consequence of being in hospital. However priority policies were very disruptive to work schedules as social workers were changing priorities to cope with the limited number of social workers. The alternative policy of using an integrated information system seems to be the most optimal solution of reducing delayed discharges.
The following are recommendations for further research:
Area 1: International Comparisons of health and social care systems. To expand the research by comparing the findings of this project to that of the USA system. Having attended a SD conference in America (Sardiwal, 2009b) it had been made clear that the USA had more significant problems compared to that of the UK health and social care system.
Area 2: Discrete Event Simulation (DES). The research questions could be modified to look at how specific individual patients could be modelled, in order to provide further detailed analysis of discrete changes in system behaviour. Specifically looking at patients who experience delayed discharge due to placements of social services provision in nursing homes not being approved and the spread of MRSA through the elderly care wards, as these are areas that effect patient quality and were bottlenecks occur.
Area 3: Expanding the research to compare other Health trusts. Any significant differences or similarities would be drawn between trusts. Different information systems are in place and may exhibit different effects depending on how information systems are used by staff.
Area 4: Expanding the research to include the views of patients. The research could be expanded to include the view of patients, as these are the service users and a different perspective would have been bought to the study. They may have different views as to what effects information systems may have as recipients of the service. Area 5: Expanding the research to look at other areas of the health and social care sector. It would be useful to compare the experiences of NHS nurses and social workers in other areas of the hospital department or social services department. For example in the radiology department or with the Social Services Children Services department, as different information systems are in place and may exhibit different effects on service provision.
References
BBC (2009) Q & A: US healthcare reform. Available from <http://news.bbc.co.uk/1/
hi/8160058.stm> [Accessed 1st December, 2009]
Beresford, P (2010) Can I practice the social work I believe in within the Statutory Sector? Neo-Liberalism verses Social Justice, 17th February 2010 [Lecture], London,
London South Bank University
Checkland, P (2000) Systems thinking, Systems practice. John Wiley & Sons, New York, NY
Collins, T, Simmons, M (2005), Lack of proper training compounds problems, Computer Weekly, 12 April 2005, p.16
David, L 2009 Fun and Games with System Structure, Young OR 16, 24th-26th March
2009, University of Warwick
Gibbs, M (2010) Can I practice the social work I believe in within the Statutory Sector? Neo-Liberalism verses Social Justice, Social Work Task Force Report and
future social work, 17th February 2010 [workshop], London, London South Bank
University
Guardian 2009 Lifeline in a sea of bureaucracy, Society Guardian, 22nd April, 2009,
p6
Harris, Peter <[email protected]> ‘FOI Request ref 3151’ 10th April.
2008. Office e-mail. (11th April 2008)
Hirsch, G, Homer, J (2004) Modelling the Dynamics of Health Care Services for
Improved Chronic Illness Management, The 22nd International System Dynamics
Conference, 25th-29th July, 2004, Oxford
Holmes, K, Wolstenholme, E (1983) The Design of Colliery Information and Control
Systems. Available from
<http://www.systemdynamics.org/conferences/1983/proceed/parallel-vol1/holme220.pdf>[Accessed 21st April, 2009]
Panorama: Baby P- The Whole Truth. [TV programme] BBC1. 04/05/2009
Sardiwal, S 2009a Integrating Health and Social Care Provision via Systems
Thinking a case study analysis Young OR 16, 24th-26th March 2009, University of
Warwick
Sardiwal, S 2009b Evaluating the Effect of Integrated Health and Social Care Information Systems on Delayed Discharging of Patients, The 27th International System Dynamics Conference, 26th – 30th July, 2009, Albuquerque, New Mexico,
USA
System Dynamics Society (2009) System Dynamics Methodology Available from < http://www.systemdynamics.org/wiki/index.php/System_Dynamics_Methodology> [Accessed 21st April, 2009]
The NHS Confederation (2005) Leading Edge The potential of system dynamics
Available from
<http://www.symmetricsd.co.uk/files/le_systemdynamics_nov2005.pdf> [Accessed 21st April, 2009]
Webber-Maybank, M (2009) Making effective use of predicted discharge dates to
reduce the length of stay in hospital, Volume 105 No 15,21st April 2009 p12-p13
Wolstenholme, E, Monk, D, Smith, G, McKelvie, D (2005) Coping but not Coping in
Health and Social Care. Available from
<http://www.systemdynamics.org/conferences/2005/proceed/papers/WOLST122.pdf> [Accessed 21st April, 2009]
Wolstenholme (1990) System Enquiry, Surrey, John Wiley and Sons. Acknowledgements
Acknowledgement is given to my supervisors Professor Mike Kennedy, Professor Eric Wolstenholme, Professor Jon Warwick at London South Bank University for their support.