This is a preprint of a paper intended for publication in a journal or proceedings. Since changes may be made before publication, this preprint should not be cited or reproduced without permission of the author. This document was prepared as an account of work
sponsored by an agency of the United States Government. Neither the United States Government nor any agency thereof, or any of their employees, makes any warranty, expressed or implied, or assumes any legal liability or responsibility for any third party’s use, or the results of such use, of any information, apparatus, product or process disclosed in this report, or represents that its use by such third party would not infringe privately owned rights. The views expressed in this paper are not necessarily those of the United States Government or the sponsoring agency.
INL/CON-10-20411 PREPRINT
Fuzzy Logic Based
Anomaly Detection for
Embedded Network
Security Cyber Sensor
2011 IEEE Symposium on
Computational Intelligence in Cyber
Security
Ondrej Linda
Milos Manic
Todd Vollmer
Jason Wright
April 2011
Fuzzy Logic Based Anomaly Detection for Embedded
Network Security Cyber Sensor
Ondrej Linda, Milos Manic
University of Idaho Idaho Falls, ID, USA [email protected], [email protected]
Todd Vollmer, Jason Wright
Idaho National Laboratory Idaho Falls, ID, USA
[email protected], [email protected]
Abstract— Resiliency and security in critical infrastructure control systems in the modern world of cyber terrorism constitute a relevant concern. Developing a network security system specifically tailored to the requirements of such critical assets is of a primary importance. This paper proposes a novel learning algorithm for anomaly based network security cyber sensor together with its hardware implementation. The presented learning algorithm constructs a fuzzy logic rule base modeling the normal network behavior. Individual fuzzy rules are extracted directly from the stream of incoming packets using an online clustering algorithm. This learning algorithm was specifically developed to comply with the constrained computational requirements of low-cost embedded network security cyber sensors. The performance of the system was evaluated on a set of network data recorded from an experimental test-bed mimicking the environment of a critical infrastructure control system.
Keywords-— Anomaly Detection; Cyber Sensor; Embedded Systems; Fuzzy Logic System; Online Clustering;
I. INTRODUCTION
Critical infrastructure control systems, typically composed of interconnected computer-based stations, exchange crucial information via the computer network. These critical components, which can be found in systems such as SCADA or nuclear power plants, constitute a focus of an increased cyber security [1], [2]. Breaking into such systems with network intrusion attacks can have severe effects on multiple levels, such as security, public safety, industrial or economical. The danger is even higher considering that critical infrastructures are not immune to these threats and that they possibly may be more vulnerable than common information technology systems [3]. Therefore, network traffic anomaly detection for critical infrastructures is an obvious need [4].
Network intrusion detection systems originated in 1980’s and in the seminal work of Denning [5], [6]. Generally speaking, two kinds of IDS can be found; anomaly detection and signature based detection systems. Signature based detection system attempt to match the observed behavior against a database of known attack signatures. On the other hand, an anomaly based detection system seeks deviations from the learned model of normal behavior [7], [8]. The system builds a representative model exclusively based on the previously collected normal behavior. The system is capable
of detecting novel and dynamically changing intrusion instances, assuming that these are substantially different from the model of normal behavior. Unfortunately, any normal acceptable behavior not included in the training set will likely not match the model and generate false alarm. Hence, acquiring descriptive training dataset is of a crucial importance. The anomaly detection approach is adopted in the presented paper.
Computational intelligence techniques have been extensively applied to the problem of network intrusion detection [7], [9]. Techniques such as artificial neural networks [10]–[13], support vector machines [14], genetic algorithms [15], fuzzy logic [16], [17] or unsupervised clustering [18]-[20], proved to be powerful learning tools for modeling the network behavior. The attractiveness of computational intelligence comes from the ability to learn from multi-dimensional non-linear data [9].
The presented paper proposes a learning algorithm for a fuzzy logic based anomaly detection system specifically developed for the constrained resources of embedded network security cyber sensors [21]. A schematic view of the presented system is depicted in Fig. 1. Here the implemented cyber sensor creates a secure zone around the control system. The learning algorithm builds a fuzzy rule base, which describes the previously seen normal network communication behavioral patterns. This fuzzy rule base is constructed directly from the stream of incoming packets using the online version of the nearest neighbor clustering algorithm. Subsequently, the set of extracted clusters is transformed into individual fuzzy rules. Moreover, the algorithm can be re-trained on newly available normal behavior data, while
maintaining the previously acquired knowledge. The performance of the algorithm was tested on an experimental test-bed mimicking the critical infrastructure control system.
The rest of the paper is structured as follows. Section II provides a brief overview of fuzzy logic systems and the nearest neighbor clustering algorithm. The considered hardware platform for the embedded network security device is described in Section III. Section IV and V explain the network behavior feature extraction technique and the proposed anomaly detection algorithm, respectively. The system is experimentally evaluated in Section VI and Section VII concludes the paper.
II. BACKGROUND OVERVIEW
This section provides a brief background overview of fuzzy logic systems and the nearest neighbor clustering algorithm.
A. Fuzzy Logic Systems
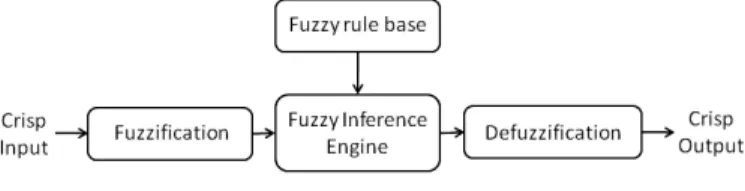
Fuzzy logic has been originally proposed by Zadeh as a tool for dealing with linguistic uncertainty and vagueness ubiquitous in the imprecise meaning of words [23]. A Fuzzy Logic System (FLS) is composed of four primary parts – input fuzzification, fuzzy inference engine, fuzzy rule base and output defuzzification, as depicted in Fig. 2. The Mamdani FLS considered in this work maintains a fuzzy rule base populated with fuzzy linguistic rules in an implicative form.
Consider rule Rk that is described as follows [24], [25]:
Rule Rk: IFx1 is A1kAND … ANDxnis Ank
THENyk is Bk (1)
Here, symbol k
i
A and Bk denote the ith input fuzzy set and
the output fuzzy set of the kth rule, respectively, n is the
dimensionality of the input vector x& and yk is the associated
output variable. Each element of the input vector x& is first
fuzzified using the respective fuzzy membership function (e.g. Gaussian, triangular, trapezoidal, etc.). The fuzzification of
input value xi into fuzzy set Ai yields a fuzzy membership
grade
P
Aik(xi) . Using the minimum t-norm the degree offiring of rule Rk can be calculated as:
n i x x A i R k i k( ) min{
P
( )}, 1...P
& (2)After applying the rule firing strength via the t-norm operator to each rule consequent, the output fuzzy sets are aggregated using the t-conorm operator (e.g. the maximum
operator) resulting in a output fuzzy set B. For detailed
description of the fuzzy inference process refer to [24], [25]. In order to obtain the crisp output value, one of the available defuzzification techniques is applied. Upon discretizing the
output domain into N samples, for example the centroid
defuzzifier can be applied:
¦
¦
N i i B N i i B i y y y y 1 1 ) ( ) ( P P (3)B. Nearest Neighbor Clustering
The Nearest Neighbor Clustering (NNC) algorithm is an unsupervised clustering technique [9]. The clustering process is controlled by an established maximum cluster radius parameter. The smaller the radius the more clusters will be generated and vice versa.
Assume an input dataset X composed of N input patterns
denoted as:
^
`
n i N x x xX &1,...,& ,& (4)
Here, n denotes the dimensionality of the input domain.
Vector x&i can be expressed as xi {x1i,...,xin}
&
.
Each cluster constitutes a prototype of similar instances, subject to a specific similarity measure. The Euclidean distance similarity measure is considered in this work. Each
cluster Pi is described by its Center Of Gravity (COG) ci
& and
its associated weight wi. The weight wi stores the number of
patterns previously assigned to cluster Pi. Following this
notation, cluster Pican be expressed as:
^
`
i n i i i i c w c w P &, ,& , (5)The learning process of the NNC algorithm begins by
creating an initial cluster P1 at the location of the first input
pattern x1
&
. Next, input patterns from dataset X are selected in
a sequential manner. The nearest prototype from the set of available clusters is determined for each instance. For an input
patternx&i , the nearest cluster Pa is determined using the
Euclidean distance norm:
c x c x c x j C dist in n j i j j i a, min ... , 1... 2 2 1 1 & & (6)Here, C denotes the number of currently acquired clusters.
Using the maximum cluster radius parameter - rad, theinput
pattern x&i is assigned to cluster Pa if the following condition
holds:dist
c&a,x&idrad. In this case, the parameters of clusterPa are updated as:
1 , 1 a a a i a a a w w w x c w c & & & (7)
If dist
c&a,x&i!rad, a new cluster is created at the locationof input pattern x&i, and its weight is set to 1.
III. EMBEDDED NETWORK SECURITY CYBER SENSOR
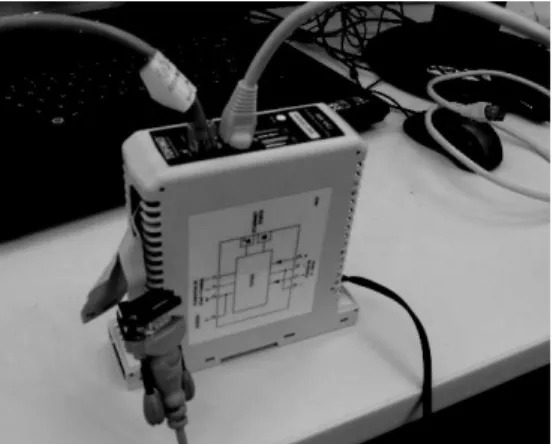
The Tofino embedded network security device, depicted in Fig. 3, is manufactured by Byres Security Inc. [22]. Originally, the device was developed for pre-emptive threat detection, termination and reporting, specifically tailored for the needs of SCADA and industrial control systems. Its major advantages are primarily its low-cost and ease of deployment in real world systems. In the presented work, the Tofino cyber sensor was used as an embedded development platform for implementation of the proposed anomaly based detection learning algorithm.
The Tofino platform consists of an Arcom Vulcan single board computer. The main processor is an Intel IXP425 XScale processor running at 533MHz with 64MB of DRAM and 32MB of flash memory. The Intel IXP425 XScale is based on an ARM V5TE instruction set [26]. Two Ethernet ports are provided along with two USB ports. The Ethernet ports are used in processing packet data and the USB ports are used for storage of statistics. The operating system is based on the OpenWRT distribution of Linux.
One of the specifics of this embedded platform is that the Intel IXP425 XScale processor used in the Tofino platform does not have a floating point unit (FPU). Instead, the floating point arithmetic used in the presented algorithm is emulated. Future work will include modification of the current implementation to use fixed point (integer) arithmetic. Depending on the implementation, a large performance gain may be achieved by using the SIMD Multiply-Accumulate unit coprocessor unit available on the IXP425. This coprocessor allows 16x32 multiply-accumulate operations to complete in a single cycle.
While not of utmost concern in an academic setting, the implementation of the proposed algorithm on a hardware platform is relevant. Sommer and Paxson [7] argue that it in
terms of capabilities and limitations it is important to obtain insight into the performance of an anomaly detection system from an operational point of view. The focused implementation is here at a very low level with an envisioned deployment just before some critical equipment, such as a Programmable Logic Controller (PLC). With the increasingly common usage of network based control systems and the current deployment of smart grid systems hundreds, thousands and possibly millions of devices will be interconnected. This makes the cost and reliability of an implemented hardware solution a relevant concern. In addition, the proposed hardware implementation of the embedded network security cyber sensor provides a performance baseline that might prove useful for comparison in future work.
IV. DATA ACQUISITION AND FEATURE EXTRACTION
This section describes the network data acquisition process and reviews the previously published window based feature extraction technique.
A. Control System Experimental Test-Bed
The hardware experimental test-bed system that was used for network data acquisition represents several aspects of an operational control system, such as operational control structure, control system network and hardware control of actual physical processes. RSView32, a Rockwell Software HMI product, provides an integrated component based interface for monitoring of the system behavior. The interface runs on a Windows XP laptop connected via an IPv4 network. A Moxa EDS-505A operated Ethernet switch provides network connectivity for the controller. This switch is mounted on a DIN-Rail and powered by the control system source. All network traffic to and from the controller is transported via the switch. Port mirroring has been enabled on the control traffic port connected to the HMI machine. A
Linux laptop with the tcpdump software application was
Fig. 3 Photo of the TOFINO network security cyber sensor plugged-in into the test system.
Fig. 4 Network data acquisition setup. A PLC is connected through a hub to the control PC station using an Ethernet network.
attached to the mirror port allowing for network traffic capturing and monitoring. Finally, a second Linux-based laptop representing the attacker-compromised machine was attached to a third port. All anomalous traffic was instantiated from this machine.
The control system itself consists of an Allen-Bradley MicroLogix 1100 PLC [27]. Attached to the PLC are 6 lighted buttons, 7 lights, 2 potentio-meters, 2 temperature sensors and a small electric fan constituting both digital and analog input/output points. All of the items are capable of being controlled individually from the PLC or directly by pressing a button. The experimental is depicted in Fig. 4.
B. Feature Extraction from Packet Stream
In a previous work of the authors, an Artificial Neural Network (ANN) based intrusion detection system was developed [13]. The ANN was trained on a sub-set of available network traffic features extracted by a window-based feature extraction technique applied directly to the stream of packets. This feature extraction technique is also utilized in the presented work. Here, the inherent time series nature of the packet stream data is described by a vector capturing the statistical behavior of the network traffic. The applied window segments the packet stream and monitors only a limited set of consecutive packets.
As described in [13], a window of specified length E is
being shifted over the stream of network packets. At each
position of the window a feature vector rj
&
is computed from
all the packets vi
&
currently presented in the window. The next
arriving packet is pushed into the window, while the last packet is removed from the end. The process of window based feature extraction is illustrated in Fig. 5.
Table I summarizes the list of extracted window-based statistical features. This set of features was empirically selected based on the analysis of the recorded network traffic and the motivation to most accurately capture the time series nature of the packet stream. For further details and evaluation of the window based feature extraction refer to [13].
V. ONLINE LEARNING FOR ANOMALY IDS
This section presents the learning algorithm for the fuzzy logic based anomaly detection for an embedded network security cyber sensor. First, rule extraction via adapted online NNC algorithm is presented. Next, the fuzzy rule based normal behavior modeling is explained.
A. Rule Extraction via Online Clustering
The proposed rule extraction algorithm takes into account the constrained computational resources of the available embedded network security cyber sensor. Other learning approaches, such as the previously published IDS-NNM algorithm [13], pursue offline learning approach once all training data have been acquired. However, such learning process is typically computationally unfeasible for the considered embedded devices, given the typically encountered network traffic density [21].
This paper proposes a new low-cost online rule extraction technique. The presented algorithm learns directly from the stream of incoming packets. In this manner, the need for storing all packet information into memory is eliminated. The final normal network behavior model is composed of a set of fuzzy rules. Each rule is extracted using an online version of the adapted NNC algorithm. The algorithm maintains additional information about the spread of data points associated with each cluster throughout the clustering process.
Each cluster Pi of encountered normal network behavior is
described by its center of gravity ci
&
, weight wiand a matrix of
boundary parameters Mi. Hence:
n i i n i i i n i i i i i i i c c c c M c c c M w c P & & 1 1 1 }, ..., , { }, , , { (8)
Here, i is the index of particular cluster, cijis the attribute
value in the jth dimension, cijand
j i
c are the upper and lower
bounds on the encountered values of the jth attribute for data
points assigned to cluster Pi and n denotes the dimensionality
of the input. The algorithm maintains a set of clusters :.
Initially, the algorithm starts with a single cluster P1
positioned at the first supplied training data point x1
&
. This initial data point becomes available once the shifting window first fills with the incoming packets.
Upon acquiring a new data point xi
&
from the shifting
window buffer, the set of clusters : is updated according to
the NNC algorithm. First, the Euclidean distance to all Fig. 5 Window based feature extraction process [13].
TABLEI
SELECTED WINDOW-BASED FEATURES
Num. of IP addresses Num. packets with 0 win. size Avg. interval between packets Num. packets with 0 data length
Num. of protocols Average window size Num. of flag codes Average data length
available clusters with respect to the new input feature vector
i
x& is calculated. The nearest cluster Pa is identified. If the
computed nearest distance is greater than the established maximum cluster radius parameter, a new cluster is created.
Otherwise the nearest cluster Pa is update similarly as in (7):
1 , 1 a a a i a a a w w w x c w c & & & (9) n j c x c c x c j ij i j i j i j i j i max( , ), min( , ) 1... (10)
Hence, the modified NNC algorithm also keeps track of the lower and upper bounds of the encountered input values in each dimension for every cluster.
If the nearest cluster is further away than the established maximum cluster radius, a new cluster is created according to the standard NNC algorithm.
B. Fuzzy Rule Based Behavior Modeling
Once the rule extraction phase of the learning process is finalized (e.g. user decision, time limit, limit on the number of packets, etc.), the learning algorithm maintains a final set of
clusters : that describe the normal network communication
behavioral patterns observed in the provided training data. In the next phase of the algorithm, each cluster is converted into a fuzzy logic rule. Each fuzzy rule describes the belonging of a particular sub-region of the multi-dimensional input space to the class of normal behavior.
An n-dimensional cluster Pi is transformed into its associated
fuzzy rule Ri as follows. Rule Ri is composed of n antecedent
fuzzy sets Aj j n
i, 1... . Each fuzzy set
j i
A , located in the jth
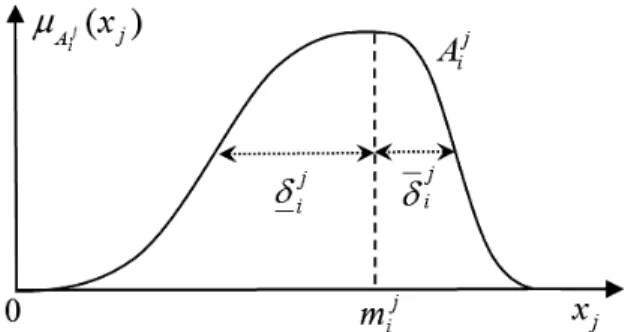
dimension of the input space, is modeled using a non-symmetrical Gaussian fuzzy membership function with distinct left and right standard deviations. There are three
parameters of the membership function, namely mean mij and
the left and the right standard deviations Gij,
j i
G , as shown in
Fig. 6. The parameter values are extracted based on the
computed cluster Pi in the following manner:
j i j i c m (11) ) ( j i j i j i D c c G (12) ) ( ij ij j i
D
c cG
(13)Here, symbol
D
denotes the fuzziness parameter, which isused to adjust the spread of the membership functions. Using
the minimum t-norm, the firing strength of fuzzy rule Ri is
then computed as:
)} ( { min ) ( ... 1 n A j j R x j x i i
P
P
& (14)In this specific application, the output of the fuzzy rule is a singleton fuzzy set assigning the input pattern to the normal behavior class. Hence, in this special case the fired output of a
particular fuzzy rule is actually its own firing strength (x)
i
R
&
P .
The final output decision y of the anomaly detection system is
obtained by applying to maximum t-conorm to the output of all available rules:
) ( max ) ( ... 1 x x y Ri C i & & P (15)
Here, C denotes the number of extracted fuzzy rules. The
value of the output y denotes the degree of belonging of input
pattern x&to the class of normal behavior. By applying a crisp
decision threshold the input pattern can be labeled as either anomalous or normal network behavior.
(a) (b) (c)
(d) (e) (f)
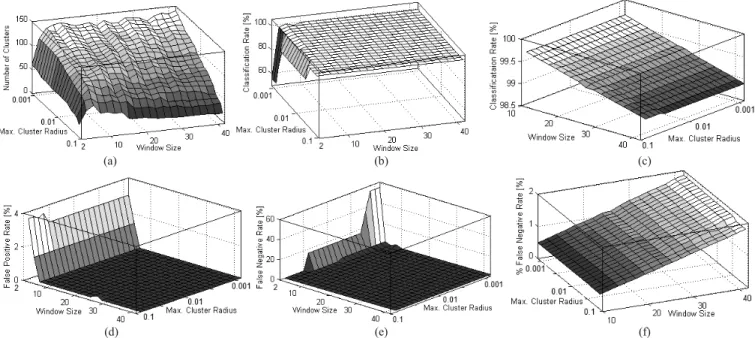
Fig. 7 Parameter control analysis of the proposed anomaly detection algorithm. Figures show the number of generated clusters (a), correct classification rate (b), zoomed-in view of the classification rate (c), false positive rate (d), false negative rate (e), and zoomed-in view of the false negative rate (f) for different values of window size and maximum cluster radius parameters.
VI. EXPERIMENTAL RESULTS
This section first describes the acquired experimental datasets. Next, the suitable values of control parameters are found by analyzing their impact on the performance of the algorithm. Finally, the classification performance is evaluated on the acquired testing datasets.
A. Experimental Datasets
The Nmap [28] and Nessus [29] software utilities were used
to create anomalous network traffic behavior in an attempt to
emulate the probes of a cyber attacker. Nmap is a network
scanning tool commonly used to identify hosts, scan ports, operating systems and to determine applications that are listening on open ports. It has many options and provides useful reconnaissance information for determining further
courses of action. Nessus is a network scanning tool that
provides auditing capabilities, vulnerability assessments and profiling information. In addition to general computer related assessments, control system specific vulnerabilities are available and were used on the previously described experimental test-bed.
The simulated intrusion attempts include: ARP pings, SYN stealth scans, port scanning, open port identification and others. Cyber attacks ranged from long attacks composed of many packets to very short intrusion sequences. Two sets of experimental data have been recorded. The recorded training set is composed of 6 dataset with only normal network behavior. Overall, 60,661 packets of normal network traffic were acquired including specialized normal behavior such as system initialization and system component reconnection. The second set is a testing set composed of 11 datasets, which include simulated abnormal behavior. Overall 213,924 packets have been recorded.
B. Parameter Tuning
The performance of the presented anomaly detection algorithm depends on the values of several control parameters: i) window size of the window feature extraction, ii) maximum cluster radius for the online NNC algorithm, iii) the fuzziness
parameter
D
of the fuzzy membership functions, and iv) thevalue of the crisp threshold for normal/anomaly traffic labeling.
The correct classification, the false negative and the false positive rates were used as performance measures. The correct classification rate is the percentage of the overall correctly classified data instances. The false negative rate is the ratio of incorrectly labeled normal behavior inputs and the overall number of normal behavior instances. The false positive rate is the ratio of incorrectly label anomalous inputs and the overall number of anomalies.
Fig. 7 and Fig. 8 depict the performance for different values of window size, maximum cluster radius and the crisp decision threshold. Fig. 7(a) shows the number of generated clusters. This number monotonically increases with the decreasing maximum cluster radius and reaches its maximum for window size around 6. The more clusters generated, the more detailed the model. However, a more detailed model increases the chance of overfitting and requires additional computational time. From Fig. 7(b)-(f) it can be seen that the classification performance primarily depends on the window size. Small values of window size (e.g. 2, 4 or 6) generate increased number of false negatives with non-zero false positive rate (~4%). From the detailed view in Fig. 7(c) and Fig. 7(f) it is apparent that there is a slight gradient towards smaller values of window size. Hence, values of window size around 10 seem to yield optimal results for the given datasets.
(a) (b) (c)
Fig. 8 Parameter control analysis of the proposed anomaly detection algorithm. Figures show the correct classification rate (a), the false negative rate (b), and the false positive rate (c) for different values of window size and the sensitivity threshold.
(a)
(b)
(c)
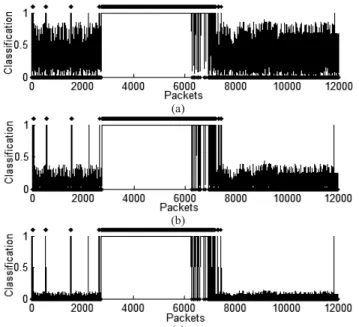
Fig. 9 Anomaly detection performance on dataset 1 for values of parameter
D
= 0.5 (a), 1 (b), and 2.0 (c).Fig. 8 investigates the influence of the crisp decision threshold and the window size. High rates of both false positives and negatives can be again seen for smaller values of window size and for smaller values of decision threshold. The figures demonstrate that with window size of approximately 20 packets, the algorithm is least sensitive to the value of the crisp decision threshold. This is likely to be where the best separation between normal and anomaly behavior is obtained.
The influence of the fuzziness parameter of the membership function is briefly demonstrated in Fig. 9. Here, the response of the algorithm applied to dataset 1 (thin line is algorithm
output, thick line marks known intrusions) is plotted. It can be observed that smaller values of the fuzziness parameter produce narrower membership functions, which tend to reject more instances of more unusual normal behavior. However, larger values of the fuzziness parameters would eventually lead to increased false positive rate as anomaly instances would become less distinct from the normal behavior.
In summary, the following parameters have been selected as the optimal values for the acquired experimental data: window size = 20, maximum cluster radius = 0.01, the fuzziness
parameter
E
= 2.0, and crisp threshold = 0.9.(a)
(b)
(c)
Fig. 10 Anomaly detection performance of the proposed algorithm on segments of packets from datasets 2 (a), 3 (b), and 4 (c). Thin line represents system decision, thick line denotes the known anomalous behavior.
TABLEII
CLASSIFICATION PERFORMANCE OF THE FUZZY LOGIC BASED ANOMALY DETECTION ALGORITHM ON DIFFERENT DATASETS
Datasets Number of Packets Classification
Rate False Negatives False Positives
Processing Time per Packet Data 1 35,112 99.702 % 1.485% 0.000 % 0.264 ms Data 2 29,147 99.586 % 1.448 % 0.000 % 0.217 ms Data 3 34,148 99.517 % 1.251 % 0.000 % 0.206 ms Data 4 13,131 99.313 % 0.715 % 0.000 % 0.206 ms Data 5 10,444 99.299 % 0.721 % 0.000 % 0.206 ms Data 6 5,401 99.053 % 1.006 % 0.000 % 0.196 ms Data 7 7,926 99.646 % 0.369 % 0.000 % 0.198 ms Data 8 23,134 99.307 % 0.704 % 0.000 % 0.201 ms Data 9 24,388 99.531 % 0.502 % 0.000 % 0.210 ms Data 10 15,431 99.422 % 0.701 % 0.000 % 0.201 ms Data 11 15,565 99.180 % 1.002 % 0.000 % 0.226 ms Sum / Average 213,924 99.360 % 0.900 % 0.000 % 0.212 ms
C. Classification Performance Evaluation
The fuzzy logic based anomaly detection algorithms was applied to the 11 acquired testing datasets. The algorithm was trained on the 6 training datasets composed of 60,661 normal
behavior packets. The training took 11.946 s resulting in a
potentially maximum processing speed of over 5,000 packets per second. Altogether 71 fuzzy rules were extracted.
The classification performance is summarized in Table II. Here, the classification rate, the false negative and the false positive rates are depicted for each dataset and the average values are calculated. It can be observed that the algorithm maintained 0% false positive rate and 0.9% average false negative rate. Hence, no intrusion attempts were missed, while maintaining low false negative rate.
Fig. 10 visually demonstrates the classification of datasets 2, 3 and 4. The thin line denotes the prediction of the anomaly detection system and the thick line above the system response marks the known occurrence of the anomalous behavior. It can be seen that the proposed anomaly detection system responded well to both long and short intrusion attempts.
VII. CONCLUSION
This paper presented a novel fuzzy logic based anomaly detection algorithm for embedded network security cyber sensors. The anomaly detection algorithm was specifically designed to allow for both fast learning and fast classification on the constrained computational resources of the embedded device. The algorithm extracts fuzzy rules using an adapted version of the online nearest neighbor clustering algorithm directly to the stream of packets.
The proposed algorithm was tested on an experimental test-bed mimicking the environment of a critical infrastructure control system with emulated probes of a cyber attacker. The control parameters of the presented algorithm were tuned via performance analysis. The final performance evaluation was performed on a set of 11 test datasets with over 200,000 packets with a wide range of anomalous network behavior. The experimental analysis yielded 99.36% correct classification rate with 0.0% false positive rate and 0.9% false negative rates.
The primary direction for future work includes incorporating type-2 fuzzy logic into the algorithm design, fusing the anomaly-detection based system with intrusion signatures to improve the classification performance and deploying the algorithm in real operational settings.
REFERENCES
[1] D. Yang, A. Usynin, J. W. Hines, “Anomaly-Based Intrusion Detection for SCADA Systems,” in Proc.of 5th Intl. Topical Meeting on Nuclear
Plant Instrumentation, Control and Human Machine Interface Technologies (NPIC&HMIT 05) , Albuquerque, NM, Nov 12-16, 2006. [2] H. S. Kim, J. M. Lee, T. Park, W. H. Kwon, “Design of networks for
distributed digital control systems in nuclear power plants,” Intl. Topical Meeting on Nuclear Plant Instrumentation, Controls, and Human-Machine Interface Technologies (NPIC&HMIT 2000), Washington, DC, November 2000.
[3] Dana A. Shea, “Critical Infrastructure: Control Systems and the Terrorist Threat,” Report for Congress RL31534, February, 2003.
[4] C. G. Rieger, D. I. Gertman, M. A. McQueen, “Resilient Control Systems: Next Generation Design Research,” in Proc. 2nd IEEE Conf. on
Human System Interactions, Catania, Italy, pp. 632-636, May 2009. [5] J. P. Anderson, Computer security threat monitoring and surveillance,
Technical report, James P. Anderson Co, 1980.
[6] D. E. Denning, “An Intrusion Detection Model,” in IEEE Trans. on Software Engineering,vol. SE-13, pp. 222-232, February 1987. [7] R. Sommer, V. Paxson, “Outside the Closed World: On Using Machine
Learning For Network Intrusion Detection,” in Proc. of IEEE Symp. on Security and Privacy, Oakland, California, pp. 305-316, 2010.
[8] V. Chandola, A. Banerjee, V. Kumar, “Anomaly Detection: A Survey,”
Technical Report, University of Minnesota, 2007.
[9] I. H. Witten, E. Frank, Data Mining: Practical Machine Learning Tools and Techniques, Morgan Kaufmann Publishers, 2005.
[10] Z. Zhang, J. Li, C. Manikopulos, J. Jorgenson, J. Ucles, “HIDE: a Hierarchical Network Intrusion Detection System Using Statistical Preprocessing and Neural Network Classification,” in Proc. IEEE Workshop on Information Assurance and Security, 2001.
[11] J. Ryan, M. Llin, R. Miikkulainen, “Intrusion Detection with Neural Networks, ” in Advances in Neural Information Processing Systems 10, Cambridge, MA, MIT Press, 1998.
[12] H. Debar, B Dorizzi, “An Application of a Recurrent Network to an Intrusion Detection System,” in Proc. of the International Joint Conference on Neural Networks, pp. 78-83.
[13] O. Linda, T. Vollmer, M. Manic,“Neural Network Based Intrusion Detection System for Critical Infrastructures,” in Proc. Int. Joint INNS-IEEE Conf. on Neural Networks, Atlanta, Georgia, June 14-19, 2009. [14] W. Hu, Y. Liao, V. R. Vemuri, “Robust Anomaly Detection Using
Support Vector Machines,” in Proc. International Conference on Machine Learning, 2003.
[15] G. Stein, B. Chen, A. S. Wu, K. A. Hua, “Decision Tree Classifier For Network Intrusion Detection With GA-based Feature Selection,” in
Proc. of the 43rd ACM Southeast Conference, Kennesaw, GA, March
2005.
[16] F. Gonzalez, D. Dasgupta, J. Gomez, M. Kaniganti, “An Evolutionary Approach to Generate Fuzzy Anomaly Signatures,” in Proc. the IEEE Information Assurance Workshop, June 2003.
[17] J. Gomez, D. Dasgupta, F. Gonzalez, “Detecting Cyber Attacks with Fuzzy Data Mining Techniques,” in Proc. of the Workshop on Data Mining for Counter Terrorism and Security, 3rd SIAM Conference on
Data Mining, San Francisco, CA, May, 2003.
[18] S. Zhong, T. Khoshgoftaar, N. Seliya, “Clustering-based network intrusion detection,” in Intl. Journal of Reliability, Quality and Safety, Vol. 14, No. 2, 2007, pp. 169-187.
[19] Q. Wang, V. Mehalooikonomou, “A Clustering Agorithm for Intrusion Detection,” in SPIE Conference on Data Mining, Intrusion Detection, Information Assurance, and Data Networks Security, Orlando, Florida, USA, 2005.
[20] L. Portnoy, E. Eskin, S. Solfo, “Intrusion detection with unlabeled data using clustering,” in Proc. Of ACM CSS Workshop on Data Mining Applied Security, Philadelphia, PA, November 5-8, 2001.
[21] R. Sommer, V. Paxson, N. Weaver, “An architecture for exploiting multi-core processor to parallelize network intrusion prevention,”
Concurrency Computation: Practice and Experience, 21: 1255-1279, 2009.
[22] Tofino webpage [URL], Available: http://www.tofinosecurity.com, from October 2010.
[23] L. A. Zadeh, “Fuzzy Sets,” in Information and Control, vol. 8, pp. 338-353, 1965.
[24] J. M. Mendel, Uncertain Rule-Based Fuzzy Logic Systems: Introduction and New Directions, Upper Saddle River, NJ: Prentice Hall PTR, 2001. [25] G. J. Klir, B. Yuan, Fuzzy Sets and Fuzzy Logic Theory and
Applications, Prentice Hall, New York, 1995.
[26] Intel Corporation, Datasheet—Intel IXP42X Product Line of Network Processors and IXC1100 Control Plane Processor, June 2007.
[27] Allan Bradley PLC 5 Controller webpage, Available:
http://www.ab.com/programmablecontrol/plc/, from October 2010. [28] Nmap webpage [URL], Available: http://nmap.org, from October 2010. [29] Nessus webpage [URL], Available: http://www.nessus.org.org/nessus/,
![Fig. 1 Schematic diagram of the network security cyber sensor [20].](https://thumb-us.123doks.com/thumbv2/123dok_us/415378.2547583/2.918.472.851.326.468/fig-schematic-diagram-network-security-cyber-sensor.webp)