SYNTHETIC APERTURE RADAR FOR COASTAL EROSION MAPPING AND LAND-USE ASSESSMENT IN THE MOIST TROPICS: BRAGANÇA COASTAL PLAIN CASE STUDY
Pedro Walfir M. Souza Filho1,* and Waldir Renato Paradella2
1 Federal University of Pará, Geoscience Center, Belém, PA, Brazil. e-mail: [email protected] 2 National Institute for Space Research, S.J. Campos, SP, Brazil. e-mail: [email protected],
ABSTRACT
With SAR's side viewing geometry, longer wavelengths, and almost all-weather sensing capability, RADARSAT-1 imagery has been extensively used as monitoring tool for coastal changes in the moist tropics. In this investigation, RADARSAT Fine Mode data acquired in 1998 was combined with airborne SAR X-HH GEMS acquired in 1972 during the RADAM Project and it was possible to evaluate the large-scale coastal changes occurring over the past three decades.
The orbital SAR data was digitally geometric corrected (ortho-rectified) and filtered for speckle noise. The airborne SAR data, originally available on mosaic format, was scanned and geometrically corrected through polynomial method. A simple method to estimate shoreline changes was carried out based on the superimposition of shoreline vectors extracted from the airborne radar and related features present on the RADARSAT data. The results of the investigation have allowed characterizing changes in the area associated with shoreline retreat and accretion. In addition, the estuarine and tidal channel displacements have also provided an understanding of the coastal sedimentary dynamic, marine transgression and sea-level changes in this sector of the Northern Brazilian coast.
Key words: coastal changes, orbital RADARSAT-1, airborne RADAMBRASIL SAR data. INTRODUCTION
The Bragança coastal plain situated along the northeast of the State of Pará (northeastern Brazilian Amazon) is part of one of the largest macrotidal mangrove coast of the world, with almost 6,000 km2 (Herz, 1991). Geologically, the Amazon coastal zone is poorly mapped. The RADAMBRASIL Project, in the beginning of the 70’, carried out the first regional mapping project in the area. With the SAR´s side viewing geometry, a longer wavelength, airborne X-HH band SAR imagery from the RADAMBRASIL was extensively used as an operational tool for regional mapping in the coastal Amazon environments.
A recent RADARSAT Fine Mode acquisition campaign was undertaken during September 1998 in the area. In contrast with optical data, orbital SAR imageries (ERS-1, JERS-1, RADARSAT-1) have been extensively used for mapping and monitoring wet tropical coastal environments (Singhroy, 1996; Barbosa et al. 1999; Kushwaha et al., 2000). This paper emphasizes the importance of using SAR images for coastal zone mapping purposes. In addition, the integration of information got from old and new SAR imageries has allowed the evaluation of the shoreline changes and mapping of areas at risk related to coastal erosion.
Anais X SBSR, Foz do Iguaçu, 21-26 abril 2001, INPE, p. 339-347, Sessão Técnica Oral - Workshops
STUDY AREA
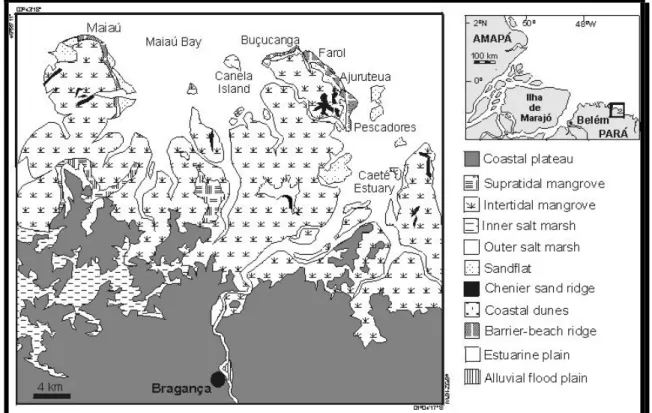
The study area is located in the northeast of the State of Pará, around 1º S and 46º W (Figure 1). A continuous mangrove belt of around 20 km wide fringes the shoreline with elevation from 1 up to 2 m above mean tide level. A wet season from December to May and a dry season from June to November mark the climate. Trade winds blow from northeast throughout the year, most strongly during the dry season. The average annual rainfall reaches 2,500 mm and the mean tidal range measures around 5 m in a semi-diurnal cycle, and during the spring tides is locally as high as 6 m. Thus, during spring tides large areas of the low land are inundated as a result of both high rainfall with runoff rates and tidal inundation. Strong tidal currents and waves are responsible for the erosion of mangroves along the coast, estuaries and bays, where lines of fallen mangroves trees mark the eroded places. On the other hand, new mangrove fringes are prograding seaward in response to muddy sedimentation (Souza Filho and El-Robrini, 1998).
Figure 1- Location and geomorphological map of the Bragança coastal plain.
The area can be subdivided into three main geomorphologic compartments: (1) alluvial plain; (2) estuarine plain; and (3) coastal plain, with salt marshes (inner and outer), tidal flats (supratidal mangroves, intertidal mangroves, muddy and sandy tidal flats), chenier sand ridges, coastal dunes, barrier-beach ridges and ebb-tidal delta environments (Souza Filho and El-Robrini, 2000) (Figure 1). The coastal plain is extremely irregular, with jagged nature of this low gradient coast. This
characteristic is result of falling relative sea level, coupled with a rapidly prograding coast as a result of riverine sediment supply.
The original vegetation over the coastal plateaus is constituted by tropical rain forest. This vegetation cover has been affected by anthropogenic activities (agriculture and human settlement). Mangrove forest is found on the tidal flat, grasses occur along the marshes and arbustive vegetation occupies the chenier sand ridges, dunes and backshore zone of the barrier-beach ridges.
DATA SET AND IMAGE PROCESSING
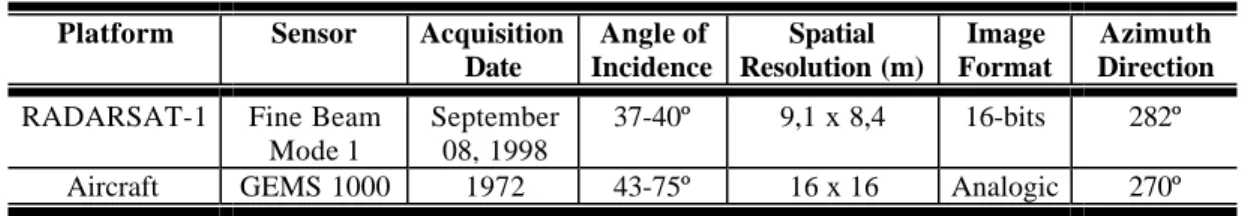
The investigation was based on airborne and spaceborne SAR images. The airborne X-HH band SAR data was acquired in 1972, during the RADAM Project. The spaceborne C-HH band RADARSAT Fine Beam Mode 1 (descending orbit) was acquired in 1998, under the GLOBESAR-2 Program (Paradella et al., 1997). Details of the SAR remotely sensed data used in this study are presented in the Table 1.
Table 1. Characteristics of the remotely sensed data. Platform Sensor Acquisition
Date Angle of Incidence Spatial Resolution (m) Image Format Azimuth Direction
RADARSAT-1 Fine Beam Mode 1
September 08, 1998
37-40º 9,1 x 8,4 16-bits 282º Aircraft GEMS 1000 1972 43-75º 16 x 16 Analogic 270º
The digital image analysis was carried out based on the EASI-PACE package (PCI, 1999). Antenna pattern correction (APC) and speckle suppression filtering were applied to the Fine Mode image as radiometric corrections. The initial processing steps for the RADARSAT data included the scaling of the image from 16 to 8 bits. Afterward, an adaptive enhanced-Frost filter (3x3 window) was used in order to reduce speckle effects (Lopes et al., 1990) during the ortho-rectification process. Due to the facts that the study area presents a low relief and no cartographic (planialtimetric) map was available, the rectification process was applied assuming a flat terrain model. The ortho-rectification model was based on twenty-five ground control points acquired from Global Position System (GPS) on the terrain. The statistics of the ortho-rectification for the Fine Mode data has indicated a pixel size of 12 meters based on the RMS accuracy. Further, the RADARSAT-1 Fine image was linearly stretched in order to enhance contrast between the coastal environment features.
The airborne SAR data was initially scanned and digitally rectified to a common UTM coordinates. Twenty-two ground control points were collected and the RMS accuracy for the geometric correction (first order polynomial method) was around 16 meters. This value was selected as pixel size. In order to extract the shoreline position in 1972, the airborne SAR image was classified in two classes: emerging coastal areas and coastal water. Afterwards, the raster data was converted to
interpreted and the coastal environments were mapped based on standard photo interpretation keys such as tone, texture, pattern, form and size. Black-white airphotos and field information were also used during this process. Finally, the extracted information was compared to the airborne SAR information and an estimate of coastline changes was possible.
RESULTS AND DISCUSSIONS
Mapping of coastal land cover
The RADARSAT-1 imagery has shown to be valorous in providing information to produce and update coastal land cover maps in this tropical environments, covered by clouds during all time. The Bragança Coastal Plain has suffered fast and dramatic changes in the landscape. The anthropogenic impacts are most related to the opening of roads over the mangroves to access the beaches and unplanned coastal land use, as well as the drops of solid wastes and groundwater contamination. Along the Bragança-Ajuruteua road it was detected areas where the mangrove ecosystems are completely deforested and in same places are subject to regeneration.
The interpretation of the RADARSAT-1 image has allowed the mapping of changing land cover. Flat and linear features bounded by mangrove forest, depicting as smooth surfaces with very dark tones, characterize the roads. Specular scattering is observed within the deforested mangrove areas, where high spring tides flood the muddy sediments (Figure 2). The natural regenerated mangrove sites present sparse and short vegetation distributed over flat muddy morphology. These factors favor the backscattered signal strength controlled by "corner reflector" mechanisms, producing high radar returns. Thus, this target shows a rough texture with high light gray tones (Figure 2). In a specific place, an artificial lake was formed due to a tidal creek damping by road (Figure 2).
Spatial and temporal analysis of shoreline change
A number of potential shoreline datum or geomorphic features can be used to monitor historical shoreline changes. However, in most situations, the high water line, represented in study site by the spring high tide level (SHTL), has been demonstrated to be the best indicator of the land-water interface for historical shoreline comparison study (Crowell et al., 1991). The SHTL delineates the landward extent of the last high tide, hence it is easily recognizable in the field and it can usually be detected from airborne and spaceborne remote sensed data. The landward extent is represented by mangrove forest easily discernible in SAR imageries and according Souza Filho (2000), mangroves are one of the best geoindicators for evaluating shoreline changes associated to erosional and depositional processes in muddy coast.
Figure 2- Land cover mapping from RADARSAT-1.
The long-term changes in shoreline position were measured between 1972 and 1998 using SAR data from airborne GEMS and spaceborne RADARSAT-1, respectively (characteristics are presented in table 1). The shoreline position accuracy was determined by surveying ground control points. Reference points consisted of the corner of discernible structures, road driveway fluvial intersections. After the geometric corrections, the GEMS RMS error was around 16 m, while RADARSAT-1 RMS error reached 12 m. Based on the statistics of the ortho-rectification, the maximum error due to the shoreline position change was estimated at ± 28 meters.
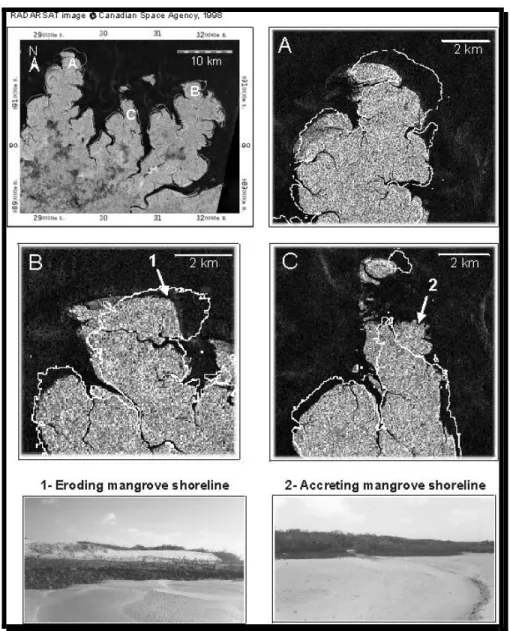
The impact of the natural dynamics at Bragança Coastal Plain has produced fast and dramatic changes in the shoreline position during the last three decades. Critical observations of large-scale coastal evolution from microwave remote sensing imageries provided clues to the natural history. The comparison between 1972 airborne GEMS and 1998 spaceborne RADARSAT-1 has shown that shoreline has been subjected to severe erosion and accretion degree and some sectors remains unchanged in the specific coastal site. In the ocean setting, the long-term shoreline recession reaches maximum distance of 1,500 m and 1,250 m ± 28 m in the Maiaú Point and Buçucanga Beach, respectively (Figure 3A and 3B). These erosional settings represent the most seaward boundary of the
for the shoreline retreat is related to sandflats migration landward over the mangrove deposits due to tidal currents and large wave action. Mangrove vegetation has been killed by rapid sand deposition over it and mangrove terrace has been eroded. Hence, great parts of the shoreline, principally beaches, are characterized as transgressive deposits (Souza Filho, 1995). The shoreline accretion sectors are well represented by the Picanço Point, where the shoreline position has migrated around 1,250 m seaward (Figure 3C). In this area, the continuous sediment supply and the geomorphological positions protected of wave attack, favor the accretion of sandbanks, muddy deposition and mangrove vegetation establishment. Therefore, mangrove trap sediments to build a depositional mud terrace in the upper intertidal flat and successive zones of pioneer vegetation (spartina sp.) and other mangrove species migrate seaward. Migration of islands is observed along the Maiaú Bay in response to oceanographic and sedimentary processes. For example, the Maciel Island migrated almost 1 km from 1972 to 1998 (Figure 3C).
Figure 3- 1998 RADARSAT image and superimposed vector showing shoreline changes since 1972, coastal erosion and accretion, island migration and geomorphologic features. Maiaú Point (A) and Buçucanga Beach (B) erosional sector; and Picanço Point (C) accretionary sector showing an island migration process.
Other coastal setting is related to estuarine processes, where tidal currents and tidal channel position have controlled the coastal evolution. Based on integrated remote sensed products (RADARSAT and TM composite, Souza Filho and Paradella, submitted), is possible to observe that erosional sectors are strongly controlled by estuarine and tidal channel positions. These tidal channels play a key role in the shoreline recession, due to the severe coastal erosional process caused by tidal channels displacement near the shoreline boundary (Figure 4). On the other hand, favorable areas are formed for shoreline accretion (Figure 4) where sandbanks are situated along the coast and the tidal channels do not reach the land-water boundary.
Figure 4- RADARSAT-1 and Landsat TM composite showing the coastal geomorphology and shallow water morphology. a = accretion and e = erosion.
CONCLUSIONS
This paper shows the RADARSAT's capability to provide unique geomorphological and land use on the Bragança Coastal Plain. Furthermore, the integration of this kind of information with ancillary data has allowed detecting coastal changes related to shoreline retreat and accretion. Sedimentary dynamic, tidal current, wave action and estuarine and tidal channel displacement have played an important role in the controlling of these coastal changes. Hence, SAR information in the moist tropical coastal environments can be used to:
§ Map the coastal sedimentary environment;
§ determine the position of submerse sandy banks in estuarine shallow waters;
§ map the directions of superficial tidal currents and surf zone;
§ determine the accurate position of the shoreline;
§ locate areas at coastal geologic risk.
Acknowledgment
The first author would like to thank the National Institute for Space Research (INPE) for the structural support for the digital image processing and the PROINT and PROF Project (Geoscience Center of Federal University of Pará) for the financial support for the fieldwork survey. Special thanks are extended to the anonymous reviewers for their helpful comments on the manuscript. The first author is also grateful to CAPES for Ph.D. scholarship. The second author would like to thank CNPq for a research grant during this investigation (CNPq process # 300985/90-8). Canadian Space Agency provided the RADARSAT-1 image under the GlobeSAR-2 Program.
REFERENCES
Barbosa, M.P.; Singhroy, V.; Saint-Jean, R. 1999. Mapping coastal erosion in Southern Paraíba, Brazil from RADARSAT-1. Canadian Journal of Remote Sensing, 25: 323-328.
Crowell, M.; Leatherman, S.P.; Buckley, M.K. 1991. Historical shoreline change: error analysis and mapping accuracy. Journal of Coastal Research, 7: 839-852.
Kushwaha, S.P.S., Dwivedi, R.S. and Rao, B.R.M. 2000. Evaluating of various digital image processing techniques for detection of coastal wetlands using ERS-1 SAR data. International Journal of Remote Sensing, 21: 565-579.
Lewis, A.J.; Henderson, F.M.; Holcomb, D.W. 1998. Radar fundamentals: the geoscience perspective. In: Henderson, F.M. and Lewis, A.J. (eds.), Principles & Applications of Imaging Radar. Manual of Remote Sensing. 3rd ed. New York, John Willey, p. 131-180
Lopes, A., Touzi, R. and Nezry, E. 1990. Adaptive speckle filters and scene heterogeneity. IEEE Transaction on Geoscience and Remote Sensing, 28: 992-1000.
Paradella, W. R.; Krug, T.; Laundry, R.; Pietsch, R. W. 1997a. GLOBESAR-2: O Programa de Avaliação de Dados do RADARSAT-1 nas Geociências Revista Brasileira de Geociências, 27: 403-406.
PCI, 1999. EASI-PACE User’s Manual, version 6.3, PCI Enterprises, Ontario, Canada.
Singhroy, V. 1996. Interpretation of SAR images for coastal zone mapping in Guyana. Canadian Journal of Remote Sensing, 22: 317-328.
Souza Filho, P.W.M. 2000. Mangroves as geological indicator of coastal changes. In: International Mangrove Conference, Recife, ISME/UFRPE, CD ROM of Full Paper.
Souza Filho, P. W. M. and El-Robrini, M. 2000. Coastal Zone Geomorphology of the Bragança Area, Northeast of Amazon Region, Brazil. Revista Brasileira de Geociências, 30, 518-522.
Souza Filho, P. W. M. and Paradella, W.R. Evaluation of Landsat Thematic Mapper and RADARSAT-1 Data to Geological Mapping on a Mangrove Coast, Bragança, Pará, Brazilian Amazon Region. Wetlands Ecology and Management (submitted).