2103 | P a g e
A Comprehensive Study on the Application of Regression
Coupled Differential Search Algorithm in Forecasting the
Influence of Turning Parameters on Machining
AISI 316L Steel
Dr.D.Ramalingam*
1, R.RinuKaarthikeyen
1, Dr.S.Muthu
2, Dr.V.Sankar
3*
1Associate Professor, Nehru Institute of Technology, Coimbatore, (India)
*corresponding author
1
Research Associate, Manager – Engineering, TCMPFL, Chennai, (India)
2
Principal, Adithya Institute of Technology, Coimbatore,( India)
3
Professor, Nehru Institute of Engineering and Technology, Coimbatore, (India)
ABSTRACT
AISI 316L steel material have the application in medical field as biomaterials, biomedical implants, biocompatible materials it requires the most desired surface quality. During machining processes bringing the product to the required surface quality is one of the prime confront responsibility in the manufacturing operations. Among the metal removal processes turning is the most advantageous machining process and commonly used by the manufacturing industries. Analyzing and optimizing the combination of the input machining parameters to achieve the desired surface finish is taken as the objective of this attempt with the Differential Search Optimisation technique in MATLAB programming. Referring to the convergence performance of the DSA along with the hybridization of the statistical regression relations and simulation is performed. The optimised parameter combinations for the required surface finish are identified.
Keywords
Turning, AISI 316L steel material, Minitab, Regression, Hybridization, Differential Search Algorithm,
MATLAB.
Abbreviations Used
v Cutting speed R-sq R - square statistical value
DOC Depth of cut R-sq (adj) R - square adjusted statistical value Exp Experiment R-sq (pred) R - square predicted statistical value
F Feed rate Reg Regression
2104 | P a g e
I. INTRODUCTION
Conventionally, the selection of cutting conditions for metal cutting is the prerogative of the manufacturers. In such circumstances, the knowledge of the operator plays a most important role, nevertheless even for a well experienced operator it is cumbersome to locate the optimum values every time. The chief machining parameters in metal turning operations are cutting speed, feed rate and depth of cut etc. The setting of these parameters determines the quality characteristics of turned parts. Since turning is the primary operation in most of the production processes in the industry, surface finish of turned components has greater influence on the quality of the product. Surface finish in turning has been found to be influenced in varying amounts by a number of factors such as feed rate, work material characteristics, work hardness, unstable built-up edge, cutting speed, depth of cut, cutting time, tool nose radius. Analyzing and optimizing the combination of the input machining parameters to achieve the desired surface finish while processing turning operation on the AISI 316L steel is taken as the objective of this attempt with the Differential Search Optimisation technique in MATLAB programming. Referring to the convergence performance of the DSA along with the hybridization of the statistical regression relations and simulation is performed.
II. RELATED LITERATURES
According to these parameters, a detailed literature survey is carried out as follows. K. Palanikumar, et al. [2] have demonstrated the application of the Taguchi method with fuzzy logic to optimize the machining parameters for machining of GFRP (Glass Fiber Reinforced Plastic) composites with multiple characteristics. A multi response performance index (MRPI) was used for optimization. The machining parameters like cutting speed, feed rate, depth of cut, and machining time were optimized with consideration of multiple performance characteristics like metal removal rate, tool wear, and surface roughness. T. Srikanth and V. kamala [3] indicated that a real coded Genetic Algorithm (RCGA) approach for optimization of cutting parameters in turning. This RCGA approach is quite advantageous in order to have the minimum surface roughness values, and their corresponding optimum cutting parameters, for certain constraints.
Adeel H. Suhail et al. [4] focused on an experimental study to optimize the cutting parameters using workpiece surface temperature and surface roughness by employing Taguchi techniques. T.G Ansalam Raj and V.N Narayanan Namboothiri [5] formed an improved genetic algorithm for the prediction of surface finish in dry turning of SS 420 materials. Taguchi offers a simple and systematic approach to optimize a performance, quality and cost. The quality of design can be improved by improving the quality and productivity in various company-wide activities. Al-Ahmari [6] developed empirical models for tool life, surface roughness, and cutting force for turning operations. Two important data mining techniques used were response surface methodology and neural networks. Taguchi’s parameter design offers a simple and systematic approach which can reduce number of
2105 | P a g e
were exploited to predict surface roughness and compared to actual and on-line measurements. Bajic et al. [12] focused on modeling of machined surface roughness and optimization of cutting parameters in face milling and examined the influence of cutting parameters on surface roughness in face milling. David et al. [13] described an approach to predict surface roughness in a high-speed end-milling process and used artificial neural networks and statistical tools to develop different surface roughness predictors. The activities concerned with quality include in quality of product planning, product design and process design. This attempt focuses on the optimisation of surface roughness parameter with reference to the inputs parameters using the Differential Search Algorithm linked by regression relationship.
III. EXPERIMENTAL WORKS AND MATHEMATICAL MODELING
Turning experiment has been conducted in the CNC lathe OKUMA Lb 10II model on the AISI 316L steel material which possesses the mechanical properties as listed in the Table 3.1 by Nokolaos [1] with the objective of analyzing the surface roughness on the machined product. This material is holding the application in medical field as biomaterials, biomedical implants, biocompatible materials, chemical processing, food processing, photographic, pharmaceutical, textile finishing, marine exterior trim. This material is holding good favorite, because of the superior corrosion resistance to inter granular corrosion, to most chemicals, salts, and acids and exhibits high creep strength at elevated temperatures.
Table 3.1 Mechanical characteristics of AISI 316L
Hardness, Rockwell B 79 HRB Tensile strength, ultimate 560 MPa
Tensile strength, yield 290 MPa Elongation of break 50% Modulus of elasticity 193 GPa
Poisson's ratio 0.29
The coated tool -DNMG 110402-M3 with TP 2000 coated grade which has rhombic shape with cutting edge angle 55° is utilized as the cutting tool material for the conduction of experiment. The coating on the tool is four layers of Ti [C, N] + Al2O3 + Ti [C, N] + TiN with the cutting edge angle as 93°. The primary machining
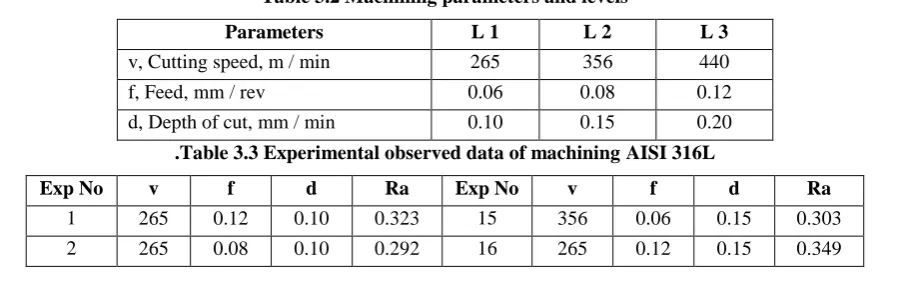
variables speed, feed and depth of cut were chosen as the input parameters and the surface roughness of the product is considered as the outcome parameter towards analysis. Three level of input parameter selected is listed in the Table 3.2. Experimental plan was followed with Taguchi L27 array. To measure the surface roughness, Atomic Force Microscope is utilized and the observed experimental data are tabulated in the Table 3.3
Table 3.2 Machining parameters and levels
Parameters L 1 L 2 L 3
v, Cutting speed, m / min 265 356 440 f, Feed, mm / rev 0.06 0.08 0.12 d, Depth of cut, mm / min 0.10 0.15 0.20
.Table 3.3 Experimental observed data of machining AISI 316L
Exp No v f d Ra Exp No v f d Ra
2106 | P a g e
3 265 0.06 0.10 0.289 17 265 0.08 0.15 0.307 4 356 0.12 0.10 0.295 18 265 0.06 0.15 0.307 5 356 0.08 0.10 0.280 19 265 0.12 0.20 0.460 6 356 0.06 0.10 0.266 20 265 0.08 0.20 0.411 7 440 0.12 0.10 0.237 21 265 0.06 0.20 0.410 8 440 0.08 0.10 0.215 22 356 0.12 0.20 0.405
9 440 0.06 0.10 0.176 23 356 0.08 0.20 0.369
10 440 0.12 0.15 0.319 24 356 0.06 0.20 0.344 11 440 0.08 0.15 0.317 25 440 0.12 0.20 0.393 12 440 0.06 0.15 0.251 26 440 0.08 0.20 0.348 13 356 0.12 0.15 0.330 27 440 0.06 0.20 0.345 14 356 0.08 0.15 0.321 - - - - -
VI.MATHEMATICAL REGRESSION MODELING
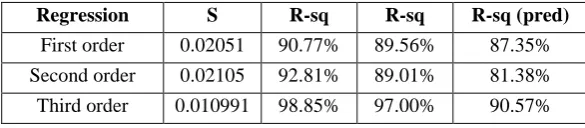
Commercial Minitab 17 software is engaged to derive the statistical relationship of the speed, feed and depth of cut vs. surface roughness. On comparison of the compiled first, second and third order regression models, the third order regression equations exhibits the statistical significance with 98.85 % R – Sq value which is given in the Table 4.1.
Table 4.1 Regression model comparison for Surface roughness
Regression S R-sq R-sq
(adj)
R-sq (pred)
First order 0.02051 90.77% 89.56% 87.35% Second order 0.02105 92.81% 89.01% 81.38% Third order 0.010991 98.85% 97.00% 90.57%
2107 | P a g e
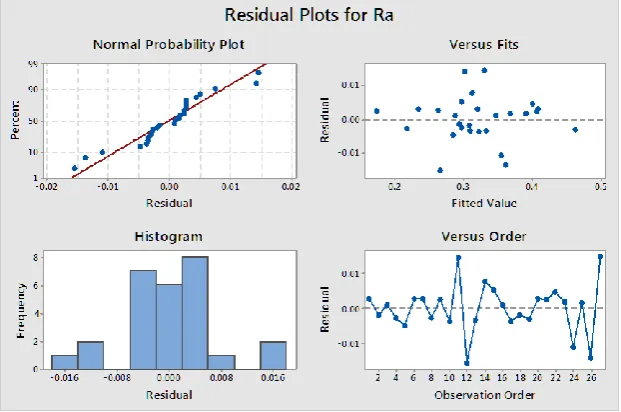
Figure 4.1 Residual plots of surface roughnessThe finalized third order regression equation through the Minitab17 for the surface roughness in terms of speed, feed and depth of cut combination are
Surface Roughness, Ra = (0.269) + (0.00364*t1(1)) – (5.50*t1(2)) – (5.38*t1(3)) – (0.000012*t1(1)^2) +(45.3*t1(2)^2) +(46.0*t1(3)^2) + (0.0229*t1(1)*t1(2)) - (28.4*t1(2)*t1(3)) – (0.0037*t1(1)*t1(3)) – (0.2078*t1(1)*t1(2)^2) –(0.1220*t1(1)*t1(3)^2) + (0.000027*t1(2)*t1(1)^2) + (30.5*t1(2)*t1(3)^2) + (0.000062*t1(3)*t1(1)^2) + (161*t1(3)*t1(2)^2) – (0.0220*t1(1)*t1(2)*t1(3))
(4.1)
Where t1(1) denotes the machining speed, t1(2) denotes the feed and t1(3) denotes the depth of cut during the machining operation. By analyzing the coefficients of each input parameters the feed is contributing more influence on the surface roughness comparing to the other two input variables speed and depth of cut.
V.OPTIMIZATION TECHNIQUES ADOPTED
2108 | P a g e
to be improved further with convergence of mean error value is 0.0002476 which projects the enhanced results. On performing the simulation with this modified approach the results are found to be further tuned. The mean error comparison between each pahase of the method is focuesd through the Table 5.1 to Table 5.6.
Table 5.1 Surface roughness value for the 11 steps of feed, depth of cut for the speed 265 rpm
Doc 0.06 0.066 0.072 0.078 0.084 0.09 0.096 0.102 0.108 0.114 0.12 feed 1 feed 2 feed 3 feed 4 feed 5 feed 6 feed 7 feed 8 feed 9 feed 10 feed 11 0.1 0.307 0.307 0.310 0.337 0.360 0.316 0.334 0.341 0.317 0.374 0.309 0.11 0.288 0.342 0.306 0.307 0.311 0.314 0.291 0.277 0.348 0.300 0.376 0.12 0.310 0.305 0.306 0.305 0.298 0.311 0.324 0.321 0.316 0.381 0.313 0.13 0.316 0.311 0.307 0.340 0.323 0.337 0.331 0.318 0.367 0.316 0.382 0.14 0.320 0.317 0.306 0.322 0.303 0.347 0.322 0.372 0.325 0.386 0.323 0.15 0.371 0.321 0.310 0.290 0.327 0.313 0.352 0.326 0.380 0.327 0.391 0.16 0.331 0.298 0.347 0.374 0.348 0.380 0.348 0.389 0.338 0.398 0.334 0.17 0.401 0.325 0.371 0.360 0.369 0.349 0.377 0.342 0.400 0.339 0.406 0.18 0.336 0.379 0.397 0.411 0.371 0.405 0.369 0.410 0.352 0.415 0.421 0.19 0.371 0.352 0.405 0.363 0.421 0.363 0.421 0.358 0.424 0.437 0.425 0.2 0.411 0.385 0.437 0.452 0.417 0.441 0.398 0.434 0.452 0.435 0.477
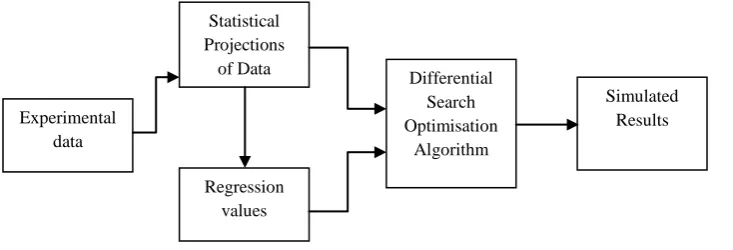
The pictorial representation of the newly proposed method is shown in Fig. 5.1.
Figure 5.1 Block diagram of Hybridization of Regression in Differential Search Algorithm
Table 5.2 Surface roughness value for the 11 steps of feed, depth of cut for the speed 282.5 rpm
Doc 0.06 0.066 0.072 0.078 0.084 0.09 0.096 0.102 0.108 0.114 0.12 feed 1 feed 2 feed 3 feed 4 feed 5 feed 6 feed 7 feed 8 feed 9 feed 10 feed 11 0.1 0.303 0.314 0.315 0.345 0.301 0.320 0.304 0.309 0.355 0.304 0.372 0.11 0.309 0.312 0.312 0.314 0.320 0.320 0.325 0.336 0.295 0.374 0.306 0.12 0.303 0.315 0.343 0.283 0.360 0.325 0.369 0.321 0.383 0.315 0.388 0.13 0.276 0.290 0.348 0.318 0.337 0.321 0.317 0.358 0.317 0.385 0.319 0.14 0.328 0.297 0.335 0.295 0.336 0.318 0.358 0.329 0.387 0.325 0.394 0.15 0.297 0.310 0.329 0.317 0.303 0.342 0.329 0.373 0.328 0.394 0.329 0.16 0.370 0.330 0.378 0.339 0.373 0.346 0.380 0.343 0.398 0.335 0.404 0.17 0.314 0.370 0.350 0.360 0.345 0.362 0.343 0.392 0.340 0.408 0.339 0.18 0.397 0.372 0.402 0.363 0.394 0.369 0.402 0.356 0.412 0.407 0.418 0.19 0.396 0.416 0.393 0.411 0.357 0.402 0.362 0.417 0.418 0.424 0.438 0.2 0.367 0.387 0.432 0.407 0.432 0.406 0.429 0.436 0.430 0.454 0.434
2109 | P a g e
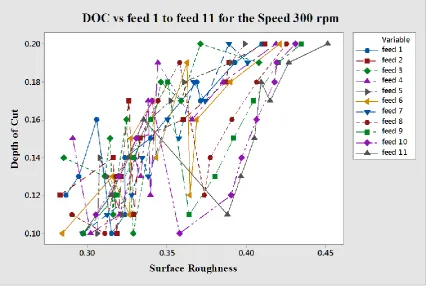
Table 5.3 Surface roughness value for the 11 steps of feed, depth of cut for the speed 300 rpm
Doc 0.06 0.066 0.072 0.078 0.084 0.09 0.096 0.102 0.108 0.114 0.12 feed 1 feed 2 feed 3 feed 4 feed 5 feed 6 feed 7 feed 8 feed 9 feed 10 feed 11 0.1 0.315 0.319 0.329 0.302 0.307 0.284 0.297 0.311 0.297 0.358 0.297 0.11 0.324 0.329 0.316 0.320 0.322 0.327 0.313 0.290 0.364 0.305 0.388 0.12 0.286 0.283 0.317 0.340 0.317 0.365 0.328 0.374 0.319 0.390 0.315 0.13 0.295 0.322 0.311 0.334 0.312 0.316 0.338 0.318 0.380 0.320 0.396 0.14 0.324 0.316 0.285 0.330 0.308 0.344 0.334 0.377 0.330 0.397 0.326 0.15 0.340 0.333 0.314 0.291 0.333 0.327 0.358 0.333 0.392 0.331 0.405 0.16 0.306 0.361 0.325 0.366 0.339 0.369 0.351 0.391 0.340 0.407 0.336 0.17 0.371 0.326 0.359 0.338 0.352 0.341 0.374 0.344 0.405 0.341 0.415 0.18 0.369 0.387 0.346 0.385 0.361 0.390 0.367 0.407 0.351 0.418 0.409 0.19 0.393 0.389 0.408 0.344 0.391 0.363 0.401 0.358 0.420 0.419 0.427 0.2 0.410 0.412 0.371 0.419 0.399 0.421 0.389 0.425 0.435 0.431 0.451
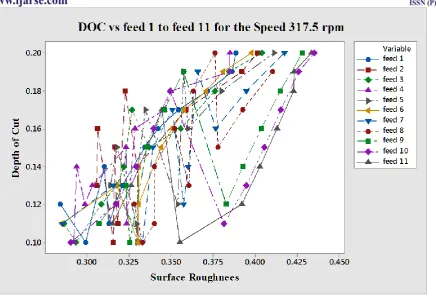
Table 5.4 Surface roughness value for the 11 steps of feed, depth of cut for the speed 317.5 rpm
Doc 0.06 0.066 0.072 0.078 0.084 0.09 0.096 0.102 0.108 0.114 0.12 feed 1 feed 2 feed 3 feed 4 feed 5 feed 6 feed 7 feed 8 feed 9 feed 10 feed 11 0.1 0.299 0.316 0.294 0.292 0.330 0.330 0.333 0.333 0.326 0.290 0.355 0.11 0.313 0.318 0.286 0.324 0.330 0.285 0.286 0.340 0.307 0.381 0.315 0.12 0.284 0.317 0.309 0.299 0.354 0.331 0.358 0.328 0.383 0.318 0.392 0.13 0.321 0.306 0.318 0.303 0.314 0.318 0.316 0.361 0.323 0.395 0.326 0.14 0.310 0.330 0.322 0.294 0.330 0.331 0.360 0.340 0.393 0.330 0.403 0.15 0.334 0.317 0.337 0.324 0.318 0.344 0.339 0.378 0.336 0.405 0.336 0.16 0.342 0.306 0.356 0.329 0.360 0.351 0.377 0.352 0.404 0.340 0.413 0.17 0.354 0.359 0.327 0.346 0.335 0.358 0.351 0.393 0.346 0.415 0.345 0.18 0.372 0.323 0.376 0.350 0.380 0.371 0.395 0.363 0.415 0.350 0.423 0.19 0.386 0.392 0.384 0.385 0.358 0.381 0.366 0.411 0.357 0.426 0.423 0.2 0.388 0.402 0.404 0.385 0.411 0.398 0.417 0.376 0.428 0.435 0.434
Table 5.5 Surface roughness value for the 11 steps of feed, depth of cut for the speed 370 rpm
2110 | P a g e
Table 5.6 Surface roughness value for the 11 steps of feed, depth of cut for the speed 440 rpm
Doc 0.06 0.066 0.072 0.078 0.084 0.09 0.096 0.102 0.108 0.114 0.12 feed 1 feed 2 feed 3 feed 4 feed 5 feed 6 feed 7 feed 8 feed 9 feed 10 feed 11 0.1 0.165 0.251 0.267 0.276 0.283 0.289 0.297 0.299 0.299 0.297 0.291 0.11 0.258 0.271 0.283 0.294 0.304 0.311 0.271 0.295 0.319 0.338 0.351 0.12 0.277 0.290 0.305 0.312 0.287 0.304 0.315 0.319 0.317 0.315 0.314 0.13 0.297 0.309 0.321 0.331 0.339 0.345 0.347 0.351 0.301 0.319 0.335 0.14 0.312 0.323 0.336 0.345 0.307 0.325 0.345 0.363 0.375 0.378 0.376 0.15 0.329 0.342 0.353 0.362 0.367 0.374 0.379 0.382 0.383 0.333 0.346 0.16 0.296 0.355 0.315 0.328 0.342 0.357 0.373 0.390 0.403 0.410 0.409 0.17 0.358 0.366 0.377 0.386 0.391 0.400 0.404 0.406 0.411 0.354 0.365 0.18 0.323 0.331 0.346 0.359 0.372 0.387 0.400 0.413 0.423 0.428 0.427 0.19 0.382 0.392 0.399 0.407 0.415 0.421 0.365 0.368 0.372 0.377 0.386 0.2 0.344 0.359 0.372 0.383 0.395 0.407 0.418 0.428 0.435 0.439 0.438 To view the results for future references and guideline as ready reckoner to the manufacturers the graphical representation of the results are exhibited in Figure 5.2 to Figure 5.7.
2111 | P a g e
Figure 5.3 Surface roughness - DOC Vs all feed range for the speed of 282.5 rpm
2112 | P a g e
Figure 5.5 Surface roughness - DOC Vs all feed range for the speed of 317.5 rpm
2113 | P a g e
Figure 5.7 Surface roughness - DOC Vs all feed range for the speed of 440 rpm
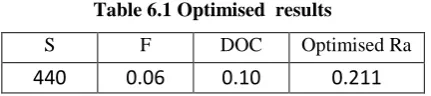
The optimal combination of process parameters towards the minimum surface roughness 0.211μm is 440 rpm speed, 0.06 mm / rev feed and 0.10 mm / min depth of cut.
VI. CONCLUSIONS
Third order regression relationship between input variables (machining speed, feed, depth of cut) and output variable (surface roughness) is exhibiting the statistical significance and found to be fit. The best subset analysis between the individual and combination of the machining parameters and the coefficients of each input parameters reveals that the feed is influencing highly on the surface quality comparing to the other input variables. Regression relationship integrated DSA optimisation method converges with further minimum mean error with regards to this analysis. The optimised result for this experiment is tabulated in Table 6.1.
Table 6.1 Optimised results
S F DOC Optimised Ra
440
0.06
0.10
0.211
2114 | P a g e
as the input values for compiling. By selecting the steps value much closer leads to get smoother curve fittings for references. Attempts may be exercised with other familiar accepted optimisation algorithms.
REFERENCES
[1] Nikolaos, Galanis, E. Dimitrios and Manolakos, Surface roughness prediction in turning of femoral head, Int J Adv Manuf Technol, 51, 2010, 79-86.
[2] Palanikumar,K., Karunamoorthy, L.,Karthikeyan,R., &Latha, B. Optimization of machining parameters in turning GFRP composites using a carbide (K10) tool based on the Taguchi method with fuzzy logics, Metals and Materials International, 12(6),2006, 483-491.
[3] Srikanth,T.,&SrikanthK.V. A real coded genetic algorithm for optimization ofcutting parameters in turning. International Journal of Computer Science and Network Security, 8(6),2008, 189–193.
[4] Suhail AH, Ismail N, Optimization of cutting parameters based on surface roughness and assistance of workpiece surface temperature in turning process. Amer J Eng Appl Sci 3(1), 2010, 102–108.
[5] Raj,T. G.A.,&Namboothiri, V.N.N. (2010).Animproved genetic algorithm for the prediction of surface finish in dry turning of SS 420 materials. Manufacturing Technology Today, 47, 2010, 313-324.
[6] Al-Ahmari AMA, Predictive machinability models for a selected hard material in turning operations. J Mater Process Technol 1(190), 2007, 305–311.
[7] Park, S. H., Robust Design and Analysis for Quality Engineering.London:Chapman & Hall, 1996.
[8] Ranjit, R., Design of Experiment Using the Taguchi Approach.New York:John Wiley & Sons Inc, 2001.
[9] Phadke, M.S., Quality Engineering Using Design of Experiment, Quality Control, Robust Design, 1998.
[10]Azouzi R, Guillot M, On-line prediction of surface finish and dimensional deviation in turning using neural network based sensor fusion. Int J Mach tools Manuf 37(9), 1997, 1201–1217.
[11]Banerjee A, Bordatchev EV, Choudhury SK, On-line monitoring of surface roughness in turning operations with optoelectrical transducer. Int J Manuf Res 4(1), 2009, 57–73.
[12]Bajic D, Lela B, Zivkovic D, Modeling of machined surface roughness and optimization of cutting parameters in face milling. Metalurgija 47(45), 2008, 331–334.