SIMULATION OF TURBULENT FLOW THROUGH INLET 37-ELEMENT
CANDU
FUEL BUNDLES WITH ANGULAR MISALIGNMENT
A. Bhattacharya1, S. D. Yu2, G. Kawall2
1PhD Student, Ryerson University, Department of Mechanical and Industrial Eng., Toronto, CANADA - M5B 2K3 2Professor, Ryerson University, Department of Mechanical and Industrial Eng., Toronto, CANADA - M5B 2K3
E-mail of corresponding author: [email protected]
ABSTRACT
Three-dimensional turbulent flow through inlet 37-element CANDU fuel bundles with angular misalignment in the bundle interface is studied using the large eddy simulation (LES) scheme. To understand the flow and flow-induced unsteady forces on the inlet bundles, two CFD models consisting of a pipe flow region, the endplate subchannels, and the bundle subchannels for the one and half bundles with and without angular misalignments in the bundle-to-bundle interface, is developed. The demand for speedy computations is met through parallel processing on a network of 36 high performance supercomputers. From the computational results, the presence of vortices after the inlet and the interface endplate regions is observed with the misaligned model producing stronger wakes compared to the aligned situation. The mean fluid lifting force acting on the inlet bundle increases by more than one order of magnitude compared to the situation with perfectly aligned bundles.
INTRODUCTION
The wear on the pressure tube inner surfaces, observed in CANDU nuclear reactors, has been an interest to the Canadian nuclear industry for decades. Investigation carried out in the 1990’s revealed that the fretting marks or wear were caused by the relative movement of fuel bundles at the bearing pad locations ( [1]- [3]). The degree of wear on the pressure tube wall decreases from the upstream to the downstream. The most significant wear occurs at the inlet bundle. Since wear and fretting marks affect the pressure tube integrity, there is a growing interest in the Canadian nuclear industry to investigate this fuel bundle vibration induced by the coolant flow. Yetisir and Fisher [4] reported that the turbulent parallel flow inside the bundle subchannels alone cannot produce the required level of bundle vibration and work-rate for the observed fretting marks on the pressure tube surface. This encouraged further research for an in-depth understanding on the flow induced vibration mechanisms in CANDU fuel bundles, which, as of today, has not been established.
Chang and Tavoularis [5] investigated the flow of air inside a sector of parallel rods simulating fuel elements for a 37-element bundle without endplates and observed that the flow through the subchannels contained large-scale coherent structures affecting the local velocity fluctuations. Abbasian et al. [6], in another work on a simulated 43-element fuel bundle with endplates, found that the flow through a set of parallel elements with endplates is significantly different compared to the flow through the same set of endplate-free elements. In an experimental study by Bhattacharya et al. [7] on a simulated 43-element bundle, it has been reported that the bundle vibrates laterally due to cross-flow around the entrance region. Zhang and Yu [8], in a more recent study on two inlet 43-element simulated bundles, observed that endplates are the major source of fluid excitations in a fuel bundle structure. They also reported that both the entrance and the bundle-to-bundle interface regions play significant role in producing bundle lateral vibration. Unsteady three-dimensional flow problems have been solved using the Unsteady Reynolds Averaged Navier-Stokes (URANS) [5], LES [6], and others. The documented evidence of computational efficiency and accuracy for complex unsteady flow problems has made LES a good alternative to URANS and other schemes [9].
In CANDU reactors, a string of 12 fuel bundles are placed horizontally one against another inside a pressure tube for a fuel channel. The bearing pads on the outer fuel elements at several axial locations for a bundle are designed to contact the pressure tube wall and support the bundle weight. During refueling, the fuel bundles tend to rest with different angular positions. As a result, there exists a chance of misaligned orientations in the bundle-to-bundle interface regions formed by two neighboring bundle-to-bundles. In this paper, two CFD models are developed to study the effect of the bundle misalignment on the flow and flow induced excitations for the two inlet bundles. Numerical solutions to the bundle subchannel flow problem are obtained using the LES technique with the Smagorinsky
grid scale (SGS) model [10]. The LES scheme used in the current work is examined by comparing it to the work done by Chang and Tavoularis [5] for a sector of a 37-element CANDU fuel bundle.
DESCRIPTION OF THE COMPUTATIONAL MODEL
Flow Domain
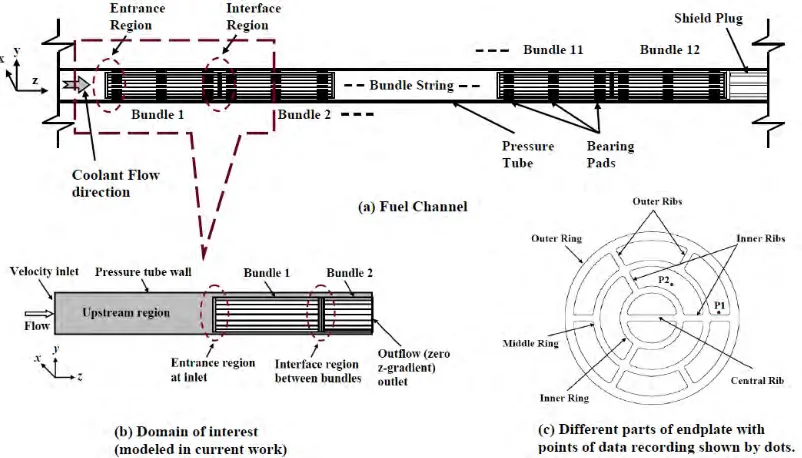
A fuel channel showing the fuel bundle string is illustrated in Fig. 1(a) with the flow direction and other fuel channel components. A 37-element CANDU reactor consists of hundreds of fuel channels each containing a string of fuel bundles inside the pressure tube. The zone of interest for the present study has been indicated by the zoomed view from the bundle string, as shown in Fig. 1(b). The flow domain, considered for the current study, consists of a pipe region of 6D in length (D being the inner diameter of the pressure tube), all endplate subchannel regions formed by rings and ribs, all bundle subchannel regions formed by fuel element outer surfaces, and finally the gap subchannel regions formed between the outer fuel element surfaces and the pressure tube inner surface. In a 37-element CANDU fuel bundle, two identical endplates having three circular rings held by ribs between neighboring rings ( Fig. 1(c)), are welded at the ends of all fuel elements to configure an integral bundle structure. A computational model is developed for the above-mentioned fluid domain using GAMBIT and FLUENT to simulate the entrance flow, the bundle flow and the interface flow through the inlet fuel bundles in a fuel channel.
Fig. 1. Fuel channel with string of bundles and the zone for the computational model shown by a zoomed view; also shown, the side view of an endplate with its components and points of interests considered for numerical analysis.
Domain Discretization and Interface Alignment
The domain of the whole computational model is discretized into several flow segments, as shown in Fig. 2. The entire computational domain consists of unstructured meshes of approximately 7.7 x 10⁶ cells with different
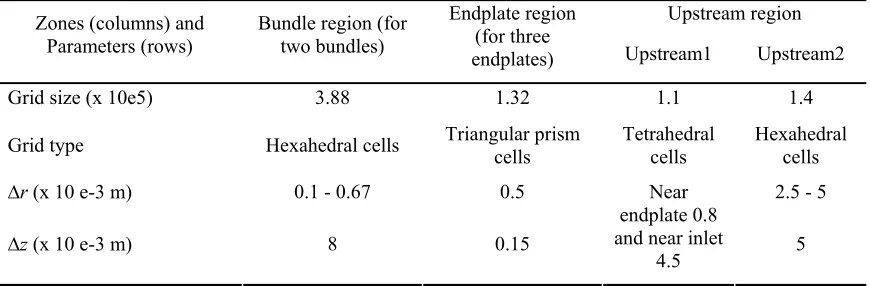
segments connected to each other by non-conformal mesh interfaces. Since the accuracy of the LES technique is primarily dependent on the size and quality of the meshes, the whole domain is discretized using an adequately fine mesh distribution, with the thickness of the first layer of cells near the walls restricted to a very low value to ensure the non-dimensional distance from the wall to the first grid point, y+, equals 1 on most surfaces. Table 1 shows more details on the mesh distribution of the grid, both in the radial (∆r) and axial (∆z) directions. The time step size in this study is chosen to be 510-5 s, which is less than the large eddy turn-over time of 2.410-4 s. The mean axial
flow velocity of 2.4 m/s is considered at the inlet which corresponds to an average velocity of 6 m/s through bundle subchannels and a Reynolds number of about 4.86104. The length of the second bundle region is considered only
where it has been observed that the three dimensional flow recovers to straight channel flow with no significant velocity and pressure gradients beyond the bundle midplane.
Fig. 2: Illustration of meshing scheme.
Table 1. Mesh details at different regions of the flow domain.
Upstream region Zones (columns) and
Parameters (rows) Bundle region (for two bundles)
Endplate region (for three
endplates) Upstream1 Upstream2
Grid size (x 10e5) 3.88 1.32 1.1 1.4
Grid type Hexahedral cells Triangular prism cells Tetrahedral cells Hexahedral cells
∆r (x 10 e-3 m) 0.1 - 0.67 0.5 2.5 - 5
∆z (x 10 e-3 m) 8 0.15
Near endplate 0.8 and near inlet
4.5 5
The present study deals with the interface between two bundles, and therefore, two separate models have been developed, one with a fully aligned interface and another with a 30o misalignment. The choice of this angle is
determined from a comparative study which indicates that, for this misalignment, minimum possible overlapping can occur between the components of the two bundles, i.e., the endplate ribs/rings and the bundle elements. Therefore, for this configuration, maximum obstruction to the flow passing through this interim region between bundles can be attained, producing higher lateral fluid forces. In Fig. 3, the overlapping in the interface region after misaligning the second bundle by 30o counterclockwise is shown; the effective flow area is reduced considerably at
Boundary and Operating Conditions
Since the mean axial flow is known a priori at the inlet cross-section, this face is defined as the velocity inlet. The length of the upstream pipe flow region is kept equal to 6D for the flow to be fully developed before it reaches the inlet bundle. To simulate a fully developed flow, the outlet surface of the second bundle is specified as the outflow, which defines zero z-gradient of flow parameters on that surface. All the outer walls of all the elements and the inner wall of the tube surrounding the bundle are defined as walls with the no-slip condition, as shown in Fig. 1 (b). For the present model, pressurized (10 MPa) and high temperature (300oC) water is considered as the
fluid to simulate operating conditions in-situ.
Solution Scheme and Computational Resource
As mentioned earlier, the LES technique is applied to solve three-dimensional filtered unsteady N-S equations. The description of the classical filters used in LES, as well as other details, is out of the scope of this article and can be found in any text book on LES, e.g., [11]. However, it can be said that, in the LES scheme, the filtered N-S equations are solved in such a way that eddies larger than the filter size, responsible for the transport of most of the momentum and energy, are computed directly, while eddies smaller than the filter size are modeled implicitly.
The numerical solution is obtained for the three dimensional turbulent flow through the inlet CANDU fuel bundle subchannels using a cluster of supercomputers, in conjunction with a parallel processing scheme. A steady state solution is sought using the k- method, at the beginning, and this converged solution is then used as the initial condition to obtain a subsequent unsteady solution with the LES technique.
VALIDATION OF NUMERICAL PROCEDURE
The numerical technique used in the present study has been examined by comparing it with the solution of the numerical study performed by Chang and Tavoularis [5], where they modeled a one sixth sector of the full cross section of a 37-element CANDU fuel bundle with air as the fluid; the validated numerical scheme is then implemented for the large model considered in the present work.
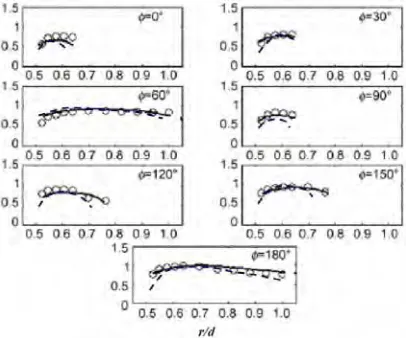
To achieve this, a computational model is developed with the same geometrical shape and dimensions as in [5], having water as the fluid with an equal Reynolds number condition. Periodic boundary conditions are employed on the two radial boundaries. However, the velocity is specified at the inlet; at the outlet, the outflow boundary condition is defined, conforming to the fact that the flow becomes fully developed at that cross-section. The time-averaged stream-wise velocities (Ū/Ūmax) around the outer-middle element in a 60o sector are obtained for this model using the LES technique and compared in Fig. 4 with the experimental and numerical results of Chang and Tavoularis [5] for a range of r/d ratios and values, where r is the local radial co-ordinate, d is the element diameter and is the local orientation angle. A detailed investigation of the results indicates that, except for = 120o at higher r/d ratios, where a small under-prediction is observed, good agreement is obtained.
RESULTS AND DISCUSSIONS
This section describes and analyses various data obtained from the simulation run. For all contours within a cross section normal to the flow, the figures are taken as viewed from the upstream towards the downstream. Data presented in this section are for a duration of 0.4 s (between 0.1 s and 0.5 s solution time) for the case of 2.4 m/s mean flow velocity.
Velocity Analysis
Velocity contours are provided for y-velocity components which are responsible for the lift force on the bundle. It is important to mention here that, although flow contours vary with time considering the unsteady nature of the flow, the pattern of the distribution remains similar with time.
Y-Velocities
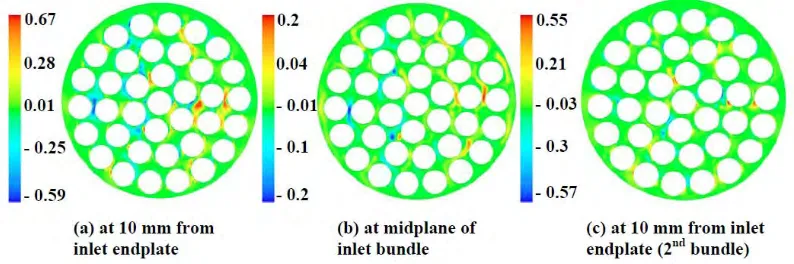
For each of Fig. 5 (a) and Fig. 5 (b), the contour plot is distributed in such a way that the right and left sides show flow through subchannels with positive and negative velocities, respectively; therefore, the local maxima and the minima are distributed on opposite sides of the bundle vertical axis. Although for Fig. 5 (c) this distribution is not so clear, velocities of higher amplitude are observed around locations right after the endplate. Another important observation is that only the midplane of the first bundle displays significantly smaller y-velocities, meaning the fluid flow recovers almost to a parallel subchannel flow at the midplane of the bundle, and the lateral velocity components are stronger around the entrance and the interface region only.
Fig. 5: Contours of y-velocity normalized by corresponding mean axial flow velocity at different axial locations for mean flow velocity of 2.4 m/s.
Static Pressure Analysis
Fig. 6. Contours of static pressure (x104 Pa) at different axial locations for mean flow velocity of 2.4 m/s.
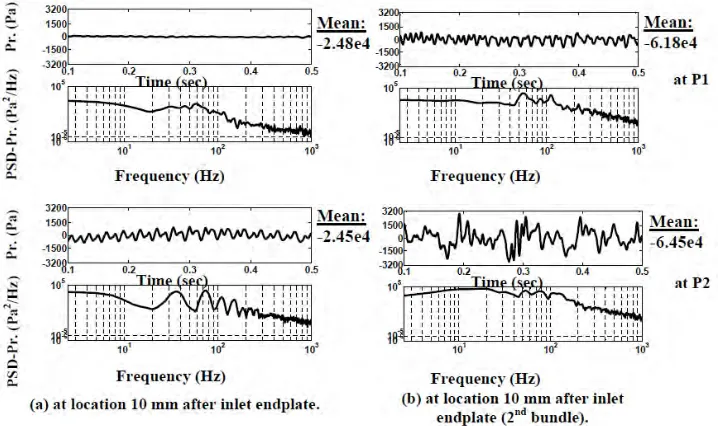
Fig. 7. Time histories and PSDs of fluctuations of static pressure at different point locations for mean flow velocity of 2.4 m/s.
Effect of Misalignment
A detailed study on the effect of the interface misalignment between two bundles is very much of interest in the present work. To address this, pathlines and lift forces are compared between aligned and misaligned situations, and the results from the numerical solution for these two cases are elaborated and discussed in the following sections.
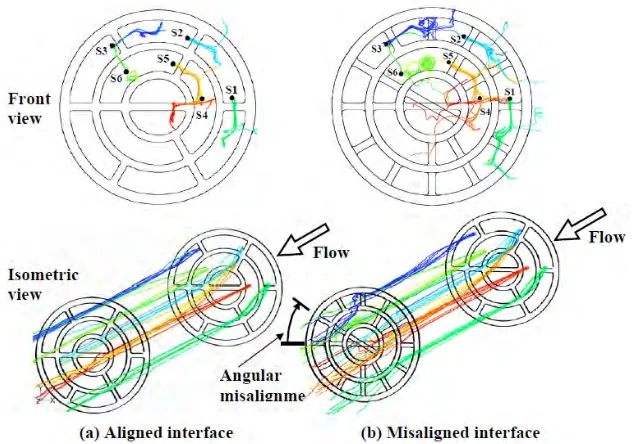
Flow Pattern Shown by Pathlines
misaligned interface case develop significant wakes due to shedding near the entrance and the bundle-to-bundle interface regions, as shown in the isometric views in Fig. 8.
Fig. 8. Pathlines showing development of fluid flow with sources indicated by black dots when viewed from downstream side for aligned and misaligned interfaces.
Fluid Forces
Time histories and PSDs of the y-force (Fy) for the inlet bundle considering aligned as well as misaligned interfaces are examined here. From Fig. 9 (a), the lift force (Fy) has a mean and rms (root mean square) value of 0.25 N and 0.63 N, respectively, with the dominant frequencies spread over around 60 Hz. It can be seen from Fig. 9 (b) that the mean, rms and also the range of fluctuations are increased significantly for the misaligned interface condition. However, the distribution of the energy is concentrated around frequencies of 60 Hz, 100 Hz and 130 Hz. Another very important finding, which can be obtained from Fig. 9, is that the lift force for the misaligned interface case has mean and rms values of 6.12 N and 6.22 N, respectively, which are more than one order of magnitude higher compared to the values for the aligned case. Therefore, the inlet bundle experiences a fluid force in the lift direction one order of magnitude more compared to that in case fully aligned situation.
CONCLUSIONS
Two CFD models were developed to investigate the effect of bundle angular misalignment on the flow and flow induced excitation for the inlet fuel bundles. It was found that the flow in the vicinity of the interface region is more like cross-flow. This signifies the importance of modeling the interface region for capturing the unsteady excitations. Numerical results reveal that modeling the bundle-to-bundle interface flow in addition to the entrance and the bundle subchannel flow is more important in order to predict the correct fluid forces on the bundle. The lift force, responsible for bundle vertical movement inside the pressure tube, increases by one order of magnitude due to the misaligned bundles. This paper presents a successful application of CFD to a practical engineering problem. With the advances in CFD technology, complicated problems can be interpreted without performing experiments on a large scale. It also provides insight regarding the fluid excitations on the fuel bundle, which would be expensive and time consuming for experimental investigations. The outcomes of the current research will help predict the flow-induced vibrations of fuel bundles and pressure tube wear.
ACKNOWLEDGEMENTS
The authors are pleased to acknowledge Hartmut Schmider and Chris MacPhee of High Performance Computing Virtual Laboratory (HPCVL) for their valuable assistance in parallel processing. Acknowledgements are due to the Natural Sciences and Engineering Research Council of Canada (NSERC) and SNC-Lavalin Nuclear Inc. for providing funding for the present study through a collaborative research and development grant. Technical help from Dr Xuan Zhang in preparing the manuscript is also gratefully acknowledged.
REFERENCES
[1] Judah, J., “Overview of fuel inspections at the Darlington nuclear generating station”, Proceedings of the annual conference - Canadian Nuclear Association, pp. 3.1-22, 1992.
[2] Norsworthy, A. G., Field, G. J., Meysner, A., Dalton, K., and Crandell, A., “Fuel Bundle to Pressure Tube Fretting in Bruce and Darlington Reactors”, Proceedings of the 15th Annual Canadian Nuclear Society Conference, 2-2, 1994.
[3] Stewart. W., B., “Darlington NGS Unit 2 Fuel Damage Investigation”, Proceedings of the 13th Annual Canadian Nuclear Society Conference, Saint John, June, 1992.
[4] Yetisir, M., Fisher, N.J., “Prediction of pressure tube fretting-wear damage due to fuel vibration”, Nuclear Engineering and Design, Vol. 176, 1997, pp. 261-271.
[5] Chang, D., Tavoularis, S., “Numerical simulation of turbulent flow in a 37-rod bundle”, Nuclear Engineering and Design, Vol. 237 (6), 2007, pp. 575-590.
[6] Abbasian, F., Yu, S.D., Cao, J., “Experimental and numerical investigations of three-dimensional turbulent flow of water surrounding a CANDU simulation fuel bundle structure inside a channel”, Nuclear Engineering and Design, Vol. 239 (11), 2009, pp. 2224-2235.
[7] Bhattacharya, A., Yu, S. D., Kawall, G., "An experimental investigation of flow-induced vibration of a 43-element simulation CANDU fuel bundle under confined axial flow", Proceedings of the 23rd CANCAM, Vancouver, Canada, June 5-9, 2011.
[8] X. Zhang, S. D. Yu, “large eddy simulation of turbulent flow surrounding two simulated CANDU fuel bundles,” Nuclear Engineering and Design, 2011, in press.
[9] Hassan, Y.A., Barsamian, H.R., “Turbulence simulation in tube bundle geometries using the dynamic subgrid-scale model”, Nuclear Technology, Vol. 128, 1999, pp. 58-74.
[10]Smagorinsky, J. S., “General circulation experiments with the primitive equations, part I: The basic Experiment”, Monthly Weather Review, Vol. 91, 1963, pp. 99-152.