R E S E A R C H
Open Access
Target vibration estimation in SAR based
on phase-analysis method
Weijie Xia
*and Linlin Huang
Abstract
An efficient vibration estimation method for synthetic aperture radar (SAR) systems based on phase-analysis method is presented. Small vibrations, which consist of multiple frequency components and are usually rather weak, introduce phase modulation in radar echoes. They contain important signatures of objects. Extracting and analyzing the phase from radar echoes is one of the significant approaches to acquire vibration characteristics. In order to separate different targets in different range cells, the proposed method acts the range compression and
range migration correction on the radar echoes, followed by extracting the phase history of each target’s radar
echoes. Since the phase history contains the time-varying ranges from the targets to airborne radar besides the vibration signal, we apply wavelet transform to the phase history to extract the vibration signal. Then the vibration signatures would be estimated quantitatively. The method is a more efficient and convenient approach to estimate the vibration amplitudes and frequencies of one or more targets, whose vibration signal is a single-frequency or multi-frequency signal. Moreover, it can be applied in the case where the airborne radar moves along the desirable or undesirable trajectory. Simulation results indicate that this method provides a larger range of estimable vibration frequency, higher estimation precision, and lower computation complexity.
Keywords:Linear frequency modulated (LFM) signal, Phase analysis, Vibration, Wavelet transform (WT)
1 Introduction
Vibration is ubiquitous in the real world. Objects’ vibra-tion signatures bear vital informavibra-tion about the type of the objects [1]. Spaceborne synthetic aperture radar (SAR) can operate over thousands of kilometers, which is an ef-fective way to acquire vibration signatures of structures placed in remote locations. Small vibrations introduce phase modulation in the returned SAR signals, which is often referred to as the micro-Doppler effect [2]. By analyzing the micro-Doppler effect, we can identify and classify the objects according to the vibration signa-tures. In addition, the vibration signatures can be used to compensate the phase errors in SAR returns to elim-inate the image blur [3, 4]. Therefore, target vibration signatures estimation has great significance.
Several methods have been presented in the literature which deal with the problem of how to extract the vibra-tion signature with SAR systems. The phase-modulated
signals induced by vibration with Cohen’s class time-fre-quency method were analyzed, and the time-fretime-fre-quency signatures and the SAR image of a vibrating target were studied in [5–7]. In [8] and [9], the Doppler frequency of the rotating and vibrating targets was analyzed with smoothed pseudo Wigner-Ville distribution. A novel vi-bration estimation method based on the discrete fractional Fourier transform (DFRFT) was presented in [10–12]. The method in [13] with sinusoidal frequency modulation Fourier transform (SFMFT) was proposed to obtain the frequency spectrum of vibration traces. In [14], the tar-get was processing with autofocus to estimate the phase error caused by vibration, and the vibration parameters were calculated based on the phase error. Another extracting method of vibrating features based on slow time envelope (STE) signatures was presented in [15]. In [16] and [17], a micro-Doppler reconstruction method using azimuth time-frequency tracking of the phase his-tory was proposed.
In this paper, a vibration estimation method using SAR is presented based on phase analysis. In comparison with the previous works, our approach differs in two * Correspondence:[email protected]
Key Laboratory of Radar Imaging and Microwave Photonics (Nanjing Univ. Aeronaut. Astronaut.), Ministry of Education, College of Electronic and Information Engineering, Nanjing University of Aeronautics and Astronautics, Nanjing 210016, China
main ways. On the one hand, this method is applicable to the case where a single scatterer vibrating in multiple frequencies and several scatterers distributed in different range cells are placed within a SAR scene. In addition, it is also suitable for the situation where the spaceborne radar moves along the undesirable trajectory. On the other hand, compared to methods which rely on the interpretation of time-frequency representations, the proposed method provides a quantitative estimation of the vibration signatures by offering the history of the instantaneous displacement and the spectrum of the vibrating object. The estimation results contain complete parameters, not only the vibration amplitudes and fre-quencies but also the initial phases included.
The procedure of this method is as follows. It starts with the conventional SAR processing procedure to ob-tain a nonstationary signal from the vibrating target. First, the returned SAR signals are demodulated. Second, range compression is acted on the demodulated SAR echoes, followed by an application of range cell migra-tion correcmigra-tion to range lines. Hence, the signal from a vibrating target is focused on a range line. Since small vibrations modulate the phase in radar echoes, we ex-tract the phase history of each range line containing vibrating objects and also analyze the restrictive con-dition of phase ambiguity. Next, by performing the wavelet transform, the vibration displacement is ac-quired and vibration amplitudes and frequencies of each target are estimated quantitatively. The influence of noises on the performance of the proposed approach is also discussed. The method is capable of extracting vibra-tion signatures in the case where the airborne radar moves along the desirable or undesirable trajectory. Finally, the simulation is given and this method has been compared with other radar-based vibration estimation method. The results illustrate the superior of this method.
The remainder of this paper is organized as follows. In Section 2, the motion model is established and the math-ematical formulas of SAR returns containing vibration sig-natures are derived. In Section 3, the phase-analysis algorithm including phase extraction and wavelet transform is introduced, followed by the discussion related to the signal-to-noise ratio (SNR) in Section 4. Simulations are provided and a comparison between the proposed method and some of others is presented in Section 5. Section 6 gives the conclusion.
2 Signal model
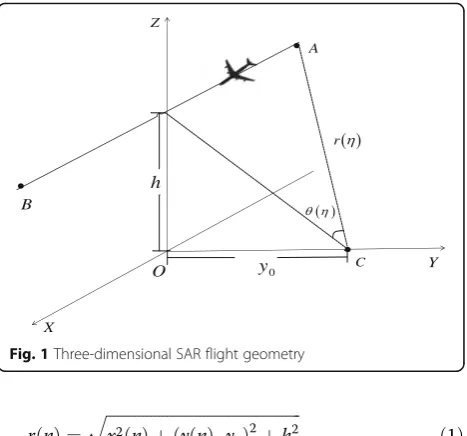
Figure 1 shows a 3-D SAR flight geometry. Aircraft with
the airborne radar sensor flies along the axis OX from
the pointA toB, whose instantaneous location is (x(η), y(η),h), whereηis the azimuth time. The vibrating target is located at the point C (0,y0, 0). The nominal
line-of-sight distance from the target to the radar sensor is
rð Þ ¼η
ffiffiffiffiffiffiffiffiffiffiffiffiffiffiffiffiffiffiffiffiffiffiffiffiffiffiffiffiffiffiffiffiffiffiffiffiffiffiffiffiffiffiffiffiffiffiffiffi
x2ð Þ þη yð Þη−y 0
ð Þ2þ
h2
q
ð1Þ
Letrv(η) denote the projection of the vibration displace-ment onto the line of sight (LOS) from the radar sensor to the target. The instantaneous slant range becomes
Rð Þ ¼η rð Þ þη rvð Þ ¼η rð Þ þη rv0ð Þη ⋅cosθ ηð Þ ð2Þ
where θ(η) is the angle between the instantaneous slant range and the shortest distance from the target to the radar sensor andrv0representsrv(η) forθ(η) = 0. Since
the change of θ(η) is usually small, we obtain that
rv(η)≈rv0(η). ThenR(η) can be approximated by
RðηÞ≈rðηÞ þrv0ðηÞ ð3Þ
Most vibration signals are usually referred to as a peri-odic function, which can be expanded in Fourier series. Any vibration that generated in practice satisfies the Dirichlet conditions, and therefore, the Fourier series of vibration signal is convergent [18]. Consequently, the traces of the vibration can be concluded into a series of periodic sinusoids. Here, we assume that the vibration displacement projected onto LOS is modeled by
rv0ð Þ ¼η
X
i¼1
aisin 2ð πfviηþφiÞ ð4Þ
where ai is the projection of the vibration amplitude
onto LOS,fviis the vibration frequency, andφiis the ini-tial phase of the vibration signal.
Consider a side-looking strip-mode SAR, whose transmitting waveform is a chirp signal, with carrier
frequency f0 and chirp rate Kr. Each returned SAR
pulse is demodulated by the transmitting signal delayed appropriately by the round-trip time to the center of the illuminated patch. A demodulated pulse of a single point target can be written as [19]
A
B
C
h
Z
O
X
Y 0
y
r
s0ðτ;ηÞ ¼A0wr τ−
whereA0is a complex constant, denoting the reflectivity
of the target,cis the propagation speed of the pulse,τis the range time,ηcrepresents zero Doppler time, wr[•] is the envelope of the pulse, usually approximated as a rectangular window andwa[•] is the radiation pattern of the radar antenna. If there are more than one point targets, the SAR returns become
s0ðτ;ηÞ ¼
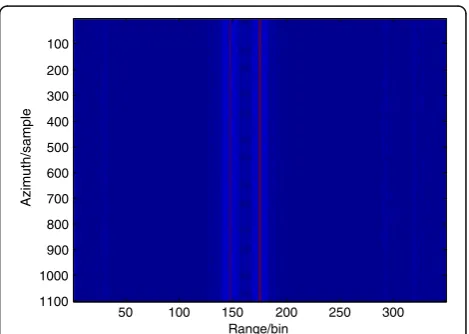
According to (3), (4), and (6), we know that the small range perturbation of vibrating targets modulates the phase term in radar echo, which is referred to as the micro-Doppler effect. Figure 2 shows a reconstructed SAR image of a vibrating target. Due to the micro-Doppler effect, azimuth compression cannot focus the vibrating scatterer on the correct cross-range position, with some significant sidelobes nearby, which is com-monly called ghost targets [20]. Consequently, we can extract some information related to micro-motion by analyzing the phase of the SAR returns.
3 Algorithm
3.1 Phase extraction
Range compression is applied to the SAR returned signal to separate the scatterers in range. By performing the
matching filtering in frequency domain, we get the result of the range compression
srcðτ;ηÞ ¼ tion correction algorithm can be applied to (7) to correct for range cell migration, the signal becomes
src0ðτ;ηÞ ¼
where R0n is the distance from nth point target to the midaperture. Now, the range-compressed phase history of one point target is in the same range cell. The phase of the range line containingnth target can be solved by
ϕnð Þ ¼η arg½srcnʼðτ;ηÞjτ¼2R0n=c ð9Þ
i.e.,
ϕnð Þ ¼η −4πf0Rnð Þη =c ð10Þ
Figure 3 shows the range lines of two vibrating targets, which can be obtained by applying range compression and range migration correction to the SAR returns. The two point targets are separated in range.
Since the measured phase is limited only between −π
and π, the phase ambiguity occurs when some values of the real phase−4πf0Rn(η)/care over this range. The phase total shift between the measured phase and the real phase is ntimes of 2π, wherenis an integer to be determined. Fortunately, this can be corrected by comparing the
Range/bin
Fig. 2SAR image of a vibrating point target
Range/bin
adjacent samples. Supposing the maximal real phase
difference between adjacent samples is below π, a
so-lution of the phase revising function is
prðηkÞ ¼
where pr(ηk) is the phase total shift between the real
phase and measurements atkth azimuth time. Thus, the
revised phase can be expressed as
ϕn0ðηÞ ¼ϕnðηÞ þprðηÞ ð12Þ
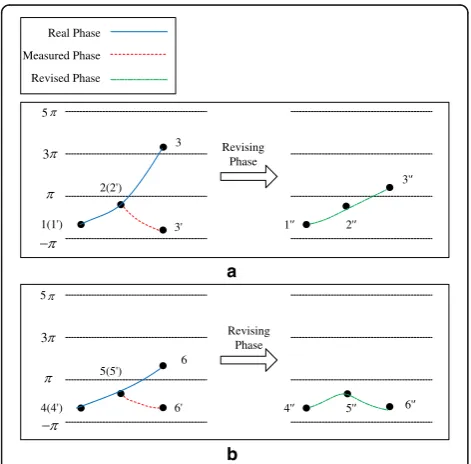
However, the discrete signal is subjected to a problem. If the real phase difference between adjacent samples is greater than π, we cannot acquire the correct real phase by above phase-revising method. For example, in one case, if the adjacent samples’ real phase difference is greater than 2π, like point 2 and 3 in Fig. 4a, the phase shift be-tween the real phase and the measured phase of point 3 is
also larger than 2π (actually the phase shift equals 4π
here). By applying the above method, we only add 2πto
the measured phase (point 3') to obtain the revised phase (point 3 ''), which is not equal to the real phase (point 3). In another case, as shown in Fig. 4b, the adjacent samples’ real phase, like point 5 and 6, whose difference is smaller than 2πbut larger thanπ, so that the phase difference be-tween their measured phase (point 5 ' and 6 ') is belowπ. With application of the above phase-revising method, the
revised phase (point 6 '') is equal to the measured phase (point 6 '), but not the real phase (point 6). In order to avoid the occurrence of the above, we need to increase pulse repetition frequency (PRF) to make sure that the real
phase difference between adjacent samples is below π.
Therefore, the limitation of PRF has to be addressed here. First, we consider the situation where the airborne radar moves in a straight line at a constant speed, and suppose that there is only one vibrating target whose vibration displacement along the direction of radar in-cidence is asin(2πfvη). Let fprf denote PRF, and the sampling interval of slow time is
Δη¼1=fprf ð13Þ
Since the maximal phase difference between adjacent samples is always occurred where the slope of vibration displacement is maximal, it can be expressed as
Δϕmax¼
According to Nyquist sampling theorem, PRF must be larger than 2fv. And for the vibration amplitude meets a> 0, arcsin c
8af0
should be satisfied as 0<arcsin
c
8af0
<π 2.
Then, we take another situation into account. The air-borne radar does not simply move in a straight trajec-tory, while it flies with a velocity vY, which is a velocity along axis OY, that leads to the slant rangeR(η) fluctuat-ing with azimuth time. The range of fluctuation is much larger than vibration amplitude so that we can only take fluctuation into consideration. In this case, the maximal phase difference between adjacent samples becomes
Δϕmax¼
4πf0j jvY max⋅Δη
c ð16Þ
According toΔϕmax<πand (13), we can get the
limit-ing condition of PRF
fprf >
4f0j jvY max
c ð17Þ
3.2 Wavelet transform
Compared to Fourier transform, wavelet transform (WT) is a local transform in time and frequency domain, which
1(1')
can be used to extract information from signal effectively. Wavelet transform makes a multi-scale analysis of func-tions or signals by expansion, translation operafunc-tions, so that some characteristics can be fully highlighted. It is known as mathematical microscope.
According to (10), the phase of the range line is
−4πf0Rn(η)/c, which can be written in
ϕnð Þ ¼η −4πf0ðrð Þ þη rv0ð ÞηÞ=c ð18Þ
This expression demonstrates that the phase of the range line is the sum of two parts:−4πf0⋅r(η)/c, which is
linear proportional to the nominal line-of-sight distance from the target to the radar sensor and −4πf0⋅rv0(η)/c.
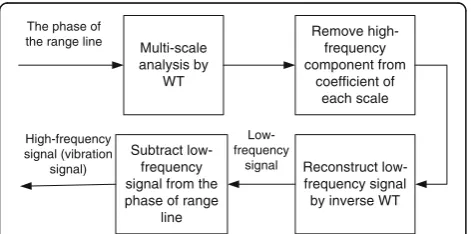
The former varies slowly with azimuth time referred to as a low-frequency signal. The latter induced by vibration is equivalent to a high-frequency signal. Here, we extract the low-frequency signal from the phase of range line by wavelet transform, and the remaining high-frequency sig-nal is the vibration sigsig-nal that we need. The algorithm chart is shown in Fig. 5.
If we applied Fourier transform to (18) directly, vibra-tion signal would be submerged in the low-frequency signal in spectrogram, as shown in Fig. 6. This is because the changed slant distance is equivalent to a low-frequency signal, whose amplitude is much larger than vibration amp-litude. In this way, it is not easy to distinguish the vibration signal and acquire its frequency from the spectrum. Therefore, we have to separate the vibration signal from the low-frequency signal by WT.
3.3 Frequency, amplitude, and initial phase estimation
After applying the wavelet transform to the phase history of range lines, the vibration signal is extracted, which can be expressed in the following form
~rv0ð Þ ¼η
X
i¼1
~
aisin 2π~fviηþφ~i
ð19Þ
By applying the Fourier transform directly to (19), the spectrum is obtained. It is convenient to get the esti-mated frequencies~fvi from the spectrogram.
The amplitudes Ãi in frequency domain are also easy
to obtain. Since the amplitudes in time domain and in frequency domain have the relationship as (20):
~
Ai¼T
2=dη⋅~ai ð20Þ
whereT is the total azimuth time and dηis the sample
interval in azimuth direction, the estimated amplitudes are acquired.
In order to estimate its initial phase, we define the basis function as follows:
rvrefðη;φ^iÞ ¼a~isin 2π~fviηþφ^i
ð21Þ
where ^φi∈½0;2π. The projection of estimated vibration signal~rv0ð Þη on the basis function can be expressed as
Sð Þ ¼φ^i h~rv0ð Þη ;rvrefðη;φ^iÞi ð22Þ
The estimated initial phase~φiis theφ^iin [0, 2π] which makesSð Þφ^i achieve the maximum.
4 Discussions
In real-world applications, the performance of the pro-posed method is affected by the presence of noise. If SAR returns are highly corrupted by noise, some errors may exist in the estimated vibration displacement. Thus, we are interested in finding the SNR threshold above which the estimation result is acceptable.
One metric to evaluate the estimation accuracy is the normalized root-mean-square error (NRMSE) [21]. It denotes the normalized Euclidean distance between the estimated vibration signal ^rv0ð Þη and the real vibration
signalrv0(η). NRMSE can be calculated by
Multi-scale analysis by
WT
Remove high-frequency component from
coefficient of each scale
Reconstruct low-frequency signal by inverse WT Subtract
low-frequency signal from the phase of range
line The phase of
the range line
Low-frequency
signal High-frequency
signal (vibration signal)
Fig. 5The algorithm chart of separating signal by WT
-5000 0 500
50 100 150
Low-frequency signal
Vibration signal
Frequency/Hz
Amplitude
NRMSE¼————————kr~v0ð Þη −rv0ð Þη k
rv0ð Þη
k k ð23Þ
where‖ • ‖denotes thel2norm operator.
Adding a zero-mean complex-valued white Gaussian noise to every SAR return, we compute NRMSEs to evaluate the performance of the proposed method in es-timating the vibration signal under different SNR levels. Here, we define the SNR as
SNR¼10 lgσ
2
σ2 w
ð24Þ
whereσ2is the power of each return echo andσ2
w is the variance of the additive noise.
Figure 7 shows an example of the vibration signal esti-mated by the proposed method. The real vibration signal is assumed to be a sinusoidal wave with a frequency of 20 Hz. Figure 7b shows when SNR = 10 dB, the noise has a little influence on the estimated signal. When SNR decreases to 0 dB, the estimated signal is severely cor-rupted by the noise.
In order to assess the SNR threshold clearly, we car-ried out a simulations for three vibration frequencies under different SNRs. The normalized root-mean-square errors are plotted in Fig. 8. The vibration frequencies are 10, 20, and 30 Hz, respectively. When SNR is lower than
−15 dB, the NRMSEs are relatively higher. And with the
decrease of SNR, the NRMSEs rise extremely fast. In this case, the estimated frequency may be correct, but it
seems not reliable. When SNR is increased to −15 dB,
the NRMSEs drop to an acceptable level. But the errors plateau as the SNR increases. The results also imply that
when SNR is larger than −15 dB, the higher the
vibra-tion frequency is, the lower the NRMSEs are.
5 Simulations
5.1 Airborne radar along desirable trajectory
5.1.1 Single point target
The simulated SAR is an airborne side-looking
strip-mode SAR working in theKuband. Table 1 lists the key
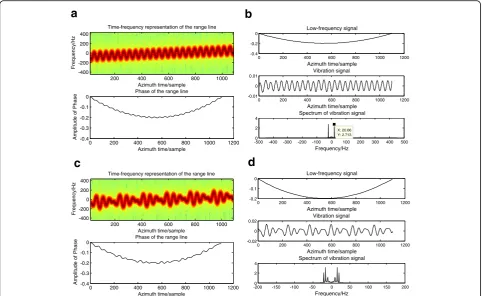
system parameters associated with the simulation. The vibrating target with amplitude of 5 mm, a frequency of 20 Hz, and initial phase ofπrad is located at (0,7000,0). After applying range compression and range migration correction to the simulated SAR returns, the range line of the vibrating object was obtained. Figure 9a shows the time-frequency representation and the real phase of the vibrating target’s range line. Its time-frequency represen-tation illustrates that the small vibration modulates the phase history of the radar echoes. The real phase was ac-quired by the method proposed in Section 3.1, which consists of two components: the variation with azimuth time of the nominal line-of-sight distance from the tar-get to the radar sensor and the vibration signal, which are referred to as the low-frequency signal and the high-frequency signal, respectively. Figure 9b shows the result of the estimation. The first figure is the nominal
line-of-0 200 400 600 800 1000 1200 -0.01
0 0.01
0 200 400 600 800 1000 1200 -0.01
0 0.01
0 200 400 600 800 1000 1200 -0.02
0 0.02
Azimuth time/s
Magnitude
Magnitude
Magnitude
a
b
c
Fig. 7Vibration signal estimated by phase-analysis method.aReal vibration signal.bEstimated signal with SNR = 10 dB.cEstimated signal with SNR = 0 dB
-30 -20 -10 0 10 20
0 0.2 0.4 0.6 0.8 1 1.2 1.4
SNR/dB
The normalized root mean-square-error
Vibration frequency:f=10 Hz Vibration frequency:f=20 Hz Vibration frequency:f=30 Hz
Fig. 8Normalized root-mean-square errors in estimating vibration signal for three frequencies under different SNRs using
phase-analysis-based estimator
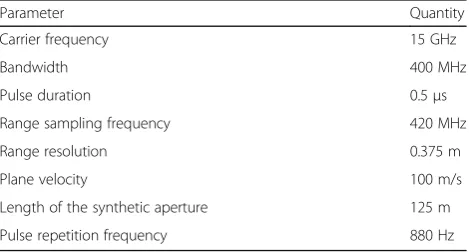
Table 1SAR system parameters used in the simulation
Parameter Quantity
Carrier frequency 15 GHz
Bandwidth 400 MHz
Pulse duration 0.5μs
Range sampling frequency 420 MHz
Range resolution 0.375 m
Plane velocity 100 m/s
Length of the synthetic aperture 125 m
sight distance varied with azimuth time, which is equivalent to a low-frequency signal separated from the phase of the range line by WT. Then subtracting this low-frequency sig-nal from the phase of the range line, we obtained the vibra-tion signal, as shown in the second figure. After applying fast Fourier transform (FFT) to the estimated vibration sig-nal, the vibration frequency was acquired, as illustrated in the last figure. The estimated amplitude and initial phase is 4.9 mm and 3.0945 rad by the proposed method.
Supposing that the vibration signal is a multi-frequency sinusoidal signal, whose equation is given by
rv0ð Þ ¼η 0:003 sin 20ð πηþ11π=9Þ þ0:006 sin 30ð πηþπÞ
þ0:004 sin 40ð πηþπ=4Þ ð25Þ
Time-frequency representation and phase of the range line is shown in Fig. 9c. It is clear that a multi-frequency signal modulates the phase history of SAR returned sig-nals. Figure 9d demonstrates the result of the estimation, from which we know that the estimated vibration signal contains three frequencies. The estimated frequencies are 9.917, 15.7, and 20.66 Hz, which are almost the same as the real frequencies. The estimated amplitudes are
2.1, 5.7, and 3.8 mm correspondingly and the estimated initial phase is as Table 2.
5.1.2 Multiple point targets in different range cells
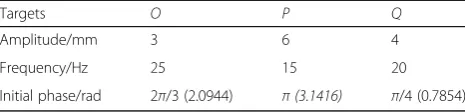
Then we considered the case where multiple point targets in different range cells are contained in the scene. Suppose that there are three vibrating targets
O, P, and Q, located at (0,6990,0), (0,7000,0), and
(0,7005,0). The vibration amplitude, frequency, and
initial phase of O, P, and Q are shown in Table 3.
The range lines of the three targets are shown in Fig. 10a. Applying the proposed method to these range lines respectively, we got the results of estimation for point O, P, and Q, as shown in Fig. 10b–d. The esti-mated vibration parameters are listed in Table 4, which are almost the same as the corresponding parameters set in Table 3.
Time-frequency representation of the range line
Azimuth time/sample
Frequency/Hz
200 400 600 800 1000 -400
-200 0 200 400
0 200 400 600 800 1000 1200 -0.4
-0.3 -0.2 -0.1 0
Phase of the range line
Azimuth time/sample
Amplitude of Phase
Time-frequency representation of the range line
Azimuth time/sample
Frequency/Hz
200 400 600 800 1000 -400
-200 0 200 400
0 200 400 600 800 1000 1200 -0.4
-0.3 -0.2 -0.1 0
Phase of the range line
Azimuth time/sample
Amplitude of Phase
0 200 400 600 800 1000 1200
-0.4 -0.2 0
Low-frequency signal
Azimuth time/sample
0 200 400 600 800 1000 1200
-0.01
Spectrum of vibration signal
Frequency/Hz X: 20.66 Y: 2.713
0 200 400 600 800 1000 1200
-0.2 -0.1 0
Low-frequency signal
Azimuth time/sample
0 200 400 600 800 1000 1200
-0.02
Spectrum of vibration signal
Frequency/Hz
a
b
c
d
Fig. 9The simulation results for one vibrating point target.a,bTime-frequency representation, the phase of the range line and the vibration estimation results for a target whose vibration signal is a single-frequency sinusoidal.c,dTime-frequency representation, the phase of the range line and the vibration estimation results for a target whose vibration signal is a multi-frequency sinusoidal
Table 2Comparison of real phase and estimated phase
Real phase/rad 11π/9 (3.8397) π(3.1416) π/4 (0.7854)
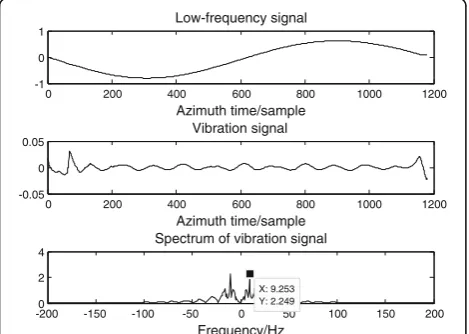
5.2 Airborne radar along undesirable trajectory
As mentioned in Section 3.1, if the aircraft flies with a velocityvY, the slant rangeR(η) would fluctuate with azi-muth time. Suppose that the aircraft’s track is a sinusoid, which can be written as
y¼sinðπ=62:5xÞ ð26Þ
The vibrating target with amplitude of 5 mm and a frequency of 10 Hz is located at (0,7000,0). Applying the same method to the simulated SAR returns, we obtained the result as shown in Fig. 11.
In fact, the aircraft’s fluctuation frequency is very low so that it is also can be referred to as a low-frequency signal compared to the vibration signal. Hence, the proposed
method still holds true in the case of the undesirable trajectory.
5.3 Comparison with TF analysis method, DFRFT-based method, and HAF-based method
As described in Section 1, several methods about extract-ing the vibration signatures with SAR systems have been proposed during the last few years. The time-frequency (TF) analysis method is an important tool to analyze the micro-Doppler effect. DFRFT is an effective method to estimate the time-varying accelerations, frequencies, and displacements associated with vibrating objects [10–12]. Moreover, a time-frequency tracking algorithm based on the high-order ambiguity function (HAF) is employed to reconstruct the instantaneous frequency law of the micro-Doppler [16, 17]. In this section, we compare them with phase-analysis method.
5.3.0.1 Time-frequency analysis method The frequency distributions to provide methods use time-frequency distributions to provide an analysis of the micro-Doppler effect. The time-frequency representation of the range line is shown in Fig. 12, which roughly re-veals a 4-Hz vibration component. However, this is only Table 3Vibration parameters of three targets
Targets O P Q
Amplitude/mm 3 6 4
Frequency/Hz 25 15 20
Initial phase/rad 2π/3 (2.0944) π(3.1416) π/4 (0.7854)
Range/bin
0 200 400 600 800 1000 1200
-0.2 0 0.2
Low-frequency signal
Azimuth time/sample
0 200 400 600 800 1000 1200
-5
Spectrum of vibration signal
Frequency/Hz
0 200 400 600 800 1000 1200
-0.2 0 0.2
Low-frequency signal
Azimuth time/sample
0 200 400 600 800 1000 1200
-0.01
Spectrum of vibration signal
Frequency/Hz
0 200 400 600 800 1000 1200 -0.2
0 0.2
Low-frequency signal
Azimuth time/sample
0 200 400 600 800 1000 1200 -0.01
Spectrum of vibration signal
Frequency/Hz
a
b
c
d
O P
Q
a qualitatively deduced observation. To obtain precise estimations of the instantaneous displacement from the time-frequency representation, further estimation proce-dures are required. In addition, the resolution of time-frequency distribution is closely related to the length of the time window, and we cannot get optimal time reso-lution and frequency resoreso-lution at the same time. If the vibration frequencies are higher, or there are multiple vi-bration components, the time-frequency representation would not be clear enough to reveal all the vibration components. Whereas the proposed method provides dir-ect quantitative estimations of the vibration displacement and a larger range of the estimated vibration frequency.
5.3.0.2 DFRFT-based methodThe DFRFT-based method approximates the nonstationary signal by a chirp signal in a small time window. DFRFT is applied to estimate the vibration acceleration. Then the history of the vibra-tion acceleravibra-tion can be reconstructed and the vibravibra-tion frequency can be obtained by calculating DFT of the ac-celeration. The proposed method extracts the phase of the global data directly and applies the WT to the phase history to obtain the vibration signal.
A simulated example is provided to compare the capabil-ity of the two methods on vibration signal reconstruction and spectrum estimation. We assumed that the point tar-get’s vibration signal is rv0(η) = 0.005 sin(8πη). The
estima-tion results are shown in Fig. 13. The estimated frequency of DFRFT-based method and phase-analysis method is
X: 0.0005687 Y: 17.42 Index: 8725 RGB: 0.875, 1, 0.125
-0.5 -0.4 -0.3 -0.2 -0.1 0 0.1 0.2 0.3 0.4 0.5
Fig. 12The time-frequency representation of the range line (the actual vibration frequency is 4 Hz)
-0.8 -0.6 -0.4 -0.2 0 0.2 0.4 0.6
Spectrum of vibration signal
0 50 100 150 200 250 300 350
Spectrum of vibration signal
Frequency/Hz
Amplitude
a
b
Fig. 13The estimation results by two different methods.aObtained by DFRFT-based method.bObtained by phase-analysis method
Table 4Estimated vibration parameters of three targets
Targets O P Q
Amplitude/mm 2.6 5.4 3.8
Frequency/Hz 25.62 15.7 20.66
Initial phase/rad 2.0577 3.2358 0.8482
0 200 400 600 800 1000 1200
-1 0 1
Low-frequency signal
Azimuth time/sample
0 200 400 600 800 1000 1200
-0.05
Spectrum of vibration signal
Frequency/Hz
4.355 and 3.931 Hz, and the computation time is 5.7754 and 0.4108 s, respectively. It demonstrates that the phase-analysis method does an excellent reconstruction of smooth vibration displacement and provides more accurate estima-tion results. Furthermore, it also implies that the proposed method in this paper has lower computation complexity.
5.3.0.3 HAF-based method The HAF-based method
tracks the instantaneous frequency laws by dividing the range line of the vibrating target in nonoverlapping win-dows and locally approximating the phase with a poly-nomial expression. In each window, HAF algorithm is applied, which is an iterative algorithm, to estimate the polynomial coefficients. After the initial reconstruction, the instantaneous frequency laws must be filtered in order to mitigate the possible gaps that may appear at the transitions between estimation windows [17]. On the other hand, the phase-analysis method needs neither it-erative algorithm in each window nor filtering for esti-mated instantaneous frequency laws. Instead, it gives the history of the vibration displacement directly and then the vibration amplitudes, frequencies, and initial phases can be estimated. Therefore, our proposed method may have relatively low computation complexity. Besides, our method makes use of the global data so that the possible errors induced by transitions between the estimation windows may be avoided.
6 Conclusions
In this paper, a new method for radar-based vibration estimation was presented, making the radar capable of more accurate vibration measurement. We obtain the SAR phase history by applying the range compression and range migration correction to the SAR returns. Then the wavelet transform is acted on the phase history to ex-tract the vibration displacement. This method provides quantitative estimations of the vibration signature includ-ing vibration amplitudes, frequencies, and initial phases. Some simulations provided to demonstrate that it can esti-mate the vibration signature of one or several targets vi-brating in single or multiple frequencies successfully and it also can be used for the case where the aircraft with the radar sensor moves along desirable or undesirable trajec-tory. Note that in this paper, we assume that the aircraft flies at a constant speed. When the aircraft flies at the speed varied with time, the fluctuation of the velocity would generate a little interference to the phase history, but the vibration signal can be still extracted exactly. Therefore, the influence of the changed velocity can be neglected.
However, this method has limitation that targets have to be distributed in different range cells. We cannot ex-tract the vibration displacement of each target which is in the same range cell. In our future work, the case of
multiple point targets in the same range cell and the models of real-world vibrating objects will be examined carefully, which will have great significance to object recognition, classification, and SAR imaging.
Acknowledgements
This work was supported in part by the National Natural Science Foundation of China under Grant 61201366, in part by the Fundamental Research Funds for the Central Universities under Grant NS2016040, in part by the Fundamental Research Funds for the Central Universities under Grant NJ20150020.
Competing interests
The authors declare that they have no competing interests.
Received: 3 March 2016 Accepted: 25 August 2016
References
1. H Wu, M Siegel, P Khosla, Vehicle sound signature recognition by frequency vector principal component analysis. IEEE Trans. Instrum. Meas.48(5), 1005–1009 (1999)
2. VC Chen, F Li, S Ho, H Wechsler, Micro-Doppler effect in radar: phenomenon, model, and simulation study. IEEE Trans. Aerosp. Elecron. Syst.42(1), 2–21 (2006)
3. Q Wang, M Pepin, A Wright, R Dunkel, T Atwood, B Santhanam, W Gerstle, AW Doerry, MM Hayat, Reduction of vibration-induced artifacts in synthetic aperture radar Imagery. IEEE Trans. Geosci. Remote Sens.52(6), 3063–3073 (2014) 4. Y Zhang, JP Sun, P Lei, W Hong, SAR-based paired echo focusing and
suppression of vibrating targets. IEEE Trans. Geosci. Remote Sens.52(12), 7593–7605 (2014)
5. T Sparr, B Krane, Micro-Doppler analysis of vibrating targets in SAR. IEE Proc. Radar, Sonar Navigat.150(4), 277–283 (2003)
6. T Sparr, B Krane, Analysis of phase modulation caused by target motion in SAR images. Proc. SPIE5102, 178–188 (2003)
7. T Sparr, B Krane, Time-frequency analysis of vibrating targets in airborne SAR systems. IEE Proc. Radar, Sonar Navigat.150(3), 173–176 (2003) 8. M. Rüegg, E. Meier, D. Nüesch, Constant Motion, Acceleration, Vibration, and
Rotation of Objects in SAR Data. Proc. SPIE 5980, 598005-1-12 (2005) 9. M Rüegg, E Meier, D Nüesch, Vibration and rotation in millimeter-wave SAR.
IEEE Trans. Geosci. Remote Sens.45(2), 245–255 (2007)
10. Q. Wang, M. Pepin, R.J. Beach, R. Dunkel, T. Atwood, A.W. Doerry, B. Santhanam, W. Gerstle, M.M. Hayat, Demonstration of Target Vibration Estimation in Synthetic Aperture Radar Imagery. In Proc. IEEE Int. Geosci. Remote Sens. Symp. (IGARSS, Vancouver, 2011), pp.4083-4086
11. Q Wang, M Pepin, RJ Beach, R Dunkel, T Atwood, B Santhanam, W Gerstle, AW Doerry, MM Hayat, SAR-based vibration estimation using the discrete fractional Fourier transform. IEEE Trans. Geosci. Remote Sens.50(10), 4145–4156 (2012)
12. A. Jelili, B. Santhanam, M. Hayat, Limitations and Capabilities of the Slanted Spectrogram Analysis Tool for SAR-Based Detection Of Multiple Vibrating Targets. 2014 48thAsilomar Conference on Signals, Systems and Computers. (Pacific Grove, CA, 2014), pp.172-176
13. B Peng, XZ Wei, B Deng, HW Chen, Z Liu, X Li, A sinusoidal frequency modulation Fourier transform for radar-based vehicle vibration estimation. IEEE Trans. Instrum. Meas.63(9), 2188–2199 (2014)
14. Y. Zhang, J.P. Sun, Moving Target Vibration Estimation in SAR Using Chirp Modulation and Autofocus. In Proc. IEEE Int. Radar Conf. (RADAR, Lille, 2014), pp.1-6
15. Y Liang, Q Zhang, Y Luo, YQ Bai, YA Chen, Micro-Doppler features analysis and extraction of vibrating target in FWCW SAR based on slow time envelope signatures. IEEE Geosci. Remote Sens. Lett.12(10), 2041–2045 (2015) 16. A. Anghel, G. Vasile, C. Ioana, R. Cacoveanu, S. Ciochina, Vibration Estimation
in SAR Images Using Azimuth Time-Frequency Tracking and a Matched Signal Transform. In Proc. IEEE Int. Geosci. Remote Sens. Symp. (IGARSS, Milan, 2015), pp.2576-2579
17. A Anghel, G Vasile, C Loana, R Cacoveanu, S Ciochina, Micro-Doppler reconstruction in spaceborne SAR images using azimuth time-frequency tracking of the phase history. IEEE Geosci. Remote Sens. Lett.13(4), 604–608 (2016) 18. B.P. Lathi, Signal Processing and Linear Systems (Univ. California,
19. G. Cumming, F.H. Wong, Digital Processing of Synthetic Aperture Radar Data: Algorithms and Implementation (Publishing House of Electronics Industry, Beijing, 2012), pp. 154-191
20. RK Raney, Synthetic aperture imaging radar and moving targets. IEEE Trans. Aerosp. Electron. Syst.AES-7(3), 499–505 (1971)
21. H. Kaibaf, J.T. Case, Y.R. Zheng, S. Kharkovsky, R. Zoughi, Quantitative and Qualitative Comparison of SAR Images from Incomplete Measurements Using Compressed Sensing and Nonuniform FFT. In Proc. Radar Conf. (RADAR, Kansas City, 2011), pp. 592-596
Submit your manuscript to a
journal and benefi t from:
7Convenient online submission 7Rigorous peer review
7Immediate publication on acceptance 7Open access: articles freely available online 7High visibility within the fi eld
7Retaining the copyright to your article