Research on Streamlining Seismic Safety Evaluation of Underground Reinforced
Concrete Duct-Type Station
-Part-3. Analytical Simulation by RC Macro-Model and Simple Soil Model-
Jun Matsui 1), Keizo Ohtomo 1), Tadashi Kawai 1), Akihiro Okaichi 2)
1) Abiko Research Laboratory, Central Research Institute of Electric Power Industry, Chiba-ken, Japan 2) Kansai Electric Power Company Ltd, Ohsaka-fu, Japan
ABSTRACT
We have been conducting a research to obtain the verification data concerning the performance of RC duct-type underground structures subject to strong earthquakes. In this paper, we simulated large-scale laminar shear box excitation test [1] by a dynamic nonlinear FEM and discussed the validity of modeling, by which RC member and soil are def'med as hysteresis dependent models (RC : Axial force dependent degrading tri-linear model, soil : Ramberg-Osgood model), using joint elements to simulate the interaction along the interface of two materials including the slippage and separation between
soil and RC structure.
As a result, the proposed analytical method was confirmed to predict the deformational characteristics of soil and RC structure as well as damages of RC structures in relation to verification of seismic performance within a practical accuracy. INTRODUCTION
Since the 1995 Great Kobe Earthquake, appropriate seismic safety assessment of infrastructures has been posing an urgent issue requested from the public. In particular, as for underground structures, verification of the seismic safety was a pressing need in the face of shear failure happened to the center pillars in subway Daikai-station. In view of the situation, review as well as upgrading of various structural design codes has been attempted and some of them have been revised from limit states design to performance verification design.
In this paper, we aim at proposing a practical method of nonlinear structural analysis in order to verify seismic performance. The method proposed here is classified as method A in the definition described in Part-1. Considering convenience in practical use, soil and structure were represented by simple models to help reduce CPU time, which led to adoption of macro hysteresis dependent models. In addition, it was anticipated that influence of interaction between soil and structure was pronounced due to strong earthquakes. A simple model (joint elements) was defined as boundary condition to reproduce slippage and separation between the two materials.
To confirm the applicability of this macro model, we simulated the shaking table tests with embedded RC duct-type model structures to be compared with experimental results,
and discussed validity with respect to verification method of seismic performance.
OUTLINE OF E X P E R I M E N T AND ANALYSIS Outline of Large-scale Shaking Table Tests
In the large-scale laminar shear box excitation experiment, RC duct-type structural model was embedded in dry sand as illustrated in Fig.1. One was the case in which its bottom slab was firmly fixed to the base-plate of shaking table (hereafter called "fixed case"). The other
11.6m dry sand(siliceous sand No.5) !
4.75m
1.75m
,
Unfixed model , | 1.75m i Fixed modelFig.1 Arrangement of RC Boxes in the Laminar Shear Box
SMiRT 16, Washington DC, August 2001 Paper # 1296
model was placed 1.5m above the base plate (hereafter called "tmfixed case"). RC structure was two-box-duct-type specimen with a scale of 1 to 2.5 with respect to actual structures. Specification of RC members and their material properties are given in Tables 1 and 2, respectively. In particular, RC structure was designed as Gs (shear stiffness of whole RC structure) / Gg (shear stiffness of soil) = 0.20 to facilitate plastic deformation of RC structure. Input acceleration data adopted in the excitation tests were based on N-S component of records observed in the campus of Kobe University at the time of Great
Kobe Earthquake on 17 Jan. 1995. The maximum acceleration was changed to about 1100 Gal, and the time scale was compressed by a factor of 1/2.
Table 1. Spcification of Section of RC Strucure
Index Value
Width of RC member B [m] 1.00
Length of RC member L [m] 3.00
Height of RC Structure H [m] 1.75
Width of RC member h Ira] 0.30
Concrete Cover d Ira] 0.01
Reinforcement ratio Pt [%] 0.56
Table 2. Material Properties of Concrete and Rebar
Index Value
Concrete
Rebar
iYoung's Modulus E¢ EMPa-] 2.64× 10 4
Compression Strength f¢ [MPa] 32.36
Tensile Strengt ft [MPa] 2.34
Young's Modulus Es [MPa] 1.76× 10 4
Yield Strength cr sy [MPa-I 257.60
l)Analytical Model
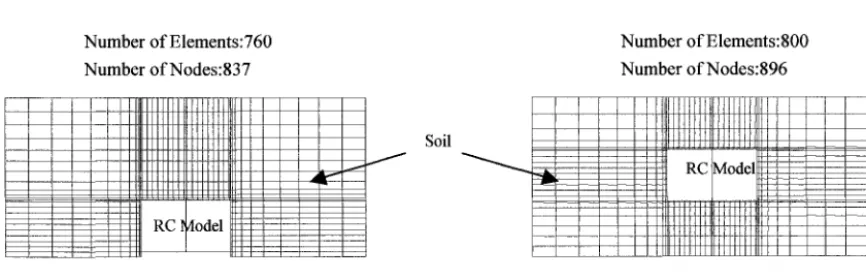
2D-FE mesh for analysis was generated considering the size of laminar shear box as sketched in Fig.2. The side
boundary condition was idealized by horizontal rollers with a mass representing the effect of inertia force caused by the frame of laminar shear box. The upper boundary was made free, and the bottom one was fLxed.
Number of Elements: 760
Number of Nodes:837
I Iilll Illll IIlll
ill i ilii I lill I
IIII J,J
IIII R C ]~/Iodel I III
I III IIII
Number of Elements:800 Number of Nodes:896
I Iltt/lt Illll/t
I Iltllll lllllll
I I l i l l l l I I I l l l /
I S o i l i ~ , ~ l , ~ l ~ l i
/ ~ ~ RC Model
IIIIIIllll 1
I l l l l l l I l l l l l l
. . . . I I I l i l l It111111
i l l l l l l Itilili i
(a) Fixed Model (b) Unfixed Model
Fig.2 Finite Element Mesh for Overall System
2) Modeling of Soil [2]
To express the nonlinearity of RC members a tri-liner moment-curvature model was adopted, and for soil Ramberg-Osgood model (hereafter called "R-O model") was incorporated in view of matching complexity with the RC
model used.
~ s 1 + a S (1)
in which s is normalized shear stress,
y
is shear strain, Su isshear strength, Go is initial shear modulus, ct is parameter
depending on failure strain, fl is parameter specifying the shape of
skelton curve (i) Go
Go was obtained from following expression using measured Vs and p in the laminar shear box.
Go - P Vs 2 (2)
in which Vs is velocity of secondary wave in sand, and p is the density of sand.
(ii) c~
tD
O tD
11
0 . 8
0 . 6 - - ~
I • G/G o • h
R - O rn odel(h)
0 4
0 ¢ ' ' ' " " " ' ' '''''i 10 6 10 -5 0 . 0 0 0 1 0.001
0.5
0.4
0
0.3 "~
~ 0 ..=
0.2
t~ g~
0.1
I IIIII 0
0.01 0.1 Shear Strain 7"
Fig.3 Dynamic Properties and R-O Model
In R-O model, it was difficult to estimate the reduction of shear for Siliceous Sand No.5
stiffness of soil in the whole shear strain range keeping a consistent
accuracy. Therefore, we paid attention to maximum shear strain of soil ( y =3.0%) which was measured in the excitation test, and defined as the strain at failure( 3, f). The shear stress corresponding to that strain was provided from the result of element tests of soil. Reference strain( 3, r) and coefficient c~ were calculated from Eq. (3) and (4), respectively.
"Cf
]fr " - - - ( 3 )
Go
- Y_L_ 1 (4)
7r
(iii) 13
Coefficient 13 was determined from the regression analysis.
B ending Moment
p + 2 G 0 Mu
Ultimate state
where h is damping ratio of soil.
To define the hysteresis loop, we applied Masing Rule [3] in which n was given as 2. A R-O model fitting with experimental results is depicted in Fig.3 for the case of mean effective stress of 20kPa.
3)Modeling of RC Member [4]
Skeleton curve def'ming relationships between
bending moment and curvature for RC member was modeled by axial force dependent degrading tri-linear model. Here, three characteristic points corresponded to initiation of crack, yielding in rebar and compression
My
Mcr
Yielding
:lnitia (Srac ing :
i , o
i
o i o
• | o
o t
e i i
• e
o , o
o
i e o
e e
o I ,
t t
o i t
i
i o e
~cr
~y
~u
Fig.4 Axial Force Dependent Tri-linear Model for RC Member
-2/3 !
Slip - es (2 + 3500 es)( f c ) 20
D (6)
Slip
~ s - 0s Slip
- -L- = d E
(7)
+'y - - + y "I- + s ( 8 )
O
SL
Fig.5 Modeling of Pulling-out of Rebar
Normal Stress In the equations above the symbols are defined as
follows;
Slip : slippage due to pulling-out, e s : strain in rebar, f'c : compression strength of concrete, D : diameter of rebar, 4~ s : curvature generated by pulling-out, L : length of finite element, d: spacing of rebar, 4~ 'y : modified curvature at
Tension
failure of concrete, respectively and the values were calculated by section analysis subjected to simultaneous axial force and moment (Fig.4).
In the comer regions of RC members, pulling-out of rebar was observed, which influenced overall load - displacement relationships of RC structure. Taking this effect into account, the position of the second characteristic point (yielding in rebar) was modified which was based on relationships caused by pulling-out due to slippage between rebar and concrete. The slippage was expressed by the following equation. [5]
Normal Strain
section of yielding, ~b y" original curvature at section of Compression
yielding Contact Separetion
Nonlinearity due to shear stiffness degradation of RC (a) Normal Direction
members was not considered since substantial shear deformation did not occur thanks to ample arrangement of web reinforcement.
Shear Stress
__/
Shear Strain-
(b) Tangential Direction Fig.6 Constitutive Relationship of Joint Element
4)Modeling of Interaction between Soil and Structure
In order to consider slippage and separation between soil and structure, joint element was inserted between them, which was formulated to follow Mohr-Coulomb law (Fig.6). Here, cohesion and friction angle in joint element was defined as 0 and 23.4 ° , respectively[6].
The dynamic response analysis was executed by using time history of response acceleration measured at the floor of the laminar shear box (Fig.7).
ANALYTICAL RESULT AND DISCCUSIONS Behaviors of Combined RC and Soil Systems
Fig.8 depicts maximum value distributions of horizontal displacements in whole system along the height of the laminar .o = box compared with the corresponding experimental ones. Analytical results agreed with the experimental ones in the range where the RC structure was buried with the exception that analytical value was a little smaller than that of experiment in the case of unfixed model. This difference could be attributed to the following facts; That is, 1) In the experiment the horizontal displacement of side boundary was measured at the frame of laminar box, which did not necessarily represent the displacement
(Gal) Maximum Acceleration • 1127Gal
1200 A
600 11 _
0 W r
< -600 =
-1200
0.0 1.0 2.0 3.0 4.0 5.0
Time (see)
Fig.7 Time History of Floor Response Acceleration Employed for Analysis (Fixed Case)
of soil itself, and 2) Stable dynamic movement of soil was not available due to lower confmement pressure in the upper region, which was aggravated by extremely higher excitation of over 1000Gal. Looking at the overall comparison between analytical and experimental results for displacements, it may roughly be said that the assumptions employed in the dynamic modeling were appropriate.
Behavior of RC Structure (m)
5.0 I) Overall Displacement of RC Structure
Analytical results of the time history of relative .9
horizontal displacements between top and bottom slabs were ~ 4.0
compared with the experimental ones in Fig.9 for fixed and
unfixed cases. In the case of unfixed model, in spite of ~ 3.0
Gs/Gg<<l.0, the effect of slippage and separation between o
soil and structures had a pronounced influence on overall = 2 0
deformation of RC structure. However, in both cases,
analytical results agree well with experimental ones when ~ 1.0
joint elements were incorporated except for residual o
displacements, which cannot be dealt with by the analytical z 0 . 0 , i
model applied. "6
2) Verification of Judgment of Yielding in RC Member In the experiment, when steel strain exceed yielding strain, we judged the steel yielded. The vertical axis on the right hand in Fig.9 represents steel strain normalized by
Anal~lsis, ~ I ~
[ P
10 20
iment
30 (cm)
(rn)
5.0
m si
.~ 4.0
M o
o m o
0 10 20 30 (cm)
Maximum Horizontal Displacement Maximum Horizontal Displacemen!
(a)Fixed Case (b)Unfixed Case
Fig.8 Maximum Value Distribution of Horizontal Displacement
yielding strain. In the analysis, however, the moments are defined in the vertical axis on the left hand in Fig.10, being normalized by yielding moment. Thus, we can compare the yielding strain and moment on the same scale for the sake of simplicity. As can be seen in Fig.10, the timings of experimental and analytical yielding almost coincide with each other, which verifies validity of the analytical procedure to judge yielding.
Analysis(without Joint
Element)]
(cm) Analysis(with Joint Element) /
8.0 ,
"~ Experim ent
A
° A
o 0.0 , ~
-8.0
0.0 1.0
(cm)
8 . 0
o
~ 0.0
r~
Analysis(without Joint Element)
- - - = - Analysis(with Joint Element)
Experim e~ tt
4.0 5.0
-8.0
2.0 3.0 4.0 5.0 0.0 1.0 2.0 3.0
Tim e(see) Tim e(see)
(a) Fixed Case (b) Unfixed Case
Fig. 9 Time Histories of Relative Displacement between Top and Bottom Slabs
1.0
l-- 7
_-~ Experi ent
E -1.0
o 0.0 2~
Yileding Positition:Corner Section "~
Experiment
Yielding Position:Corner Sectiony between Left Side Wall and Bottom Slab ~ = between Left Side Wall and Bottom Slab
1.o ~ ~ 1.o -~
~- ~ ~ o . o . - . _
!1 v
!
_
:
_lOO
,
0pleri ent ~ I ~ ~ ~ .N i ~ "--"
-1. o0~ %E -1.0 [~ ~ A n a l y s i s -1.0
o o
1.0 2.0 3.0 4.0 5.0 Z Z 0.0 1.0 2.0 3.0 4.0 5.0 Z
T i m e(sec ) Tim e(see)
(a)Fixed Case (b)Unfixed Case
Fig.10 Time Histories of Steel Strain (Experiment) and Moment (Analysis)
3)Positions and Time Order of Yielding in Steel
Fig.11 and 12 show the analytical results about distribution of yielding positions in the RC structures, which were compared with experimental ones in both cases. In Fig.11 and 12, the number in circle indicates the time order of yielding. Concerning the time order of yielding, some discrepancies were observed between analytical results and experimental ones. But since the time-lag between them was of negligible order. The position as well as the distribution in yielding process agrees well with those of experiments.
Direction of Deformation
_.__>
@.._ ®_.
I I I I I I
Direction of Deformation
<____
._~ ____~
~ -
Direction of Deformation Direction of Deformation
_.___> <_____
@ . . . . ~ ®
Ii !! !! .. !!!
(a) Experimental Results
l l : R i g i d Z o n e
@ @
(b) Analytical Result
Fig.ll Positions and Time Order of Yielding in Steel (Fixed Case)
®
(a) Experimental Results
- - " m I : R i d d Z o " ~ ' (b) Analytical Results
Fig.12 Positions and Time Order of Yielding in Steel (Unfixed Case)
DISCCUSIONS ON O T H E R I M P O R T A N T MEASURES F O R SEISMIC P E R F O R M A N C E
Identification of Load Exerting Dominant Influence upon Displacement of RC Structure
One of the important features of underground structure is that it is subject to a few kinds of loads. Three types of such loads are conceivable; 1) Shear stress acting on the top slab (load A), 2) Inertia force acting to structure (load B), and 3) Normal earth pressure acting on the side wall(load C). To understand quantitatively the contribution of each load, on the equal basis, we calculated the equivalent moments caused by the each load with respect to the center of bottom slab as showed in Fig.13 and 14. The effect of load A was found to be most dominant, which was also verified by analysis. As for loads B and C, the degree of their influence is much less than that of load A. Correlation between analytical and experimental equivalent moments for the inertial force (load B) seems satisfactory, but that for the normal earth pressures acting to the end walls (load C) cannot be judge as good. The discrepancy does not pose a problem in view of the small absolute values of load C compared with load A. The problem is that for normal earth pressure the analysis could not simulate the experimental measurement with time. This is caused by the limitation of the R-O model we applied.
I
(kN • m) . . . . E x p e r i m e n t . , - A n a l y s i s [ (kN i)
150 -' 50
J
'
-150 " ~ 1 -50
0.0 1.0 2.0 3.0 4.0 5.0 0.0 1.0 2.0 3.0 4.0 5.0
, ,, E x p e r i m e n t . . . A n a l y s i s
Tim e(sec) T im e(sec)
(a)Moment by Shear Stress Acting on Top Slab (b)Moment by Inertia Force Acting to RC Structure
Fig.13 Time History of Moment Caused by Three Kinds of Loads (Fixed Case)
(kN • m)
50
0
0
-50
0.0
, Experiment , Analysis[ (kN • m)
50
I -- Experiment . . . . Analysis I
A .
_ , _ ~ / , . - , q l - , . - _
[ -50
1.0 2.0 3.0 4.0 5.0 0.0 1.0 2.0 3.0 4.0
Tim e(see) Time(see)
(c)Moment by Normal Earth Pressure (d)Moment by Normal Earth Pressure Acting on the Left Side Wall Acting on the Right Side Wall
Fig.13 Time History of Moment Caused by Three Kinds of Loads (Fixed Case)
5.0
Index about Plastic Deformation of RC Structure
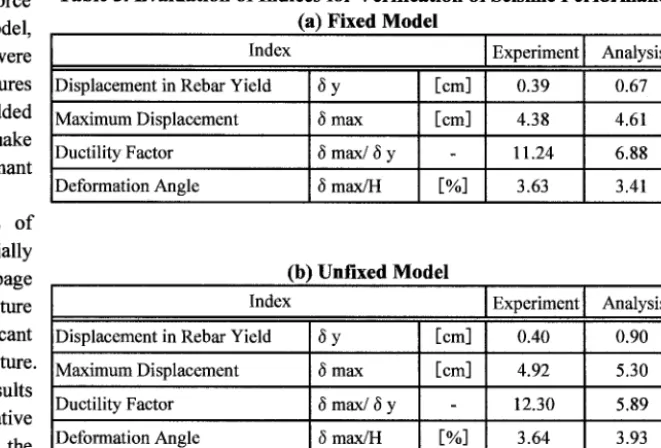
We evaluated various indices of plastic deformation of RC structures. In Earthquake Resistant design specification authorized by JSCE adopts displacement ductility factors. Table 3 summarized experimental as well as analytical values of these ductility factors and deformation angles, which are based on relative displacement between top and bottom slabs normalized by the height of structure. As mentioned before, the parameters for R-O model were determined based on maximum strain level in soil encountered in the experiment. This might have led to substantial over-estimate of displacement at the time of initial yielding. In other words, the analytical method applied is more suited for the post-yielding range. For this specific embedded structure, maximum relative displacements or deformation angles are considered to be more practical than ductility factors normally employed as can be judged from the values in Table 3.
C O N C L U D I N G R E M A R K S
<kN. ,)
I
ExperimentAnalysis I
t50(kN - m)
50
Experim ent Analysis I
o
- " w
hi V
. . . .' I
-150
0.0 1.0 2.0 3.0 4.0 5.0
Time(sec)
(a) Moment by Shear Stress acting on Top Slab
-50
wv I r
0.0 1.0 2.0 3.0 4.0 5.0
Time(sec)
(b)Moment by Inertia Force acting to RC Structure
(kN • a)
50
Experiment Analysis (kN • 0 ... Experiment Analysis
50
o , ~ =j~,.._,.,.,,_ ~ ...ek%- " ~ o Q ~,r-~.-q -
-50 -50
0.0 1.0 2.0 3.0 4.0 5.0 0.0 1.0 2.0 3.0 4.0 5.0
Time(see) Time(see)
(c)Moment by Normal Earth Pressure (d)Moment by Normal Earth Pressure
Acting on the Left Side Wall Acting on the Right Side Wall
Fig.14 Time History of Moment Caused by Three Kinds of Loads (Unfixed Case)
were def'med as macro models. The conclusions are as follows. (1) Soil and RC member were modeled as
hysteresis dependent R-O and axial force dependent degrading tri-linear model, respectively. Analytical results were confirmed to reproduce the damage features of the RC structures, which were embedded in soil and subjected to dynamic earthquake load in terms of yielding in steel, dominant forces to deform the structures etc..
Table 3. Evaluation of Indices for Verification of Seismic Performance (a) Fixed Model
Index I Experiment
Displacement in Rebar Yield 6 y Maximum Displacement 6 max
Ductility Factor 6 max/6 y
Deformation Angle 15 max/H
[cm] [cm]
[%]
Analysis
0.39 0.67
4.38 4.61
11.24 6.88
3.63 3.41
(2) In the case when shear stiffness of embedded RC structure is substantially
(b) Unfixed Model smaller than that of soil, relative slippage
and separation between soil and structure was thought to exert an insignificant influence on overall deformation of structure. But experimental and analytical results strongly suggested this effect of relative movement could not be ruled out on the
Index Displacement in Rebar Yield 6y Maximum Displacement 6 max
Ductility Factor 6 max/6 y
Deformation Angle 6 max/H
[cm] [cm]
[%]
Experiment[ Analysis
0.40 0.90
4.92 5.30
12.30 5.89
3.64 3.93
deformation of structure especially in severe H:Heghit of RC Structure earthquakes.
(3) For a measure of post-yielding deformation, absolute relative deformations or deformation angles of underground duct-type RC structures are more appropriate than ductility factors currently used in Japan.
A C K N O W L E D G E M E N T
The foregoing study is a part of the common research entitled "Development Study on Verification Method o f Seismic
Performance of Underground Reinforced Concrete Structures in Nuclear Power Stations (part-2)" which is supported by
Electric Power Industry in Japan and extends from 1997 through 2001. The managing company is Kansai Electric Power Co. Ltd. The authors are very grateful to the concerned of the power industry. They also appreciate valuable advices given by the committee organized in JSCE and chaffed by Prof. Hajime Okamura, President of Kochi Institute of Technology.
R E F E R E N C E S
1. Ohtomo, K., Suehiro, T., Kawai, K., Kanaya, "Research on Streamlining Seismic Safety Evaluation of Underground Reinforced Concrete Duct-type Structures in Nuclear Power Stations-Part-2 Experimental Aspects of Laminar Shear Sand Box Excitation Tests with Embedded RC Model-," Transactions of the 16 th International conference on Structural Mechanics in Reactor Technology, 2001,to be published.
2. Ohsaki, Y. et al., "A Proposal on a Dynamic Soil Model for Excitation Analysis and an Example of its Application," Proceeding of 5 th Earthquake Engineering Symposium, 1978, pp.697-704.
3. Masing G., "Eigenspannungen und Verfestigung beim Messung, " Proceeding of 2 ad International Congress Applied Mechanics, 1926, pp.332-335.
4. Takeda, T., Sozen M. A., and N. N. Nilsen, "Reinforced Concrete Response to Simulate Earthquake," Journal of Structural Division, ASME, Vol. ST12, 1970, pp.2557-2573.
5. Okamura, H. and Maekawa, K., "Non-linear Analysis and Constitutive Laws for Reinforced Concrete Structures, " Gihoudo-Publishing Co., 1991.5.
6. Japan Road Association, "Specifications for Highway Bridges, " 1994.2.