Comparisons of Different Methods of Cluster
Analysis with Application to Rainfall Data
Satyvan Yashwant
1, S.L .Sananse
2Research Scholar, Department of Statistics, Dr.B.A.M.U Aurangabad, Maharashtra, India1
Professor, Department of Statistics, Dr.B.A.M.U Aurangabad, Maharashtra, India2
ABSTRACT: Cluster analysis is statistical method of partitioning a sample into homogeneous groups or classes of high similarity, called as cluster. In this study we have classified monthly rainfall data of Marathwada region by using cluster analysis techniques. This is less rainfall affected region by since the lastly ten years. In this study we have used monthly rainfall data of 36 Metrological stations with 40 years of observation (1975 to 2014). There are several cluster analysis techniques available for classification of data .we have using seven cluster analysis techniques such as Ward’s, Complete, single, centroid, Average, median,& McQuitty. The result shows two cluster analysis techniques such as, single linkage & centric linkage method is most useful for classify the rainfall data of Marathwada region with most similarity level & minimum distance. The single linkage was classified 36 station of rainfall into three clusters with greater than 73 % similarity level and minimum distance. The centroid linkage was classified into two clusters with greater than 74% similarity level and minimum distance. This result is useful for identification of spatial rainfall pattern which is an essential task for hydrologists, climatologists as well as regional and local planners.
KEYWORDS: Ward’s, Complete, single, centroid, Average, median, McQuitty.
I. INTRODUCTION
Cluster analysis is a multivariate statistical procedure that starts with data set containing information about a sample of entities and attempts to reorganize these entities into relatively homogeneous groups or groups of highly similar entities, called as “clusters”. The present situation of Marathwada region consistently decreasing rainfall pattern of lastly ten year. Rainfall is directly effect to crop production. The present condition of Marathwada region decreasing croup yield of different commodity and inflation also increasing due to reduce croup yield. Marathwada region consist of eight districts such as, Beed, Hingoli, Jalna ,Latur, Nanded, Osmanabad and Parbhani. This region is situated between 170 -35 N and 200- 40 N latitude and 740 - 40 E and 780 – 15 E longitudes. The total geographically area of the region is 64525 square Kms. This region is dry region of Maharashtra. Cluster analysis is statistical method of partitioning a sample into homogeneous classes to produce an operational classification. The aim of using cluster analysis with hydrologic variables is to group observations or variables into clusters based on the high similarity of hydrologic features, such as geographical, physical, statistical or stochastic properties. This analysis is going to be done by two methods: the first one is hierarchical method and the second one unhierarchical. In hierarchical method, the numbers of groups in every level is different and each person belongs to a special group and there is no possibility of their displacement. In unhierarchical method, each person does not belong to any special group but the degree of their reference to each one of these groups is determined (Stat Soft, 1994: 323).In this study we have 40years (1978 to 2010) of seasonal rainfall (June to oct). The seven cluster analysis techniques such as s Ward’s, Complete, single, centroid, Average, median, & McQuitty was used for classification rainfall data of 36 metrological station in Marathwada region.
II. RELATEDWORK
cluster and principal component analysis to the territory of Sweden and found that cluster analysis is an appropriate method to use on a national scale with heterogeneous hydrological regimes.Domroes (1998:152), by the way of cluster analysis of monthly precipitation percentage in Iran .Sarah N. Kohail,& Alaa M. El-Halees,(2011) implementation of Data Mining Techniques for Meteorological Data Analysis. Kalkstein LS, Tan GR, Skindlov( 1987) An evaluation of 3 clustering procedures for use in synoptic climatologically classification. Gong X, Richman MB. 1995. On the application of cluster analysis to growing season precipitation data in North America. Kulkarni B S and Damodara Reddy D( 1994) used cluster analysis approach for classification of Andhra Pradesh on the basis of rainfall. Ramos, M.C.(2001) used Divisive and hierarchical clustering techniques to analyze variability of rainfall distribution patterns in a Mediterranean region. Jackson, I.J., Weinand, H.,( 1995). Classification of tropical rainfall stations by using comparison of clustering techniques. S. Kotsiantis, A. Kostoulas, S. Lykoudis, A. Argiriou, K. Menagias proposed a hybrid data mining technique that can be used to predict more accurately the mean daily temperature values . These are all related work about this paper.
III.
D
ATA ANDM
ETHODOLOGY.Marathwada region consist of eight districts such as, Beed, Hingoli, Jalna, Latur, Nanded, Osmanabad and Parbhani. This region is situated between 170 -35 N and 200- 40 N latitude and 740 - 40 E and 780 – 15 E longitudes. n this study we have using monthly rainfall data of 36 metrological stations with 40 years of observation (1975 to 2014) of Marathwada region data are collected by IMD & Maharashtra agriculture department.
Cluster analysis.
Cluster analysis is a convenient method for identifying homogenous groups of objects called clusters. Objects (or cases, observations) in a specific cluster share many characteristics, but are very dissimilar to objects not belonging to that cluster. Data can often be represented or abstracted as an n×p data matrix, with n rows and p columns, where rows correspond to entities in the dataset, and columns represent attributes or properties of interest. Each row in the data matrix records the observed attribute values for a given entity. In this study, we have 36 columns of metrological rainfall station with P year’s record of data ranging from 40 years. There are seven types of hierarchical cluster technique used for classification of rainfall data of Marathwada region.
I] Hierarchical clustering Methods.
Hierarchical clustering procedures are characterized by the tree-like structure established in the course of the analysis. Most hierarchical techniques fall into a category called agglomerative clustering. In this category, clusters are consecutively formed from objects. This type of procedure starts with each object representing an individual cluster. These clusters are then sequentially merged according to their similarity. First, the two most similar clusters are merged to form a new cluster at the bottom of the hierarchy. In the next step, another pair of clusters is merged and linked to a higher level of the hierarchy, and so on. In this study, the hierarchical cluster technique (described by Kaufman and Rousseuw, 1990) is applied in order to classify the synoptic rainfall stations into spatial groups. Several methods have been proposed for hierarchical cluster analysis, including Ward’s, Complete, single, centroid, Average, median,& McQuitty used for this .graphical classification of cluster display in dendrogram .
Dendrogram.
Dendrogram is graphical presentation method to classify cluster on the basis of minim distance and maximum similarity level. In hierarchical method classifications produced by either the agglomerative or divisive route may be represented by a two-dimensional diagram known as a dendrogram, which illustrates the fusions or divisions made at each stage of the analysis .The seven hierarchical clustering methods is used in this study on the basis of dendrogram such as follows .
1]Ward's minimum variance method.
possible increase in the error sum of squares. Ward’s method is used to get some sense of the possible number of clusters and the way they merge as seen from the dendrogram.
2
( , )
(
)
r s rs
r s
d r s
n n d
n n
Here 2
rs
d
is the distance between the group r and s which is determined by Ward method. Because in this case thevalue of dispersion within groups reaches to lowest point and the homogeneity of obtained groups reaches to highest point in Ward method.2.]Complete linkage.
Complete linkage is hierarchical clustering method. In this method cluster are sequentially combined into large cluster until all elements end up being in same cluster. At each step the two cluster separated by shortest distance are combined. In complete-linkage clustering, the link between two clusters contains all element pairs, and the distance between clusters equals the distance between those two elements (one in each cluster) that are farthest away from each other.The shortest of these links that remains at any step causes the fusion of the two clusters whose elements are involved.
3.]Centroid method.
This method calculates the distance between two clusters as the sum of distances between cluster means for all of the variables. In the centroid method, the centroid of a merged cluster is a weighted combination of the centroids of the two individual clusters, where the weights are proportional to the sizes of the clusters. One disadvantage of the centroid method is that the distance at which clusters are combined can actually decrease from one step to the next. This is an undesirable property because clusters merged at later stages are more dissimilar than those merged at early stages.
4.]Single linkage method.
Single linkage method is hierarchical clustering method. In this method the proximity of two clusters is defined as minimum of distance between two cluster or maximum of similarity between any two point in the two different cluster.
5.] Average linkage method
.This method of clustering is another type of single linkage or complete linkage clustering. The difference is that, the distance between clusters is defined as the average distance between all pair of point, one form one cluster and one from another.
6] Median linkage method.
Median linkage is hierarchical clustering method. In this method the distance between two clusters is the median distance between an observations in one cluster and an observation in other cluster. This is different averaging techniques, but use the median instead of the mean ,thus down weighting the effect of outliers .
7] McQuitty linkage method.
IV.
R
ESULT ANDD
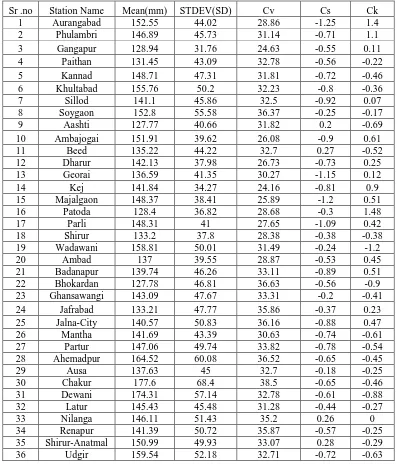
ISCUSSIONSThe statistical analysis for the monthly rainfall data of 36metroloical stations are summarized in (Table 1), where the, mean, standard deviation (SD), coefficient of variation (CV), skewness (Cs) and kurtosis (Ck) are given. Aashti & Bhokardan station was less monthly rainfall affected station.
Table 1.Descriptive statistics of selected metrological stations.
Sr .no Station Name Mean(mm) STDEV(SD) Cv Cs Ck 1 Aurangabad 152.55 44.02 28.86 -1.25 1.4 2 Phulambri 146.89 45.73 31.14 -0.71 1.1
3 Gangapur 128.94 31.76 24.63 -0.55 0.11 4 Paithan 131.45 43.09 32.78 -0.56 -0.22 5 Kannad 148.71 47.31 31.81 -0.72 -0.46 6 Khultabad 155.76 50.2 32.23 -0.8 -0.36 7 Sillod 141.1 45.86 32.5 -0.92 0.07 8 Soygaon 152.8 55.58 36.37 -0.25 -0.17 9 Aashti 127.77 40.66 31.82 0.2 -0.69 10 Ambajogai 151.91 39.62 26.08 -0.9 0.61 11 Beed 135.22 44.22 32.7 0.27 -0.52 12 Dharur 142.13 37.98 26.73 -0.73 0.25 13 Georai 136.59 41.35 30.27 -1.15 0.12 14 Kej 141.84 34.27 24.16 -0.81 0.9 15 Majalgaon 148.37 38.41 25.89 -1.2 0.51 16 Patoda 128.4 36.82 28.68 -0.3 1.48 17 Parli 148.31 41 27.65 -1.09 0.42 18 Shirur 133.2 37.8 28.38 -0.38 -0.38 19 Wadawani 158.81 50.01 31.49 -0.24 -1.2 20 Ambad 137 39.55 28.87 -0.53 0.45 21 Badanapur 139.74 46.26 33.11 -0.89 0.51 22 Bhokardan 127.78 46.81 36.63 -0.56 -0.9 23 Ghansawangi 143.09 47.67 33.31 -0.2 -0.41 24 Jafrabad 133.21 47.77 35.86 -0.37 0.23 25 Jalna-City 140.57 50.83 36.16 -0.88 0.47 26 Mantha 141.69 43.39 30.63 -0.74 -0.61 27 Partur 147.06 49.74 33.82 -0.78 -0.54 28 Ahemadpur 164.52 60.08 36.52 -0.65 -0.45
29 Ausa 137.63 45 32.7 -0.18 -0.25
30 Chakur 177.6 68.4 38.5 -0.65 -0.46 31 Dewani 174.31 57.14 32.78 -0.61 -0.88 32 Latur 145.43 45.48 31.28 -0.44 -0.27 33 Nilanga 146.11 51.43 35.2 0.26 0 34 Renapur 141.39 50.72 35.87 -0.57 -0.25 35 Shirur-Anatmal 150.99 49.93 33.07 0.28 -0.29 36 Udgir 159.54 52.18 32.71 -0.72 -0.63
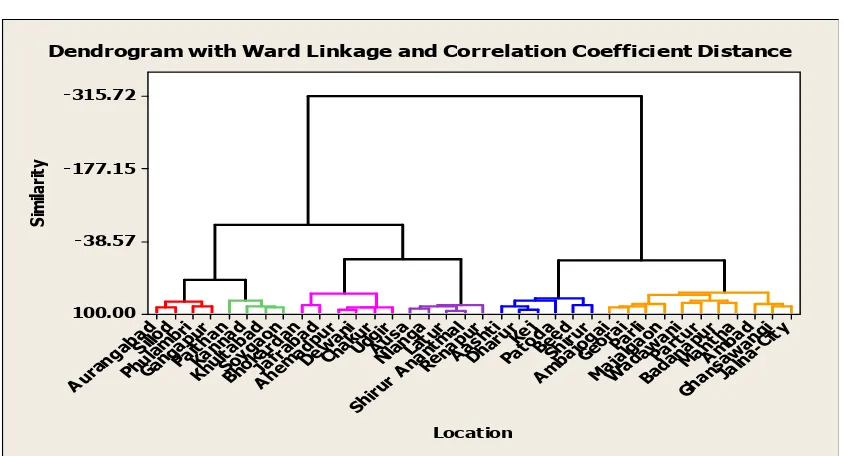
Fig (1) Dendrogram of Ward linkage for selected rainfall station
Based on the dendrogram of Ward linkage method is finally classified following six clusters based on most similarity.
Cluster 1: Aurangabad, Phulambri, Gangapur , Sillod.
Cluster 2 : Paithan , Kannad , Khultabad , Soygao.
Cluster 3 : Aashti,,Beed,,Dharur,,Kej,Patoda,,Shirur.
Cluster 4 : Ambajogai,Georai,Majalgaon,Parli,Wadawani,Ambad, ,Badanapur,Ghansawangi , Jalna-City ,Mantha, Partur.
Cluster 5 : Bhokardan,Jafrabad,Ahemadpur,Chakur,Dewani,Udgir.
Cluster 6: Ausa,,Latur,,Nilanga,,Renapur,,Shirur-Anantmal.
Table( 2) Amalgamation results of wards method
No of cluster
Similarity level (%)
distance level
1 -315.725 8.3145
2 -70.42 3.40841 3 -2.453 2.04905 4 -1.326 2.02652 5 36.557 1.26887 6 59.804 1.26887
In the table 2 result shows that cluster no 1& 2 have less similarity level & maximum distance.
Complete linkage method was applied to 40 years of rainfall data with 36 locations. The result show that metrological station is classify with six clusters on the basis of dendrogram. The fig (2) represents dendrogam of six cluster of complete linkage method.
Location
Si
m
ila
rit
y
Jalna -City
Ghan sawa
ngi A mba
d Mant
ha
Bada napu
r Partu
r
Wad awan
i
Maja lgaon Parli Geor
ai
Amba joga
i Shiru
r Beed Pato
da Kej Dhar
ur Aash
ti
Rena pur
Shiru r Ana
ntma l Latu
r Nilan
ga Ausa Udgir Chak
ur Dewa
ni
Ahem adpu
r
Jafra bad Bhok
arda n
Soyg aon Khult
abad Kann
ad Paith
an Gang
apur Phula
mbri Sillod Aura
ngab ad
-315.72
-177.15
-38.57
100.00
Fig(2) Dendrogram of complete linkage for selected rainfall station
Based on the dendrogram of complete linkage method is finally classified following six clusters based on most similarity.
Cluster 1: Aurangabad ,Phulambri, Gangapur ,Sillod.
Cluster 2: Paithan, Kannad , Khultabad , Soygaon.
Cluster 3: Aashti, Ambajogai, Beed, Dharur, Georai, Kej ,Majalgaon ,Patoda, Parli ,Shirur.
Cluster 4: Wadawani, Ambad ,Badanapur , Ghansawangi, Jalna-City , Mantha , Partur.
Cluster 5:Bhokardan,Jafrabad,Ahemadpur,Chakur,Dewani,Udgir.
Cluster 6:Ausa,Latur,Nilanga,Renapur,ShirurAnantmal.
Table( 3) Amalgamation results of complete linkage method.
No of cluster
Similarity level (%)
distance level
1 20.0464 1.59907 2 41.6008 1.16798 3 52.9516 0.94097 4 53.9548 0.9209 5 57.0764 0.85847 6 63.8391 0.72322
In the table 3 result shows that cluster no 5& 6 have high similarity with minimum distance level. The cluster 5&6 similarity level is .approximately 64 %.
Average linkage method was applied to 40 years of rainfall data with 36 locations. The result show that metrological station is classify with six clusters on the basis of dendrogram. The fig (3) represents dendrogam of six cluster of average linkage method.
Location
Si
m
ila
rit
y
Mant ha
Jalna -City
Ghan sawa
ngi A mba
d
Bada napu
r Partu
r
Wad awan
i Beed Maja
lgaon Parli Geor
ai
Amba joga
i
Pato da Shiru
r Kej Dhar
ur Aash
ti Udgir Chak
ur Dewa
ni
Ahem adpu
r
Jafra bad
Bhok arda
n
Rena pur
Shiru r Ana
ntma l Latu
r Nilan
ga Ausa Soyg
aon Khult
abad Kann
ad Paith
an
Gang apur Phula
mbri Sillod
Aura ngab
ad
20.05
46.70
73.35
100.00
Fig(3)) Dendrogram of average linkage for selected rainfall station
Based on the dendrogram of average linkage method is finally classified following six clusters based on most similarity.
Cluster 1: Aurangabad ,Phulambri ,Gangapur, Sillod. Cluster 2: Paithan ,Kannad , Khultabad , Soygaon. Cluster 3: Aashti, Beed ,Dharur, Kej, Patoda ,Shirur.
Custer 4 : Ambajogai ,Georai, Majalgaon ,Parali, Wadawani ,Ambad ,Badanapur,Ghansawangi, Jalna- City ,Mantha, Partur
Cluster 5:Bhokardan,Jafrabad,Ahemadpur,Chakur,Dewani,Udgir. Cluster 6:Ausa,Latur,Nilanga,Renapur,Shirur,Anantmal.
Table(4 ) Amalgamation results of average linkage method
No of cluster
Similarity level (%)
distance level
1 50.5507 0.988986 2 61.7122 0.765756 3 69.9631 0.600737 4 70.247 0.59506 5 72.7946 0.544108 6 75.4355 0.491291
In the table 4 result shows that cluster no 5& 6 have high similarity with minimum distance level. The cluster 5&6 similarity level is approximately 76%. In this method all cluster greater than 50% of similarity level.
Location
Si
m
ila
rit
y
Part ur Mant
ha
Bada napu
r
Jalna -City
Ghan sawa
ngi Amba
d
Wad awan
i
Majal gaon Parli Geor
ai
Amba jogai Pato
da Beed Shiru
r Kej Dhar
ur Aash
ti
Rena pur
Shiru r Ana
ntma l Latu
r Nilan
ga Ausa Udgir Chak
ur Dewa
ni
Ahem adpu
r
Jafra bad
Bhok arda
n
Soyg aon Khult
abad Kann
ad Paith
an
Gang apur Phula
mbri Sillod
Aura ngab
ad
50.55
67.03
83.52
100.00
Median linkage method was applied to 40 years of rainfall data with 36 locations. The result show that metrological station is classify with three clusters on the basis of dendrogram. The fig (4) represents dendrogam of three cluster of median linkage method.
Fig(4)Dendrogram of Median linkage for selected rainfall station.
Based on the dendrogram of median linkage method is finally classified following three clusters based on most similarity.
Cluster1: Aurangabad , Phulambri ,Gangapur, Paithan, Kannad ,Khultabad ,Patoda ,Parali Shirur, Wadawani ,Ambad ,Badanapur, Ghanswangi, Jalna-City , Mantha ,Partur .
Cluster 2: Bhokardan ,Jafrabad , Ahemadpur , Chakur , Dewani, Udgir.
Cluster 3: Ausa ,Latur , Nilanga, Renapur , Shiru-Anantmal.
Table( 5) Amalgamation results of median linkage method
No of cluster
Similarity level (%)
distance level
1 73.6739 0.526521 2 75.3681 0.492638 3 80.0861 0.398278
In the table 5 result shows that cluster no 2& 3 have high similarity with minimum distance level. The cluster 2&3 similarity level is .approximately 80%. In this method all cluster greater than 74% of similarity level.
Single linkage method was applied to 40 years of rainfall data with 36 locations. The result show that metrological station is classify with three clusters on the basis of dendrogram. The fig (5) represents dendrogam of three cluster of single linkage method.
Location
Si
m
ila
ri
ty
Rena pur Nilan
ga
Shiru r Ana
ntma l Latu
r Ausa Jafra
bad Udgir Chak
ur Dewa
ni
Ahem adpu
r
Bhok arda
n Pato
da Beed Shiru
r Kej Dhar
ur Aash
ti
Bada napu
r Partu
r
Wad awan
i
Mant ha
Jalna -City
Ghan sawa
ngi Amba
d
Maja lgaon Parli Geor
ai
Amba joga
i
Soyg aon
Khult abad Kann
ad Paith
an
Gang apur Phula
mbri Sillod
Aura ngab
ad 73.67
82.45
91.22
100.00
Fig(5)Dendrogram of Single linkage for selected rainfall station.
Based on the dendrogram of single linkage method is finally classified following three clusters based on most similarity.
Cluster 1 : Aurangabad ,Phulambri ,Gangapur, Paithan, Kannad, Khultabad, Sillod, Soygaon..
Cluster 2: Aashti, Ambajogai ,Beed, Dharur, Georai, Kej ,Majalgaon, Patoda Parli ,Shirur, Wadawani, Ambad, Badanapur, Ghansawangi ,Jalna-City ,Mantha Partur.
Cluster 3: Bhokardan, Jafrabad, Ahemadpur, Ausa, Chakur, Dewani, Latur, Nilanga Renapur, shirur–Anantmal, Udgir
.
Table( 6) Amalgamation results of average linkage methodNo of cluster
Similarity level (%)
distance level
1 73.3305 0.53339 2 79.2355 0.41529 3 81.127 0.377461
In the table 6 result shows that cluster no 2& 3 have high similarity with minimum distance level. The cluster 2&3 similarity level is .approximately 82%. In this method all cluster greater than 73% of similarity level.
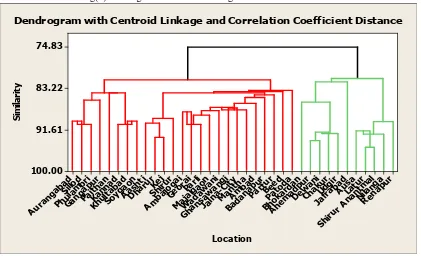
Centroid linkage method was applied to 40 years of rainfall data with 36 locations. The result show that metrological station is classify with two clusters on the basis of dendrogram. The fig (6) represents dendrogam of two cluster of centroid linkage method.
Location
Si
m
ila
ri
ty
Rena pur Nilan
ga
Shiru r An
antm al Latu
r Ausa Jafr
abad Chak
ur Udgi
r
Dew ani
Ahem adpu
r
Bhok arda
n Part
ur Mant
ha Pato
da
Bada napu
r
Maja lgaon Wad
awan i
Jaln a-Cit
y
Ghan saw
angi Amba
d Parli Geor
ai
Amba joga
i Beed Shiru
r Kej Dhar
ur Aash
ti
Paith an
Soyg aon
Khult abad Kann
ad
Gang apur Phul
ambr i Sillo
d
Aura ngab
ad
73.33
82.22
91.11
100.00
Fig(6)Dendrogram of centroid linkage for selected rainfall station.
Based on the dendrogram of centroid linkage method is finally classified following two clusters based on most similarity.
Cluster 1: Aurangabad, Phulambri, Gangapur, Paithan, Kannad , Khultabad, Sillod , Soygaon, Aashti, Ambajogai, Beed ,Dharur, Georai , Kej , Majalgaon, Patoda , Parli, Shirur ,Wadawani, Ambad Badanapur, Ghansawangi, Jalna-City , Mantha ,Partur.
Cluster 2: Bhokardan, Jafrabad, Ahemadpur, Ausa, Chakur ,Dewani , Latur , Nilanga, Renapur, Shirur-Anantmal, Udgir.
Based on the dendrogram of centroid linkage method is classify following two clusters based on most similarity. Table ( 7) Amalgamation results of average linkage method
No of cluster
Similarity level (%)
distance level
1 74.8305 0.50339 2 81.217 0.37566
In the table 7 result shows that cluster no 1& 2 have high similarity with minimum distance level. The cluster 1&2 similarity level is .approximately 82%. In this method all cluster greater than 74% of similarity level.
McQuitty linkage method was applied to 40 years of rainfall data with 36 locations. The result show that metrological station is classify with two clusters on the basis of dendrogram. The fig (7) represents dendrogam of two cluster McQuitty linkage method.
Location
Si
m
ila
ri
ty
Rena pur Nilan
ga
Shiru r Ana
ntma l Latu
r Ausa Jafra
bad Udgir Chak
ur Dewa
ni
Ahem adpu
r
Bhok arda
n Pato
da Beed Partu
r
Bada napu
r Amba
d
Mant ha
Jalna -City
Ghan sawa
ngi
Wad awan
i
Maja lgaon Parli Geor
ai
Amba joga
i Shiru
r Kej Dhar
ur Aash
ti
Soyg aon
Khult abad Kann
ad Paith
an
Gang apur Phula
mbri Sillod
Aura ngab
ad 74.83
83.22
91.61
100.00
Fig(7)Dendrogram of McQuitty linkage for selected rainfall station.
Based on the dendrogram of McQuitty linkage method is finally classified following two clusters based on most similarity.
Cluster 1 : Aurangabad ,Phulambri ,Gangapur, Paithan, Kannad, Khultabad, Sillod, Soygaon Bhokardan, Jafrabad, Ahemadpur, Ausa, Chakur , Dewani, Latur, Nilanga Renapur Shirur- Anantmal Udgir.
Cluster 2: Aashti, Ambajogai, Beed, Dharur, Georai, Kej , Majalgaon ,,Patoda , Parli ,Shirur, Wadawani Ambad , Badanapur ,Ghansawangi , Jalna-City , Mantha, Partur.
Based on the dendrogram of centroid linkage method is classify following two clusters based on most similarity
.
Table( 8) Amalgamation results of McQuitty linkage method
In the table 8 result shows that cluster no 1& 2 have high similarity with minimum distance level. The cluster 1&2 similarity level is .approximately 60%. In this method all cluster less than 60% of similarity level
V.CONCLUSION
This study aimed to classify rainfall data of 36 metrological stations in Marathwada region by using seven cluster analysis techniques. It was found that Ward method, McQuitty &complete linkage method was classified rainfall
Location
Si
m
ila
ri
ty
Mant ha
Bada napu
r
Jalna -City
Ghan sawa
ngi Amba
d Partu
r
Wad awan
i
Maja lgaon Parli Geor
ai
Amba joga
i
Pato da Beed Shiru
r Kej Dhar
ur Aash
ti
Rena pur
Shiru r Ana
ntma l Latu
r
Nilan ga Ausa Udgir Chak
ur Dewa
ni
Ahem adpu
r
Jafra bad
Bhok arda
n
Soyg aon
Khult abad Kann
ad Paith
an
Gang apur Phula
mbri Sillod
Aura ngab
ad
50.43
66.95
83.48
100.00
Dendrogram with McQuitty Linkage and Correlation Coefficient Distance
No of cluster
Similarity level (%)
distance level
linkage was classified rainfall station into three clusters with greater than 73% similarity level and minimum distance. The centroid linkage was classified rainfall station into two clusters with greater than 74% similarity level and minimum distance. The comparison of seven cluster analysis techniques this study finally it was found that two techniques such as single linkage ¢roid linkage was appropriate method for classify the rainfall data of selected metrological station of Marathwada region.
REFERENCES
.
[1] Baldwin M E ,Lakshmivarahan. S” Rainfall classification using histogram analysis an example of data mining in meteorology”, Technical Report, School of Computer Science, University of Oklahoma, Norman,OK.342 ,2002
[2] Gong X, Richman M.B. “On the application of cluster analysis to growing season precipitation data in North America east of the Rockies”, Journal of Climate 8: 897–931, 1995.
[3] Dyeret T.G.J. “Assignment of stations into homogeneous groups”, Quarterly Journal of the Meteorological Society, 101, 1005-1012. (1975). [4] .Jobson, J. D.”Applied Multivariate Data Analysis”, Vol. II: Categorical and Multivariate Methods. Springer-Verlag, 731 pp, 1992
[5] Ramos, M.C.” Divisive and hierarchical clustering techniques to analyze variability of rainfall distribution patterns in a Mediterranean region”,J. Hydrol. 57, 123–138. 2001.
[6] Jackson, I.J., Weinand, H,”Classification of tropical rainfall stations: a comparison of clustering techniques. Int. J. Climatol. 15, 985– 994,1995.
Kalkstein LS, Tan GR, Skindlov JA.” An evaluation of 3 clustering procedures for use in synoptic climatologically classification”, Journal of Climate and Applied Meteorology 26: 717–730, 1987.
[7] Johnson RA, Wichern DW.” Applied multivariate statistical analysis” 4th ed., New Jersey: Prentice Hall, New Jersey, p. 616, 1998. [8] Nathan, R.J., McMahon, T.A., “Identification of homogeneous regions for the purpose of regionalization.” J. Hydrol. 121, 217–238, 1990. [9] Kulkarni B S ,Damodara Reddy “The cluster analysis approach for classification of Andhra Pradesh on the basis of rainfall” Mausam 45(4)
325–332, D 1994
[10] Missourian S.A, Geographic distribution of precipitation in Iran bay rotated PCA, Journal of Geography and Development, 1:79-88, 2003. [11] Masoodian S.A,,”Regionalization of Precipitation Regimes of Iran Using Cluster Analysis”, Journal of Research in Geography, 52:47-61,
2005
[12] Singh, C.V.” Principal components of monsoon rainfall in normal, flood and drought years over India”. Int. J. Climatol. 19, 639–652,1999. [13] Sarah N. Kohail, Alaa M. El-Halees, “Implementation of Data Mining Techniques for Meteorological Data Analysis”, IJICT Journal
Volume 1 No. 3, July 2011.
[14] Klein W. Statistical forecast of local weather by means of model output statistics (MOS) in objective weather forecasting. Journal of Applied Meteorology 11: 1203–1211, 1978.
[15] Ward JH. “Hierarchical grouping to optimize an objective function” Journal of the American Statistical Association . vol. 58(301): 236-244,1963