1556-6811/09/$12.00
doi:10.1128/CVI.00263-09
Copyright © 2009, American Society for Microbiology. All Rights Reserved.
Human Immune Proteome in Experimental Colonization with
Staphylococcus aureus
䌤
†
Silva Holtfreter,
1Thi Thu Hoai Nguyen,
1Heiman Wertheim,
2,3Leif Steil,
4Harald Kusch,
5Quoc Phong Truong,
4Susanne Engelmann,
5Michael Hecker,
5Uwe Vo
¨lker,
4Alex van Belkum,
2and Barbara M. Bro
¨ker
1*
Institute of Immunology and Transfusion Medicine,
1Interfaculty Institute of Genetics and Functional Genomics,
4and Institute of
Microbiology and Molecular Biology,
5University of Greifswald, Greifswald, Germany; Department of Medical Microbiology and
Infectious Diseases, University Medical Center, Rotterdam, The Netherlands
2; and Oxford University Clinical Research Unit,
National Institute of Infectious and Tropical Diseases, Bach Mai Hospital, Hanoi, Vietnam
3Received 10 June 2009/Returned for modification 28 July 2009/Accepted 9 September 2009
More than 20% of adults are persistently colonized with
Staphylococcus aureus.
When hospitalized, these
carriers have increased risks of infection with their own strains. However, a recent study demonstrated a lower
incidence of bacteremia-related death among carriers than among noncarriers, raising the question whether
the adaptive immune system plays a protective role. In fact,
S. aureus
carriers mount a highly specific
neutralizing antibody response against superantigens of their colonizing strains. We now used 2-dimensional
immunoblotting to investigate the profiles of antibodies from healthy individuals against
S. aureus
extracellular
proteins. Moreover, we tested whether symptom-free experimental colonization of these individuals with an
S.
aureus
strain of low virulence, 8325-4, is sufficient to induce an antibody response. Sera obtained before and
4 weeks after colonization were screened for immunoglobulin G (IgG) antibody binding to extracellular
staphylococcal proteins. At baseline, most volunteers harbored IgG directed against conserved virulence
factors, including alpha-hemolysin (Hla), beta-hemolysin (Hlb), phospholipase C (Plc), staphylococcal serine
protease (SspA), and cysteine protease (SspB). However, the variability of spot patterns and intensities was
striking and could be important in case of infection. Experimental nasal colonization with
S. aureus
8325-4 did
not elicit new antibodies or boost the humoral response. Thus, the high antibody prevalence in humans is likely
not induced by short-term nasal colonization, and presumably minor infections are required to trigger anti-
S.
aureus
antibody responses.
Staphylococcus aureus
is one of the most common causes of
nosocomial infection, and the species is becoming increasingly
resistant to antibiotics (2). Apart from being a major human
pathogen,
S. aureus
is also a frequent colonizer of human skin
and mucosa (34). The bacteria find their primary ecological
niche in the human nose but are also able to colonize the
throat, the intestines, and the perineal region, sometimes
ex-clusively (1, 17). Approximately 20% of the adult population
carry
S. aureus
in the nose persistently, and another 30% carry
it intermittently, frequently only for a few days, whereas 50%
are noncarriers (NC) (29, 30, 34). Nasal carriers stand an
increased risk of developing severe
S. aureus
infections caused
by their autologous strains, especially upon hospitalization or
immune suppression (32, 35). This underlines the fact that host
and environmental factors play a decisive role in determining
the outcome of
S. aureus
host interactions.
In a recent large prospective study, carriers acquired
S.
au-reus
bacteremia more frequently than NC but, surprisingly, had
a better survival rate than NC (35). This observation raises the
question whether the adaptive immune system establishes
im-munity to the colonizing
S. aureus
strain, which could be of
advantage in autologous infections. In support of this
hypoth-esis, our group recently showed that
S. aureus
carriers raise a
strong and strain-specific antibody response against the
super-antigen cocktail produced by their colonizing strain (12).
How-ever,
S. aureus
produces a broad repertoire of virulence
fac-tors, and the antibody response against superantigens is likely
only the tip of an iceberg (8). In fact, anti-
S. aureus
antibodies
against staphylococcal toxins, immune evasion molecules, and
adhesins have been detected in healthy individuals as well as in
patients (6, 7, 11, 31).
Virulence factor expression is strictly regulated in
S. aureus
.
While adhesins are expressed by bacterial cells in logarithmic
growth, the majority of known virulence factors, including most
superantigens but also cytolytic toxins, proteases, lipases, and
several immune evasion molecules, are secreted in the
post-exponential-growth phase (23, 38). In contrast to intracellular
and cell wall-associated proteins, secreted virulence factors can
act systemically while bacteria remain localized. Consequently,
these factors are the most likely stimuli of the adaptive
im-mune system during epithelial colonization with
S. aureus
(28).
To date, a comprehensive investigation of anti-
S. aureus
antibody profiles from healthy individuals and their variability
is still lacking. Moreover, it remains unknown which conditions
(e.g., nasal colonization, minor or major infections) are
re-quired to trigger an antibody response against
S. aureus
.
Therefore, we experimentally colonized the nares of 16 healthy
human volunteers with
S. aureus
(36) and compared the anti-
S.
* Corresponding author. Mailing address: Institut fu
¨r Immunologie
und Transfusionsmedizin, Universita
¨t Greifswald, Neubau P,
Sauer-bruchstrasse, D-17487 Greifswald, Germany. Phone: 49 3834 86 55 95.
Fax: 49 3834 86 54 90. E-mail: [email protected].
† Supplemental material for this article may be found at http://cvi
.asm.org/.
䌤
Published ahead of print on 16 September 2009.
1607
on August 17, 2020 by guest
http://cvi.asm.org/
aureus
antibody profiles before and 28 days after colonization.
Our aims were to analyze the variability of the anti-
S. aureus
antibody profiles and to test whether experimental nasal
colo-nization elicits or boosts an antibody response.
MATERIALS AND METHODS
S. aureusstrains.The superantigen-negativeS. aureusstrain 8325-4 was used for experimental nasal colonization of human volunteers as described previously (36). The genome sequence of the original 8325 strain is available at http://www .genome.ou.edu (NCBI database, accession no. NC_007795). Strain 8325-4 dif-fers from strain 8325 by the absence of three prophages (20). DU5997 is a clfB-deficient mutant of 8325-4, and 8325-4⌬spais a protein A-deficient mutant of 8325-4 (21, 36).
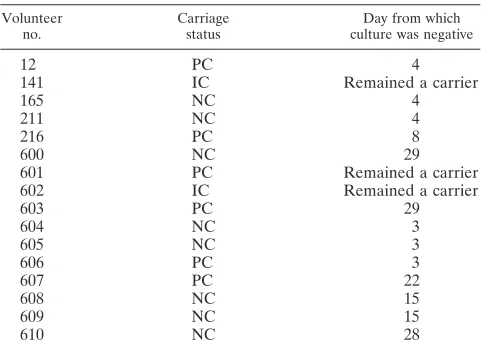
Study design and human experimental colonization.Wertheim et al. con-ducted a human experimental colonization study of 16 healthy volunteers (36). Among them were six persistent carriers (PC), two intermittent carriers (IC), and eight NC (Table 1). In short, all enrolled volunteers underwent a decolonization treatment with mupirocin 5 weeks before experimental colonization. Volunteers were inoculated with a mixture ofS. aureusstrains 8325-4 and DU5997 (⌬clfB) in one nostril and with either 8325-4 or DU5997 in the other nostril (1⫻107
CFU of each strain). Follow-up cultures were performed on days 1, 2, 3, 4, 8, 15, 22, 28, and 29 after inoculation.
Sera.Serum samples were obtained from all 16 volunteers directly before experimental inoculation and 28 days afterwards. Sera were aliquoted and stored at⫺80°C.
Growth conditions of bacteria and preparation of protein extracts.In this study,S. aureusstrain NCTC8325-4 and its isogenicspamutant DU5875 (8325-4 ⌬spa) were used. For the preparation of protein extracts,S. aureus8325-4 and its isogenicspamutant were inoculated into tryptic soy broth to an optical density at 540 nm (OD540) of 0.05 and were cultivated in 1.5 liters of tryptic soy broth at
37°C and 110 rpm until the bacterial culture entered the stationary phase at an OD540of 8 to 10.
For preparation of the extracellular protein fraction,S. aureus cells were removed by centrifugation (9,164⫻gfor 10 min at 4°C), and extracellular proteins from three 1.5-liter culture supernatants were precipitated by addition of trichloroacetic acid to 10% (wt/vol) and centrifugation at 9,164⫻gfor 1 h at 4°C. Protein-containing pellets were then washed six times with 70% ethanol. After the final washing step, 100% ethanol was added and then removed by centrifugation (5 min, 16,060⫻g, 4°C), and the protein pellet was air dried and finally resolved in rehydration buffer containing 8 M urea, 2 M thiourea, and 2% CHAPS {3-[(3-cholamidopropyl)-dimethylammonio]-1-propanesulfonate}. The protein concentration was determined according to Bradford (3) with a com-mercially available kit (Pierce, Thermo Scientific, Bonn, Germany). Sample aliquots were stored at⫺80°C.
Two-dimensional (2D) polyacrylamide gel electrophoresis (PAGE) with 2D minigels.Isoelectric focusing was done with 7-cm Immobiline dry strips (GE Healthcare, Munich, Germany) with the pH ranges 4 to 7 and 6 to 11. For separations in the pI range from 4 to 7, strips were rehydrated overnight in 150
l rehydration solution (8 M urea, 2 M thiourea, 33 mM CHAPS, 28 mM dithiothreitol [DTT], 2% Pharmalyte 3–10 carrier ampholytes, and a trace of bromophenol blue) containing 30g of protein extract. Strips were placed in a Multiphor II horizontal electrophoresis system (GE Healthcare), and proteins were separated at 20°C at a maximum of 2 mA and 5 W per strip by applying the following voltage profile: 200 V constant for 1 min, a gradient from 200 V to 3,500 V for 1.5 h, and 3,500 V constant for 1.5 h (total, 8,000 V䡠h).
For separations in the pI range from 6 to 11, strips were rehydrated overnight in 150l rehydration solution (8 M urea, 2 M thiourea, 10% [vol/vol] isopropa-nol, 5% [vol/vol] glycerol, 162 mM DTT, 1% [vol/vol] Pharmalyte 3–10, 1% [vol/vol] Pharmalyte 8.5–10.5, and a trace of bromophenol blue) without pro-teins, and 30g of crude protein extract was loaded with the aid of sample cups at the anode. The isoelectric focusing was done in a Multiphor II device at 20°C, 2 mA, and 5 W with the following voltage profile: 200 V constant for 1 min, a gradient from 200 V to 3,500 V for 1.5 h, and 3,500 V constant for 1 h 5 min (total, 6,500 V䡠h). After isoelectric focusing, the strips were either frozen for storage or immediately equilibrated with solution A (20% [vol/vol] glycerol, 0.375 M Tris-HCl [pH 8.8], 6 M urea, 4% [wt/vol] sodium dodecyl sulfate [SDS], and 65 mM DTT) and solution B (20% [vol/vol] glycerol, 0.375 M Tris-HCl [pH 8.8], 6 M urea, 4% [wt/vol] SDS, 135 mM iodoacetamide, and a trace of bromo-phenol blue) for 15 min each. Separation according to apparent molecular weight by SDS-PAGE in the second dimension was performed for 12 samples in parallel on 12.5% PAGE gels using a vertical Mini Protean II Multi cell (Bio-Rad, Munich, Germany) at a constant power of 10 mA per gel for 30 min and then at 15 mA for 90 min.
2D Western blot analysis.The pH range 6 to 11 was probed with extracellular proteins of theS. aureusstrain 8325-4. 2D immunoblotting (2D-IB) for the pH range 4 to 7 was performed with extracellular proteins from 8325-4⌬spain order to avoid a high background due to immunoglobulin G (IgG) binding by protein A. The two strains produced very similar patterns of extracellular proteins, except for the difference in protein A (data not shown).
Thirty micrograms of extracellular proteins was separated on 12.5% 2D mini-gels as described above and was transferred to a polyvinylidene difluoride mem-brane for Western blotting using a semidry blotting device (Milliblot graphic electroblotter II; Millipore, Billerica, MA) according to the manufacturer’s in-structions. The quality of transfer was controlled by reversible staining with Pelikan Ink solution (10). After destaining, membranes were blocked with a solution of 5% nonfat dry milk in TBS-T buffer (Tris-buffered saline–Tween, comprising 20 mM Tris-HCl, 137 mM NaCl, and 0.1% [vol/vol] Tween 20 [pH 7.6]) for 1 h at room temperature. After five washes with TBS-T buffer, the membranes were incubated with the human sera overnight at 4°C (diluted 1:10,000 in 5% [wt/vol] bovine serum albumin in TBS-T). Bound human IgG was detected by incubation with peroxidase-conjugated goat anti-human IgG(H⫹L), diluted 1:50,000 in blocking buffer for 1 h at room temperature. After a wash, the membranes were incubated with the SuperSignal West Femto maximum-sensi-tivity substrate (Pierce) for 5 min, before signals were detected with a Lumi-Imager (Roche, Mannheim, Germany). With a 1-min recording time, both weak and strong signals were in the linear range.
Serum samples before and 28 days after colonization from one volunteer were always analyzed in the same experiment. Each serum was tested in two to four technical replicates in independent experiments. To monitor reproducibility, a pool of all 32 sera was applied in parallel throughout the experiments. Spot intensity was quantified with good reproducibility: the level of variation of total spot intensity of technical replicates was around 30% (data not shown).
Spot detection, quantitation, and identification.The 2D-IB images were an-alyzed with the Delta-2D software package, version 3.4 (Decodon GmbH, Grei-fswald, Germany). All IB images were matched to a master IB, which was developed with a pool of all 32 sera. A fused image was obtained using the union fuse option. Spots on the fused gel image were automatically detected and manually validated by comparing the original gel images with the fused gel image. Subsequently, the spot map and the corresponding labels of the fused gel image were transferred to all gel images included in the project, thus ensuring uniform analysis throughout the study. Spot intensities were calculated based on the areas and pixel intensities of spots. The intensity values (spot volumes) were corrected based on the local background. Spot intensities are given as the median⫾interquartile range of background-corrected raw values of technical replicates. Because sera differed strongly in signal intensity, we did not perform normalization based on the total signal intensity but analyzed the raw volume data instead.
Highly basic proteins (pH⬎9.8) were blotted to polyvinylidene difluoride membranes with different efficiencies. Therefore, the 29 most basic protein spots (pI⬎9.8) were excluded from data analysis, including spots corresponding to
TABLE 1. Characteristics of volunteers
Volunteer no.
Carriage status
Day from which culture was negative
12
PC
4
141
IC
Remained a carrier
165
NC
4
211
NC
4
216
PC
8
600
NC
29
601
PC
Remained a carrier
602
IC
Remained a carrier
603
PC
29
604
NC
3
605
NC
3
606
PC
3
607
PC
22
608
NC
15
609
NC
15
610
NC
28
on August 17, 2020 by guest
http://cvi.asm.org/
autolysin (Atl), autolysin precursor (Aaa), immunodominant antigen B (IsaB), and iron-regulated surface determinant protein A (IsdA).
To reveal the proteins behind the IB spots, a reference map on which protein spots were identified was matched with the master IB containing the spot map and corresponding spot labels in Delta-2D. By these means, protein names could be assigned to 44% (52/117) and 36% (43/119) of the IB spots for pH 6 to 11 and pH 4 to 7, respectively (see Fig. S2 in the supplemental material).
Statistics.Statistical analyses were performed with GeneSpring, version 3.7.1. Graphs were created with GraphPad Prism, version 5. Medians are given with their interquartile ranges. For each spot, the median spot intensity of technical replicates was calculated from the replicates. “Strong” IB signals were defined as the top 10% of all spots from all 16 volunteers (cutoff, 5.6 Gy).
Nonparametric correlations (Mann-Whitney U test, GeneSpring) were esti-mated for comparison of median spot intensities ofS. aureuscarriers and NC on the single-spot level.P-values (two-tailed) below 0.05 were considered statisti-cally significant.
To reveal colonization-induced changes in the IB spot intensities, we calcu-lated the median ratios (post- versus precolonization) of two to four technical replicates. We applied stringent selection criteria and defined the change in IB spot intensity as significant only if (i) the median intensity ratio between post-and precolonization sera exceeded 5, (ii) the intensity ratio exceeded 2.5 in at least two technical replicates, and (iii) the difference between the spot intensities of post- and precolonization sera was more than two times the standard deviation of the spot intensity of precolonization sera.
RESULTS
Our investigations were performed in the context of an
ex-perimental colonization study that compared the adherence
and colonization properties of
S. aureus
8325-4 and its isogenic
clumping factor B mutant (36). 8325-4 is a laboratory strain
with low virulence and without superantigen genes; it was
cho-sen for safety reasons. As expected, all volunteers remained
completely free from clinical symptoms (36). Sera obtained
from these volunteers before and 4 weeks after the
coloniza-tion were used to investigate the anti-
S. aureus
IgG profiles in
healthy adults.
High variability of baseline IgG binding to
S. aureus
anti-gens.
Because
S. aureus
releases many virulence factors,
in-cluding hemolysins, proteases, and superantigens, into the
ex-tracellular space, especially during post-exponential growth
(37), we focused our investigation on serum IgG binding to
these antigens. We used 2D-IB to obtain a comprehensive
picture of the anti-
S. aureus
antibody profiles against the
post-exponential-phase extracellular proteome of
S. aureus
strain
8325-4. Before experimental colonization, we found marked
interindividual variation in baseline IgG binding when we
probed 2D blots with the precolonization sera from the 16
volunteers. Six representative cases are depicted in Fig. 1,
which shows serum IgG binding to bacterial proteins resolved
in the pH ranges 6 to 11 (A) and 4 to 7 (B) (all results are given
in Fig. S1 in the supplemental material). The strong
heteroge-neity in IB patterns comprised total IgG binding, spot patterns,
and spot intensity.
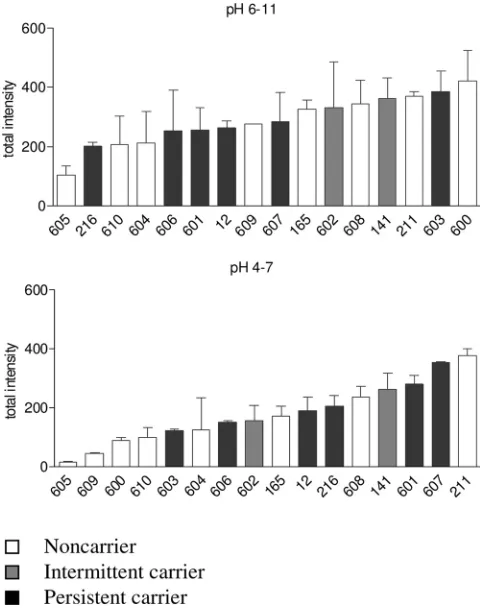
The total IgG binding, i.e., the sum of spot intensities,
dif-fered between individuals up to a factor of 20 in the pH range
from 4 to 7 and a factor of 3.6 in the pH range from 6 to 11,
where more immune-reactive proteins were present (Fig. 2).
S.
aureus
carriers and NC did not differ significantly in total IgG
binding, but the numbers are small. Moreover, total IgG
bind-ing did not correlate with persistence of strain 8325-4 in the
nose following experimental colonization (data not shown).
Individuals differed strongly in their spot patterns and spot
intensities (Fig. 1). For example, serum 605 reacted only with
a few staphylococcal proteins, especially in the pH range from
4 to 7, while serum 211 contained high titers of IgG against a
range of staphylococcal exoproteins, including the immune
dominant staphylococcal protein A (IsaA).
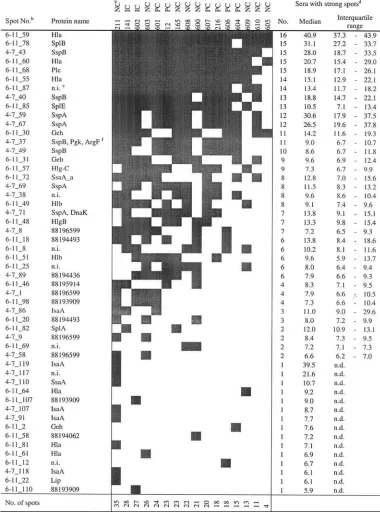
As a measure for immune dominance, we identified the 10%
of spots that were strongest on all 2D-IBs (cutoff, 5.6 arbitrary
units [Au]). In Table 2 we provide an overview of their
distri-bution. The spots (rows) were ranked by their frequencies
among the 16 volunteers. Similarly, volunteers were ranked by
their numbers of strong spots (columns). At the top of Table 2
are proteins with strong IgG binding in many individuals.
These spots represent the pattern of immune dominance or the
core immune proteome of
S. aureus
8325-4. Most
immune-reactive proteins could be identified by matching the IBs with
the protein reference maps of strain 8325-4 (for annotated
reference blots, see Fig. S2 in the supplemental material).
Among the 10% strongest spots that were present in at least
75% (12/16) of all individuals, we found the virulence factors
alpha-hemolysin (Hla), cysteine protease (SspB),
phospho-lipase C (Plc), serine protease-like proteins B and E (SplB,
SplE), and staphylococcal serine protease (V8 protease;
SspA). These virulence factors are highly conserved in the
species
S. aureus
.
However, there was also much interindividual variation in
spot intensities as well as in spot patterns. IgG binding to the
immune-dominant antigens differed between individuals by
factors of 2.3 (6-11_68; Plc) to 18.9 (4-7_59; SspA). The spot
with the highest intensity in every individual represents Hla
(6-11_59), which was also the most abundant spot in the
pro-tein 2D-PAGE analysis. In this single case, spot quantification
was out of the linear range. Finally, the lower part of Table 2
shows that many immune-reactive spots were present in only a
few individuals. Twenty-four of the 52 strongest spots
ap-peared in fewer than half of the volunteers, underlining the
impressive interindividual diversity in the adaptive immune
response against
S. aureus
in the healthy population.
Differences in baseline IgG binding between carriers and
NC.
The broad interindividual variability in baseline IgG
bind-ing raised the question whether antibody bindbind-ing differed
be-tween
S. aureus
carriers and NC. In fact, five spots were
stron-ger in carriers (
P
⫽
0.05 by the Mann-Whitney U test), but
none were stronger in NC (Table 3). These spots represent
IgG binding to the conserved virulence factors SspA, SspB,
and IsaA, which belong to the core immune proteome, as well
as to two unidentified proteins. SspA, SspB, and IsaA are
represented on 2D gels by several isoforms, all of which show
the same tendency, i.e., stronger serum IgG binding in carriers
than in NC.
Impact of experimental colonization on the serum IgG
re-sponse.
To test whether the observed highly variable anti-
S.
aureus
antibody profiles are induced by bacterial colonization,
we compared the sera obtained before and 4 weeks after
col-onization with
S. aureus
8325-4.
In contrast with the pronounced interindividual differences
in baseline antibody patterns, experimental colonization
in-duced only moderate changes (see Fig. S1 in the supplemental
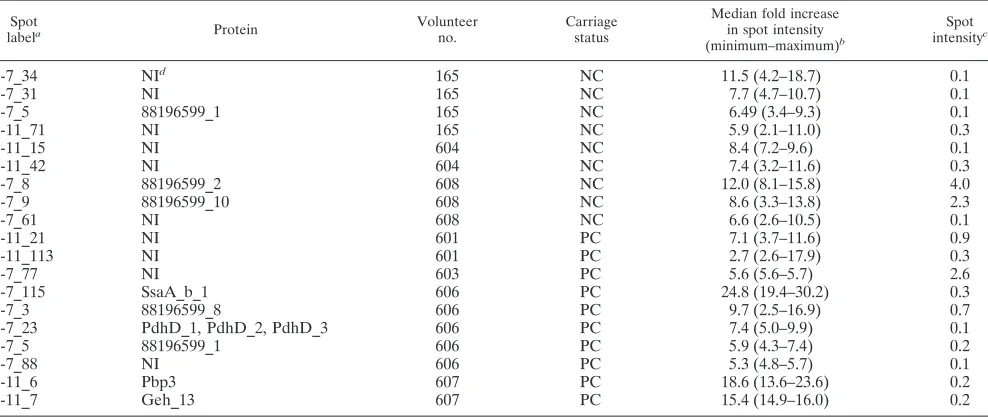
material). In total, 19 spots gained intensity by a factor of at
least 5 (Table 4). These moderate increases in IgG binding
were observed predominantly for weak spots (exceptions are
4-7_8 and 4-7_77), which also hampered spot identification.
on August 17, 2020 by guest
http://cvi.asm.org/
FIG. 1. High variability in serum IgG binding to
S. aureus
extracellular proteins in the pH ranges 6 to 11 (A) and 4 to 7 (B). IB for pH 4 to
7 was performed with extracellular proteins from 8325-4
⌬
spa
in order to avoid background due to IgG binding to protein A.
S. aureus
extracellular
proteins from cells in the stationary-growth phase were resolved by 2D-PAGE and were probed with precolonization sera from 16 volunteers. Data
for six representative individuals are shown.
on August 17, 2020 by guest
http://cvi.asm.org/
We observed no commonality in spots with increased IgG
binding, i.e., the observed serum IgG responses to
experimen-tal colonization were very individual. In line with these
find-ings, we observed no major differences in the serum IgA
re-sponse, which was analyzed in four representative probands
(see Fig. S2 in the supplemental material). In conclusion,
hu-man experimental colonization with
S. aureus
8325-4 did not
elicit a strong humoral immune response.
DISCUSSION
When we probed extracellular
S. aureus
proteins with serum
samples from 16 volunteers, we observed a broad spectrum of
anti-
S. aureus
antibodies in every individual. There was
pro-nounced interindividual variability in total IgG binding, spot
patterns, and spot intensities. Compared to this strong IgG
response, experimental nasal colonization with
S. aureus
8325-4, a laboratory strain of low virulence, induced only minor
changes in the IgG binding patterns. Similar findings were
obtained for IgA.
The study was focused on extracellular proteins, because
virulence factors are enriched in this subproteome, and
be-cause of our finding of
S. aureus
strain-specific antibody
re-sponses to superantigens (12). The fluorescence-based 2D-IB
method chosen for investigation is relatively simple, is highly
reproducible, and allows signal quantification. In contrast
to (multiplexed) enzyme-linked immunosorbent assay and
genomic expression approaches, it permits the simultaneous
analysis of the proteome of an individual
S. aureus
strain and
the serum antibody response against it. However, there are
limitations: Conformational epitopes may be denatured;
non-protein antigens are not resolved; and the assay measures
antibody binding but not function. Further studies are needed
to assess the antibody response against cell wall-associated
antigens and to correlate the observed antibody binding with
neutralizing or opsonizing properties. Moreover, due to our
study design, we may have missed exclusive throat and
intes-tinal carriers (1, 17).
The high prevalence of a broad spectrum of
antistaphylo-coccal antibodies in healthy adults can be explained by the
ubiquity of
S. aureus
. Carriers are exposed to the same
S.
aureus
strain for a long time and will experience multiple minor
invasive episodes from it. Even though NC by definition are
not constantly colonized on nasal epithelia, they will transiently
contact different
S. aureus
strains, and most individuals
expe-rience minor staphylococcal skin infections. To what degree
cross-reactive antibodies elicited by antigens from other
bac-terial species shaped the observed IgG binding patterns will
need to be addressed in the future.
The core immune proteome of
S. aureus
8325-4, defined as
strong spots that were present in at least 75% of the
individ-uals, consists of the well-known virulence factors Hla, SspB,
Plc, SplB, SplE, and SspA. These virulence factors are
con-served within the species
S. aureus
, and they appear to be
immune dominant. IgG binding to IsaA, SspA, SspB, and two
unidentified proteins was stronger in carriers than in NC. This
confirms and extends our earlier observation that
S. aureus
carriers raise a strong antibody response against the
superan-tigen cocktail produced by their colonizing strain (12).
Simi-larily, Verkaik et al. observed higher IgG titers against TSST-1
and staphylococcal enterotoxin A in persistent carriers than in
NC (31). We observed no spots that were more prominent in
NC than in carriers.
The most striking finding with our unbiased approach,
how-ever, was the high degree of variability in IgG binding to
S.
aureus
exoproteins in healthy adults. This may have been
un-derrated in studies with selected antigens or serum pools. The
data clearly show that our previous observation of a highly
heterogeneous spectrum of superantigen-neutralizing
antibod-ies in healthy adults was just the tip of the iceberg (11, 12; also
unpublished data). Similarly, a broad range of anti-
S. aureus
antibody titers was reported for some toxins and
surface-asso-ciated antigens (6, 31).
The high variability in antibody profiles likely reflects the
individual history of encounters with
S. aureus
as well as the
genetic diversity of the species. The latter is due to mobile
genetic elements, which carry many virulence and resistance
genes. Two strains can differ in as much as 20% of their
genomes (15). Thus,
S. aureus
strains are expected to leave
different imprints on the adaptive immune system. It is also
possible that some antibody specificities were cross-reactive,
i.e., induced by non-
S. aureus
antigens.
The broad and very personal antibody repertoires against
FIG. 2. Variability of total IgG binding to
S. aureus
8325-4
extra-cellular proteins. The total spot intensity of all spots analyzed was
taken as a measure for global serum IgG binding. Human serum IgG
reacted more frequently with basic proteins (top) than with neutral or
acidic proteins (bottom). The total spot intensity differed by a factor as
high as 20 for IBs with the pH range 4 to 7. Each value was based on
two to four technical replicates. Means and standard deviations are
shown.
on August 17, 2020 by guest
http://cvi.asm.org/
TABLE 2.
S. aureus
extracellular proteins with strong IgG binding
aaAs a measure for immune dominance, we identified the 10% of spots that were strongest (gray squares) on all 2D-IBs
(cutoff, 5.6 Au). This table combines the results for the pH ranges of 6 to 11 and 4 to 7. An annotated reference blot with the spot numbers is provided in Fig. S2 in the supplemental material.
bIB spots were ranked by their frequencies among the 16 volunteers.
cThe carrier status is given for each of the 16 volunteers. Volunteers were ranked by the number of strong spots for each. dThe number of sera in which the respective IB spot was defined as strong is given, along with the median spot volume
(arbitrary units) and interquartile range. n.d., not determined.
en.i., not identified.
fA strong 2D-IB spot covered two (or more) closely located protein spots.
on August 17, 2020 by guest
http://cvi.asm.org/
staphylococcal virulence factors will likely put patients at
dif-ferent starting positions in case of
S. aureus
invasion. Evidence
for a protective role of anti-
S. aureus
antibodies is still limited.
Toxic shock syndrome patients, who commonly lack
anti-TSST-1-antibodies, can be effectively treated by therapeutic
application of immunoglobulins (26, 27). Moreover, antibodies
targeted at surface proteins or toxins improve the outcome in
animal models of
S. aureus
infections (13, 16, 22, 25, 33).
However, for most antibody specificities observed in this study,
the possible biological significance has not yet been
investi-gated.
Until now, information about the behavior of the
microor-ganism in the different phases of its encounters with the host
has been scarce and difficult to obtain (9). The adaptive
im-mune system may be considered a sensitive reporter system for
in vivo-expressed bacterial antigens, and the complex IgG
binding patterns demonstrate that our analysis was focused on
a highly relevant subproteome.
How are these immune responses induced? Do proteins
released by
S. aureus
confront the immune system during
col-onization of intact epithelia, or are minor infections necessary
to trigger the observed antibody patterns? Are some of them
cross-reactive with highly conserved antigens from other
bac-teria? Experimental colonization induced only minor changes
in the levels of IgG binding to a number of weak spots, which
were not conserved between individuals. Moreover, serum IgA
responses were not affected by experimental colonization,
ei-ther (see Fig. S3 in the supplemental material). As in earlier
colonization studies with wild-type strains (18, 29, 36), the
duration of carriage was variable, and only 10 out of 16
vol-unteers were colonized for more than 8 days. This resembles
the behavior of
S. aureus
in IC and NC (29, 30), but not in
persistent colonization, which frequently lasts for months or
years. Our findings suggest that short-term colonization with a
strain of low virulence does not trigger or boost strong IgG or
IgA responses. The antibody patterns observed in carriers as
well as in NC could, therefore, be due either to long-term,
high-density colonization or, as we consider more likely, to
(minor)
S. aureus
infections, as has been reported for selected
antigens (4, 5, 14). This could imply that serum antibodies are
directed predominantly against infection-related antigens and
are less involved in the control of colonization.
Our results have implications for vaccine development.
Strategies are usually focused on conserved staphylococcal
an-tigens (6, 24). Our data show that most healthy adults already
possess strong antibody responses against many conserved
S.
TABLE 3. Differences in baseline IgG binding between
carriers and NC
Spot
label Protein
a
Median level (in arbitrary units) of IgG binding (interquartile
range) for: Pb
Carriers
(PC⫹IC) NC
4-7_101
NI
0.7 (0.4–1.3)
0.3 (0.2–0.4)
0.027
4-7_119
IsaA_6, IsaA_7,
IsaA_8
1.4 (1.1–1.9)
0.5 (0.4–0.7)
0.027
4-7_49
SspB_1
8.6 (6.2–12.9)
4.3 (2.6–6.6)
0.036
4-7_69
SspA_1,
SspA_6
9.6 (5.6–12.6)
2.7 (0.8–5.5)
0.046
4-7_70
NI
0.1 (0.1–0.2)
0.1 (0.1–0.1)
0.046
a
Only proteins that differed significantly in IgG binding between carriers and NC are listed. NI, not identified.
b
By the Mann-Whitney U test.
TABLE 4. Spots with more than fivefold increases after experimental colonization
Spot
labela Protein Volunteer
no.
Carriage status
Median fold increase in spot intensity (minimum–maximum)b
Spot intensityc
4-7_34
NI
d165
NC
11.5 (4.2–18.7)
0.1
4-7_31
NI
165
NC
7.7 (4.7–10.7)
0.1
4-7_5
88196599_1
165
NC
6.49 (3.4–9.3)
0.1
6-11_71
NI
165
NC
5.9 (2.1–11.0)
0.3
6-11_15
NI
604
NC
8.4 (7.2–9.6)
0.1
6-11_42
NI
604
NC
7.4 (3.2–11.6)
0.3
4-7_8
88196599_2
608
NC
12.0 (8.1–15.8)
4.0
4-7_9
88196599_10
608
NC
8.6 (3.3–13.8)
2.3
4-7_61
NI
608
NC
6.6 (2.6–10.5)
0.1
6-11_21
NI
601
PC
7.1 (3.7–11.6)
0.9
6-11_113
NI
601
PC
2.7 (2.6–17.9)
0.3
4-7_77
NI
603
PC
5.6 (5.6–5.7)
2.6
4-7_115
SsaA_b_1
606
PC
24.8 (19.4–30.2)
0.3
4-7_3
88196599_8
606
PC
9.7 (2.5–16.9)
0.7
4-7_23
PdhD_1, PdhD_2, PdhD_3
606
PC
7.4 (5.0–9.9)
0.1
4-7_5
88196599_1
606
PC
5.9 (4.3–7.4)
0.2
4-7_88
NI
606
PC
5.3 (4.8–5.7)
0.1
6-11_6
Pbp3
607
PC
18.6 (13.6–23.6)
0.2
6-11_7
Geh_13
607
PC
15.4 (14.9–16.0)
0.2
a
An annotated reference blot with the spot numbers is provided in Fig. S2 in the supplemental material.
b
The ratio of the spot intensity in the postcolonization serum to that in the precolonization serum was determined for each volunteer and for each technical replicate separately. A spot increase was defined as (i) aⱖ5-fold increase in the mean ratio, (ii) aⱖ2.5-fold increase in at least two technical replicates, and (iii) a difference in spot intensity between the postcolonization and precolonization sera exceeding twofold the standard deviation of the technical replicates. The median, minimum, and maximum of the ratios from two to four technical replicates are given.
c
Median spot intensity (in arbitrary units) of technical replicates of IBs developed with postcolonization sera.
d
NI, not identified.
on August 17, 2020 by guest
http://cvi.asm.org/
aureus
proteins. It remains to be shown how much vaccination
could add to this. Moreover, our data illustrate the
pro-nounced heterogeneity of clinical
S. aureus
isolates and host
responses (15). The variable
S. aureus
virulence factors might
be equally important as conserved bacterial antigens and
should be considered in the design of
S. aureus
vaccines.
ACKNOWLEDGMENTS
Work in the laboratories of Michael Hecker, B. M. Bro
¨ker, and U.
Vo
¨lker was supported by the Deutsche Forschungsgemeinschaft
(SFB-TR34, GRK840). T. T. H. Nguyen received a grant from the
Vietnam-ese Ministry of Education and Training (MOET).
The authors have declared no conflict of interest.
We thank Tim Foster (Dublin, Ireland) for providing
S. aureus
strain
DU5875 (8325-4
⌬
spa
).
REFERENCES
1.Acton, D. S., M. J. Plat-Sinnige, W. van Wamel, N. de Groot, and A. van Belkum. 2009. Intestinal carriage ofStaphylococcus aureus: how does its frequency compare with that of nasal carriage and what is its clinical impact? Eur. J. Clin. Microbiol. Infect. Dis.28:115–127.
2.Boucher, H. W., and G. R. Corey.2008. Epidemiology of methicillin-resistant Staphylococcus aureus. Clin. Infect. Dis.46:S344–S349.
3.Bradford, M. M.1976. A rapid and sensitive method for the quantitation of microgram quantities of protein utilizing the principle of protein-dye bind-ing. Anal. Biochem.72:248–254.
4.Burlak, C., C. H. Hammer, M. A. Robinson, A. R. Whitney, M. J. McGavin, B. N. Kreiswirth, and F. R. Deleo.2007. Global analysis of community-associated methicillin-resistantStaphylococcus aureus exoproteins reveals molecules produced in vitro and during infection. Cell. Microbiol.9:1172– 1190.
5.Colque-Navarro, P., B. Soderquist, H. Holmberg, L. Blomqvist, P. Olcen, and R. Mollby.1998. Antibody response inStaphylococcus aureus septicae-mia—a prospective study. J. Med. Microbiol.47:217–225.
6.Dryla, A., S. Prustomersky, D. Gelbmann, M. Hanner, E. Bettinger, B. Kocsis, T. Kustos, T. Henics, A. Meinke, and E. Nagy.2005. Comparison of antibody repertoires againstStaphylococcus aureusin healthy individuals and in acutely infected patients. Clin. Diagn. Lab. Immunol.12:387–398. 7.Etz, H., D. Minh, T. Henics, A. Dryla, B. Winkler, C. Triska, A. Boyd, J.
So¨llner, W. Schmidt, U. von Ahsen, M. Buschle, S. Gill, J. Kolonay, H. Khalak, C. Fraser, A. von Gabain, E. Nagy, and A. Meinke.2002. Identifi-cation of in vivo expressed vaccine candidate antigens fromStaphylococcus aureus. Proc. Natl. Acad. Sci. USA99:6573–6578.
8.Foster, T. J.2004. TheStaphylococcus aureus“superbug.” J. Clin. Investig. 114:1693–1696.
9.Goerke, C., and C. Wolz.2004. Regulatory and genomic plasticity of Staph-ylococcus aureusduring persistent colonization and infection. Int. J. Med. Microbiol.294:195–202.
10.Hancock, K., and V. C. Tsang.1983. India ink staining of proteins on nitrocellulose paper. Anal. Biochem.133:157–162.
11.Holtfreter, S., K. Bauer, D. Thomas, C. Feig, V. Lorenz, K. Roschack, E. Friebe, K. Selleng, S. Lovenich, T. Greve, A. Greinacher, B. Panzig, S. Engelmann, G. Lina, and B. M. Bro¨ker.2004.egc-encoded superantigens fromStaphylococcus aureusare neutralized by human sera much less effi-ciently than are classical staphylococcal enterotoxins or toxic shock syn-drome toxin. Infect. Immun.72:4061–4071.
12.Holtfreter, S., K. Roschack, P. Eichler, K. Eske, B. Holtfreter, C. Kohler, S. Engelmann, M. Hecker, A. Greinacher, and B. M. Bro¨ker.2006. Staphylo-coccus aureuscarriers neutralize superantigens by antibodies specific for their colonizing strain: a potential explanation for their improved prognosis in severe sepsis. J. Infect. Dis.193:1275–1278.
13.Josefsson, E., O. Hartford, L. O’Brien, J. M. Patti, and T. Foster.2001. Protection against experimentalStaphylococcus aureusarthritis by vaccina-tion with clumping factor A, a novel virulence determinant. J. Infect. Dis. 184:1572–1580.
14.Kanclerski, K., B. Soderquist, M. Kjellgren, H. Holmberg, and R. Mollby. 1996. Serum antibody response toStaphylococcus aureusenterotoxins and TSST-1 in patients with septicaemia. J. Med. Microbiol.44:171–177. 15.Lindsay, J. A., and M. T. Holden.2006. Understanding the rise of the
superbug: investigation of the evolution and genomic variation of Staphylo-coccus aureus. Funct. Integr. Genomics6:186–201.
16.McKenney, D., K. L. Pouliot, Y. Wang, V. Murthy, M. Ulrich, G. Do¨ring,
J. C. Lee, D. A. Goldmann, and G. B. Pier.1999. Broadly protective vaccine forStaphylococcus aureusbased on an in vivo-expressed antigen. Science 284:1523–1527.
17.Mertz, D., R. Frei, B. Jaussi, A. Tietz, C. Stebler, U. Fluckiger, and A. F. Widmer.2007. Throat swabs are necessary to reliably detect carriers of Staphylococcus aureus. Clin. Infect. Dis.45:475–477.
18.Nouwen, J., H. Boelens, A. van Belkum, and H. Verbrugh.2004. Human factor inStaphylococcus aureusnasal carriage. Infect. Immun.72:6685–6688. 19. Reference deleted.
20.Novick, R.1967. Properties of a cryptic high-frequency transducing phage in Staphylococcus aureus. Virology33:155–166.
21.Patel, A., P. Nowlan, E. Weavers, and T. Foster.1987. Virulence of protein A-deficient and alpha-toxin-deficient mutants ofStaphylococcus aureus iso-lated by allele replacement. Infect. Immun.55:3103–3110.
22.Rennermalm, A., Y. H. Li, L. Bohaufs, C. Jarstrand, A. Brauner, F. R. Brennan, and J. I. Flock.2001. Antibodies against a truncated Staphylococ-cus aureusfibronectbinding protein protect against dissemination of in-fection in the rat. Vaccine19:3376–3383.
23.Rogasch, K., V. Ru¨hmling, J. Pane´-Farre´, D. Ho¨per, C. Weinberg, S. Fuchs, M. Schmudde, B. M. Bro¨ker, C. Wolz, M. Hecker, and S. Engelmann.2006. The influence of the two-component system SaeRS on global gene expres-sion in two differentStaphylococcus aureusstrains. J. Bacteriol.188:7742– 7758.
24.Schaffer, A. C., and J. C. Lee.2008. Vaccination and passive immunisation againstStaphylococcus aureus. Int. J. Antimicrob. Agents32(Suppl. 1):S71– S78.
25.Schaffer, A. C., R. M. Solinga, J. Cocchiaro, M. Portoles, K. B. Kiser, A. Risley, S. M. Randall, V. Valtulina, P. Speziale, E. Walsh, T. Foster, and J. C. Lee.2006. Immunization withStaphylococcus aureusclumping factor B, a major determinant in nasal carriage, reduces nasal colonization in a murine model. Infect. Immun.74:2145–2153.
26.Schlievert, P.2001. Use of intravenous immunoglobulin in the treatment of staphylococcal and streptococcal toxic shock syndromes and related illnesses. J. Allergy Clin. Immunol.108:S107–S110.
27.Stolz, S. J., J. P. Davis, J. M. Vergeront, B. A. Crass, P. J. Chesney, P. J. Wand, and M. S. Bergdoll.1985. Development of serum antibody to toxic shock toxin among individuals with toxic shock syndrome in Wisconsin. J. Infect. Dis.151:883–889.
28.van Belkum, A.2006. Staphylococcal colonization and infection: homeostasis versus disbalance of human (innate) immunity and bacterial virulence. Curr. Opin. Infect. Dis.19:339–344.
29.van Belkum, A., N. J. Verkaik, C. P. de Vogel, H. A. Boelens, J. Verveer, J. L. Nouwen, H. A. Verbrugh, and H. F. Wertheim.2009. Reclassification of Staphylococcus aureusnasal carriage types. J. Infect. Dis.199:1820–1826. 30.VandenBergh, M. F. Q., E. P. F. Yzerman, A. van Belkum, H. A. M. Boelens,
M. Sijmons, and H. A. Verbrugh.1999. Follow-up ofStaphylococcus aureus nasal carriage after 8 years: redefining the persistent carrier state. J. Clin. Microbiol.37:3133–3140.
31.Verkaik, N. J., C. P. de Vogel, H. A. Boelens, D. Grumann, T. Hoogenboezem, C. Vink, H. Hooijkaas, T. J. Foster, H. A. Verbrugh, A. van Belkum, and W. J. van Wamel.2009. Anti-staphylococcal humoral immune response in persistent nasal carriers and noncarriers ofStaphylococcus aureus. J. Infect. Dis.199:625–632.
32.von Eiff, C., K. Becker, K. Machka, H. Stammer, and G. Peters.2001. Nasal carriage as a source ofStaphylococcus aureusbacteremia. N. Engl. J. Med. 344:11–16.
33.Wardenburg, J. B., and O. Schneewind.2008. Vaccine protection against Staphylococcus aureuspneumonia. J. Exp. Med.205:287–294.
34.Wertheim, H. F., D. C. Melles, M. C. Vos, W. van Leeuwen, A. van Belkum, H. A. Verbrugh, and J. L. Nouwen.2005. The role of nasal carriage in Staphylococcus aureusinfections. Lancet Infect. Dis.5:751–762.
35.Wertheim, H. F., M. C. Vos, A. Ott, A. van Belkum, A. Voss, J. A. Kluytmans, P. H. van Keulen, C. M. Vandenbroucke-Grauls, M. H. Meester, and H. A. Verbrugh.2004. Risk and outcome of nosocomialStaphylococcus aureus bacteraemia in nasal carriers versus non-carriers. Lancet364:703–705. 36.Wertheim, H. F., E. Walsh, R. Choudhurry, D. C. Melles, H. A. Boelens, H.
Miajlovic, H. A. Verbrugh, T. Foster, and A. van Belkum.2008. Key role for clumping factor B inStaphylococcus aureusnasal colonization of humans. PLoS Med.5:e17.
37.Ziebandt, A. K., D. Becher, K. Ohlsen, J. Hacker, M. Hecker, and S. En-gelmann.2004. The influence ofagr andBin growth phase dependent
regulation of virulence factors inStaphylococcus aureus. Proteomics4:3034– 3047.
38.Ziebandt, A. K., H. Weber, J. Rudolph, R. Schmid, D. Hoper, S. Engelmann, and M. Hecker.2001. Extracellular proteins ofStaphylococcus aureusand the role of SarA andB
. Proteomics1:480–493.