Scholarship@Western
Scholarship@Western
Electronic Thesis and Dissertation Repository
5-17-2017 3:00 PM
Numerical and Experimental Analysis of a Retrofit System for
Numerical and Experimental Analysis of a Retrofit System for
Light-Framed Wood Structures Under Wind Loading
Light-Framed Wood Structures Under Wind Loading
Joshua D. Rosenkrantz
The University of Western Ontario
Supervisor
Prof. A. A. El Damatty
The University of Western Ontario
Graduate Program in Civil and Environmental Engineering
A thesis submitted in partial fulfillment of the requirements for the degree in Master of Engineering Science
© Joshua D. Rosenkrantz 2017
Follow this and additional works at: https://ir.lib.uwo.ca/etd
Part of the Structural Engineering Commons
Recommended Citation Recommended Citation
Rosenkrantz, Joshua D., "Numerical and Experimental Analysis of a Retrofit System for Light-Framed Wood Structures Under Wind Loading" (2017). Electronic Thesis and Dissertation Repository. 4884. https://ir.lib.uwo.ca/etd/4884
This Dissertation/Thesis is brought to you for free and open access by Scholarship@Western. It has been accepted for inclusion in Electronic Thesis and Dissertation Repository by an authorized administrator of
Abstract
Load paths in light-frame wood structures have historically been nailed connections between
the sheathing and rafters, and toenail connections between the rafters and stud walls. However,
these connections have poor resistance to uplifting forces, as occurs in high wind speed events,
causing sheathing or roof-to-wall-connection (RTWC) failures. The improvements made to
building codes after Hurricane Andrew affected only new construction, and the economic
losses caused by roof failures in homes built prior to 1993 from Hurricane Katrina pointed to
a need to retrofit older structures. This paper will investigate the design, analysis, and testing
of a temporary cable-netting roof harness as an alternative to other relatively expensive and
invasive retrofitting options. To do this, a non-linear finite element analysis (FEA) is
performed to model a typical light-frame wood structure with the roof harness, which is then
validated through results derived from destructively testing a reduced scale LFWS. To
demonstrate the comparative benefit of the roof harness, an identical reduced scale LFWS with
the retrofit system applied is numerically modeled and destructively tested in the same manner
as the unretrofitted LFWS. The comparison of the resulting numerical and experimental data
both validates the numerical models used for predicting structural behaviour of the model, and
demonstrates significant improvement in the capacity of the structure when the retrofit system
is applied.
ii
Co-Authorship Statement
This thesis has been prepared in accordance with the regulations for an Integrated-Article format
thesis stipulated by the School of Graduate and Postdoctoral Studies at the University of Western
Ontario and has been co-authored as:
Chapter Two: Comparative Testing of a Reduced Scale LFWS Using Wind Load
The initial numerical model was developed by A. Dessouki. Modifications to the numerical
model and the numerical analysis were completed by R. Jacklin under the supervision of Dr.
A. A. El Damatty. Further modifications to the numerical model and the numerical analysis
were completed by A. Enajar and J. Rosenkrantz under the supervision of Dr. A. A. El
Damatty. Drafts of the work were prepared by A. Enajar and J. Rosenkrantz and modifications
were completed under the supervision of Dr. A. A. El Damatty. A paper co-authored by J.
Rosenkrantz, A. Enajar, R. Jacklin, A. Dessouki, and A. A. El Damatty will be submitted to
the Journal of Wind and Structures.
Chapter Three: Comparative Testing of a Reduced Scale LFWS Using Wind Load
The initial numerical model was developed by A. Dessouki. Modifications to the numerical
model and the numerical analysis were completed by R. Jacklin under the supervision of Dr.
A. A. El Damatty. Further modifications to the numerical model and the numerical analysis
were completed by A. Enajar and J. Rosenkrantz under the supervision of Dr. A. A. El
Damatty. Drafts of the work were prepared by A. Enajar and J. Rosenkrantz and modifications
were completed under the supervision of Dr. A. A. El Damatty. A paper co-authored by J.
Rosenkrantz, A. Enajar, R. Jacklin, A. Dessouki, and A. A. El Damatty will be submitted to
iii
Acknowledgments
I would like to first thank my supervisor, Dr. A. A. El Damatty for his valuable guidance and
expertise throughout my time working under his supervision. I would also like to thank M. A.
Steelcon Engineering Limited for the financial support of the research, and the WindEEE and
IRLBH facilities for their assistance with the experimental program. I wish to extend gratitude
to my research partner, Adnan Enajar, as well as all the volunteers who participated in the
experimental work. Finally, I would like to thank my mother Pat and sister Leah for their
iv
Table of Contents
1 Introduction ... 1
1.1 Motivation ... 1
1.2 Background ... 4
Numerical and Experimental Studies of LFWS Behaviour ... 4
Current State of Technology ... 7
Numerical and Experimental Studies of Roof Harness Behaviour ... 9
1.3 Objectives ... 12
1.4 Thesis Structure ... 14
Structural Behaviour Analysis of a Reduced Scale LFWS Subject to Wind Load ... 14
Structural Behaviour Analysis of a Reduced Scale Retrofitted LFWS Subject to Wind Load References... 15
1.5 References ... 16
2 Structural Behaviour Analysis of a Reduced Scale LFWS Subject to Wind Load ... 18
2.1 Introduction ... 18
2.2 Testing Environment, Initial Specimen Geometry and Load Effects ... 21
Testing Environment ... 21
Specimen Geometry ... 23
Wind Load Effects ... 24
2.3 Strength Scaling and the Design of a Reduced Strength Scaled LFWS ... 27
Concept of Structural Scaling ... 27
RTWC Scaling ... 28
Member Scaling ... 38
2.4 Analysis of FEM Behaviour Subjected to Realistic Wind Load ... 44
v
Uplift – Velocity Curves ... 47
Uplift – Displacement Curves ... 49
2.5 Analysis of Experimental Behaviour ... 50
Model and Test Description ... 50
RTWC Displacement Analysis ... 53
RTWC Uplift Estimation ... 55
2.6 Post-Failure Analysis ... 57
Displacement – Velocity Curves ... 58
Uplift – Velocity Curves ... 60
Uplift – Displacement Curves ... 62
2.7 Comparison of FEA to Experimental Results ... 64
2.8 Conclusions ... 66
2.9 References ... 68
3 Structural Behaviour Analysis of a Reduced Scale Retrofitted LFWS Subject to Wind Load... 69
3.1 Introduction ... 69
3.2 Prior Research ... 70
3.3 Strength Scaling and the Design of a Reduced Strength Scaled Retrofit System 72 Concept of Structural Scaling ... 72
Retrofit Component Scaling ... 74
3.4 Analysis of FEM Behaviour Subjected to Realistic Wind Load ... 80
Description of Exercise ... 80
Uplift – Displacement Curves ... 81
Uplift – Velocity Curves ... 83
Displacement – Velocity Curves ... 85
vi
Load Sharing – Velocity Curves ... 87
3.5 Analysis of Experimental Behaviour ... 89
Instrumentation and Test Description ... 89
RTWC Displacement Analysis ... 91
External Cable Tension Analysis ... 92
RTWC Uplift Estimation ... 93
Load Sharing – Velocity Curves ... 95
3.6 Post – Failure Finite Element Analysis ... 97
Displacement – Velocity Curves ... 98
Uplift – Velocity Curves ... 100
Uplift – Displacement Curves ... 101
3.7 Comparison of Initial and Post-Failure Finite Element Analysis to Experimental Data ... 103
Equilibrium Ratio... 103
Load Sharing – Velocity Curves ... 105
3.8 Comparison of Structural Response with and Without Retrofit System ... 106
3.9 Retrofit Stiffness Improvement ... 110
Description of Alternate Retrofit Configuration ... 110
Performance improvement ... 111
3.10Conclusions ... 117
3.11References ... 120
4 Conclusion ... 121
4.1 Summary ... 121
4.2 Key Findings of the Current Work ... 122
4.3 Recommendations for Future Work... 126
vii List of Tables
Table 2.1 Average RTWC reaction (N) ... 26
Table 2.2 Failure mode statistics (Khan and Kopp, 2012) ... 28
Table 2.3 Bi-linear statistics for force – displacement curves (Khan and Kopp, 2012) ... 29
Table 2.4 Typical bi-linear force – displacement statistics from displacement test ... 34
Table 2.5 Difference in bi-linear statistics between test and Khan and Kopp, 2012 ... 34
Table 2.6 Failure mode statistics from test ... 35
Table 2.7 Bi-linear parameters for 2D and 12D normalized typical force – displacement .... 37
Table 2.8 Comparison of failure modes by nail type ... 38
Table 2.9 Demand – capacity ratios for reduced and full scale truss members at failure ... 43
Table 2.10 Windward RTWC piecewise linear force – displacement relationships ... 62
Table 3.1 Wind velocity statistics for each fan speed ... 91
Table 3.2 Windward RTWC piecewise linear force – displacement relationships ... 102
Table 3.3 Difference in velocity at which initial separation of windward RTWCs occurs .. 107
Table 3.4 Difference in velocity at which initial failure of the windward RTWCs occur .... 107
Table 3.5 Difference in velocity at which initial failure of the windward RTWCs occur .... 108
viii List of Figures
Figure 1.1 Roof damage from Hurricane Andrew, www.floridadisaster.org ... 1
Figure 1.2 STTC failure, www.fema.gov ... 3
Figure 1.3 RTWC failure and full roof collapse, www.floridadisaster.org ... 3
Figure 1.4 Restrofit system proposed by Dessouki and El Damatty (2010) ... 10
Figure 1.5 Retrofit system proposed by Jacklin and El Damatty (2014) ... 11
Figure 1.6 Sample roof strip and retrofit tested by Jacklin and El Damatty (2014) ... 12
Figure 2.1 Retrofit system proposed by Jacklin and El Damatty (2014) ... 19
Figure 2.2 Measured velocity and turbulence intensity profiles respectively ... 22
Figure 2.3 Diagram of pressure transducer and load cell layout ... 24
Figure 2.4 CP distributions over flat roof in a) uniform and b) boundary layer flows ... 25
Figure 2.5 Pressure coefficient in the direction of flow along the centre of the roof ... 25
Figure 2.6 Typical force – displacement relationship (Khan and Kopp, 2012) ... 29
Figure 2.7 Toe-nail connection schematic (AWC, 2007) ... 31
Figure 2.8 Toe-nail connection test setup ... 32
Figure 2.9 RTWC test sample 2 with and without smoothing ... 33
Figure 2.10 Typical 12D spiral nail force – displacement curve from test... 33
Figure 2.11 Typical 2D force – displacement curve from test ... 36
Figure 2.12 Normalized mean force-displacement curves ... 37
ix
Figure 2.14 Reduced scale FEM with trusses of interest identified ... 40
Figure 2.15 Average windward RTWC demand – capacity ratios ... 41
Figure 2.16 Truss member schematic ... 42
Figure 2.17 CP distribution over test specimen roof ... 44
Figure 2.18 FEA generated displacement – velocity curve ... 45
Figure 2.19 FEA generated uplift – velocity curve ... 48
Figure 2.20 FEA generated uplift – displacement curve ... 50
Figure 2.21 Model and contraction setup ... 51
Figure 2.22 CAD model of connection and laser displacement sensor ... 51
Figure 2.23 Experiment velocity time history ... 52
Figure 2.24 Experiment displacement time history ... 53
Figure 2.25 Experimental displacement – velocity curves ... 54
Figure 2.26 Experiment uplift – velocity curves ... 56
Figure 2.27 Displacement – velocity curves from a) experimental and b) FEA results ... 58
Figure 2.28 Uplift – displacement for RTWCs simulating experimental failure modes ... 60
Figure 2.29 Force – displacement relationships simulating experimental failure modes ... 62
Figure 2.30 Equilibrium ratio from both initial and post-failure FEAs ... 65
Figure 3.1 Retrofit system proposed by Jacklin and El Damatty (2014) ... 70
Figure 3.2 Full scale finite element model with retrofit ... 74
x
Figure 3.4 External cable demand-capacity ratio comparison ... 76
Figure 3.5 Internal cable demand-capacity ratio comparison ... 77
Figure 3.6 Aluminum beam demand-capacity ratio comparison ... 78
Figure 3.7 Load sharing – relative velocity for full and reduced scale FEMs ... 79
Figure 3.8 CP distribution over test specimen roof ... 80
Figure 3.9 FEA generated uplift – displacement curves ... 82
Figure 3.10 FEA generated uplift – velocity curves ... 83
Figure 3.11 FEA generated displacement – velocity curves ... 85
Figure 3.12 FEA generated normalized external cable tension – velocity curves ... 86
Figure 3.13 FEA generated load sharing – velocity curves ... 88
Figure 3.14 Windward face of the retrofitted reduced scale test specimen ... 89
Figure 3.15 Velocity time history for various fan speeds ... 90
Figure 3.16 Displacement – velocity curves ... 91
Figure 3.17 Normalized average external cable tension – velocity curves ... 93
Figure 3.18 Uplift – velocity curves ... 94
Figure 3.19 Uplift – displacement curves ... 95
Figure 3.20 Estimated average load sharing between RTWC and retrofit ... 96
Figure 3.21 Displacement – velocity curves from a) experimental and b) FEA results ... 99
xi
Figure 3.24 Equilibrium ratio at sample velocities for initial and post-failure FEA results 104
Figure 3.25 Load sharing – velocity curves from a) initial and b) post-failure FEA results 105
Figure 3.26 Geometry of original and augmented cable configurations ... 111
Figure 3.27 Average displacement – velocity curves for the windward RTWCs ... 112
Figure 3.28 Average normalized tension – velocity curves for windward external cables .. 113
Figure 3.29 Average tension – displacement at windward external cables and RTWCs ... 113
Figure 3.30 Relative distribution of pretension in internal cables ... 115
1
Introduction
1.1
Motivation
Light frame wood structures (LFWSs) are the most popular choice of construction for
residential buildings in North America. The relative abundance of products have led to the
wide spread adoption of light framing wood as an inexpensive and efficient building
material. Most LFWSs do not require exceedance of span and load limits set out by building
codes, and therefore referral to standard details for essential building components without
structural analysis is acceptable.
LFWSs have historically been vulnerable to the effects of high speed wind events.
Relatively light components and building envelope materials can be breached and allow
damage such as water intrusion, or catalyze more serious structural failure. A particularly
common point of building envelope breach is the roof system, which accounted for
approximately 95% (Baskaran and Dutt, 1997) of the 20-25 billion USD in economic losses
incurred by Hurricane Andrew in Florida during 1992 (HUD, 1993). Figure 1.1 shows
extensive damage to roofs from Hurricane Andrew.
Standard details outlined in building codes were changed to address this issue, and
following Hurricane Katrina in 2005, were deemed to have a positive effect on LFWS
resilience, despite the persistence of some issues with the vertical load path (van de Lindt
et al., 2007). However, significant economic loss was still observed, particularly in
structures where non-structural elements allowed for breach of the building envelope and
where the vertical load path was inadequate (van de Lindt et al., 2007). Expected annual
hurricane damage in the United States is predicted to increase 12 billion USD by 2075, as
both climate change and coastal development expose more infrastructure to greater risk
(cbo.gov, 2016). The goal of this research is to address this apparent need for mitigation
strategy that specifically focusses on reducing or eliminating the issue of damage to the
roof system of LFWSs in high speed wind events.
During a high speed wind event, flow separation occurs over low-pitch roofs creating large
areas of suction. This suction can then be amplified if the building envelop is breached, by
increasing the pressure inside the house and adding to the global uplift pressure on the roof.
Failure in the roof system then occurs where the vertical load path is unable to transfer the
force applied. Critical failure locations have been roof-to-wall connections (RTWCs) and
sheathing-to-truss connections (STTCs), as both have historically relied on nailed
connections with poor uplift resistance to transfer load between components (FEMA, 1993;
van de Lindt et al., 2007). Figure 1.2 and Figure 1.3 show STTC and RTWC failure
Figure 1.2 STTC failure, www.fema.gov
Figure 1.3 RTWC failure and full roof collapse, www.floridadisaster.org
There is an obvious need for investigating and mitigating the way in which LFWS roofs
fail in high speed wind events. Existing research has examined RTWCs and STTCs at the
component level and has led to more robust connection devices mandated by code for new
structures, as well as an assortment of retrofit options for already built structures. Past
research has also investigated numerical methods of structural behavior analysis, validated
1.2
Background
Numerical and Experimental Studies of LFWS Behaviour
Past numerical and experimental studies of the behaviour of LFWSs have largely sought
to investigate full-scale structures in order to fully capture the system behaviour.
Experimental testing of individual and connected RTWCs have also been conducted to
characterize their non-linear behaviour, and study its combined effect with load sharing.
The numerical studies by Jacklin and El Damatty (2014) and Dessouki and El Damatty
(2010) focused on creating numerical models of a full scale LFWS that was experimentally
tested by Morrison (2010). Known as the ‘Three Little Pigs’ project, a single storey gable
roof LFWS was constructed according to the Ontario Building Code, and tested at the
University of Western Ontario (UWO) under realistic wind loads. These loads were applied
to the roof of the structure via 58 airbags that were evacuated to simulate the characteristic
fluctuating suction induced by flow separation. RTWCs were subjected to loads exceeding
their individual capacity, but load sharing in the roof structure was found to have
distributed the uplift force over adjacent RTWCs. The toe-nails were found to have failed
incrementally with the fluctuating load, where peak gust loads corresponded with spikes in
permanent withdrawal. The severity of these spikes, or damaging peaks, increased
corresponding to wind speed.
A precursor to the numerical models developed of the ‘Three Little Pigs’ house, Li et. al.
(1998) created a numerical model that had many unique features, some of which were
borrowed in the initial numerical models of the ‘Three Little Pigs’ house. The sheathing
increased stiffness to account for the composite effect of the connected sheathing, and the
gusset plates connecting the truss members were allowed to release moment. Agreement
between numerical and literature derived values of deflection, load distribution and axial
force were deemed realistic and provided confidence in the model.
The first numerical model of the ‘Three Little Pigs’ house created by Dessouki and El
Damatty (2013) consisted of frame and shell elements to model the structure, and
non-linear links using a stiffness relationship defined by Reed et. al. (1997) to simulate the
toe-nail connections. Uniform surface loads where applied across the surface of the roof to
model the airbags used in the experimental test. Since LFWS roofs have typically low
periods of vibration, the non-linearity of the roof is chiefly attributed to the RTWCs. Given
that the RTWCs were characterized by a user-defined relationship, there was no
non-linearity expected from the roof and a quasi-static analysis was conducted considering a
number of time-steps from the time-history of the experimental test. The numerically
predicted RTWC displacement results had good agreement with those collected
experimentally, and the model was concluded to be therefore validated. Further
examination of this model identified that the gable end trusses attracted a significant
portion of the load within the tributary area of adjacent trusses. For this reason, as well as
non-linear nature of load sharing within the structure, the tributary area method of
allocating load to RTWCs was deemed inaccurate.
Jacklin and El Damatty (2014) developed a successive numerical model to the one
developed by Dessouki and El Damatty (2010), which focused on modelling only the roof
of the experimentally tested structure and included inset RTWCs to allow for overhanging
second model by observing good agreement between numerically derived RTWC
deflections and those collected experimentally. The numerical investigation also concluded
the unsuitability of the tributary area method in accounting for load at RTWCs, again due
to the inability of the method to consider both the load attraction to the much stiffer gable
end trusses and load sharing between the trusses. It was also found that the behaviour of
the roof structure was highly dependent on the type of load, either uniform or realistic, that
was applied.
Individual toe-nail connection testing was undertaken by Morrison (2010) and used
fluctuating simulated wind loads to assess hysteretic behaviour of the connection. Though
this differed from the ramp load approach undertaken by Reed et al. (1997), the way in
which load was applied was deemed to have a negligible effect on the overall capacity of
the nail. Hysteresis was observed in the toe-nail connections, and initial stiffness was
found to be similar to stiffness after successive loading and unloading cycles.
Khan and Kopp (2012) continued experimental testing of individual toe-nail connections,
and of a system toe-nail connections linked by a steel angle section that loosely simulated
lateral roof stiffness. It was found that in both individual and in interconnected
configurations, toe-nail connections had higher variation in failure displacement than
failure capacity, though more so individually. Additionally, since the difference in stiffness
between toe-nail connections is relatively small prior to yield, the difference in load across
the connections was at a minimum. Conversely, just prior to failure of the system, load
difference was found to be greatest as individual connections began to rapidly loose
Similar conclusions regarding load sharing were reached by running a sensitivity analysis
on the stiffness of elements in a numerical model developed by Shivarudrappa and Nielson
(2013). This model was validated by the experimental results of Datin and Prevatt (2013)
and concluded that increased withdrawal stiffness in the RTWCs and bending stiffness in
the sheathing panels had a significant effect on load sharing.
The past research detailed, both experimental and numerical, can be used to understand the
sensitivity of structural behaviour to certain component and loading parameters, allow for
the development of more accurate models, and outlines the boundaries of current
knowledge on how LFWSs behave under high speed wind loads.
Current State of Technology
1.2.2.1 Building Code and Construction Products
Products such as ring shank nails and hurricane clips were developed to replace or add to
existing construction products and methods for use in new construction, responding to the
need to enhance the tensile resistance of vertical load paths in LFWSs. Similarly, building
code changes have been developed to address advances in knowledge, and to respond to
catastrophic losses incurred by past high speed wind events. The most significant of these
with respect to the improvement of roof performance were enacted by the 1994 South
Florida Building Code in response to the heavy losses incurred there by Hurricane Andrew
in 1992.
Though the use of new building products are suggested in these codes, it is not always
mandated. For example, though the 2014 Florida Building Code mentions that both 8D
use of ring shank nails improved the mean uplift capacity of a typical sheathing panel by
32% (IHRC, 2012).
1.2.2.2 Retrofitting Technology
Though newly constructed LFWSs incorporate new building products and are built in
accordance to modern code provisions, older LFWSs are remain particularly susceptible to
damage in high wind speed events. A number of mainly internal retrofitting options have
been developed in response to this issue, such as adhesives, straps, hurricane ties, and the
installation of additional studs (FEMA, 2010). However, these methods often require
invasive renovations and are therefore expensive, estimated between 15 – 50 % of the cost
of an existing structure (Stewart et al, 2003). Since retrofitting RTWCs is not required by
the FBC if Further, insurance providers may not renew policies for roofs older than 20
years, and will only pay current value once damage has already occurred (insurance.com,
2016). Leaving the financial burden to the consumer increases the likelihood that roofs will
not be adequately maintained to withstand high speed wind events.
An idea to significantly lessen the cost of retrofitting old roofs is the roof harness.
Consisting of tension elements placed over the roof and pretensioned to either the
foundation or anchor piles independent of the structure, the roof harness is a temporary
method of providing an alternate load path to resist uplift forces. It requires little if any
alteration of the underlying structure, and similar to other damage mitigation practices, it
can be applied to the structure in the event of a high wind speed warning and removed
thereafter. The roof harness is designed to prevent structural damage to RTWCs and
There exist a number of patents for various roof harnesses, which can be categorized as
chiefly fabric or cable based systems. Bachynski (2007), Gaffney (1998), Gitlin and
Maloney (1998), and Watson Jr. (2008) have filed patents on systems using a pretensioned
fabric mesh with integrated straps that serve to connect the system to anchor piles. These
systems have all of the potential benefits of the most robust roof harnesses, while providing
extra coverage of windows and other fenestration from windborne debris. However, these
systems all have very complex strapping configurations, many tie-down points, and consist
of one large sheet. This makes the application of such systems cumbersome and time
consuming, likely requiring professional assistance.
Alternatively, patents filed by Bimberg and Bimberg (1997) and Luzzi (1999) rely on
simpler, cable and strap-based systems respectively. Bimberg and Bimberg (1997)
proposed a system consisting of a series of cables applying compressive force to the roof
through wooden bearing pads and attached on either side of the structure to pile, while
Luzzi (1999) proposed an array of ratchet straps spanning the roof and anchored to the
foundation. Though the simplicity of these designs allow for low cost and ease of
application, depending on the density of cables only RTWC failure is prevented, leaving
the structure vulnerable to sheathing and cladding damage that is likely to cause the most
damage. Therefore, further iterations of this technology should seek to combine the
protection offered by fabric-based systems with the simplicity and ease of application of
the strap and cable-based system.
Numerical and Experimental Studies of Roof Harness Behaviour
The current research program began with the work of Dessouki and El Damatty (2010),
RTWC and STTC protection. The resulting retrofit configuration, pictured in Figure 1.4
below, consisted of an orthogonal mesh of interior cables connected to rigid carbon fibre
rods around the perimeter of the structure and anchored through external cables to piles.
Figure 1.4 Restrofit system proposed by Dessouki and El Damatty (2010)
Using the previously developed numerical model of the ‘Three Little Pigs’ structure, a
parametric optimization of the size and configuration of the various retrofit components
was conducted with the goal of minimizing weight and maximizing stiffness. The retrofit
system was included in the numerical model of the original LFWS by treating rigid bars as
three dimensional frame elements, and the cables as non-linear cable objects with a target
force acting as a pretension in the external cables. Using a static non-linear analysis, a
uniform suction of 2 kN/m2 was applied over the surface of the roofs of both the original
numerical model, and the one including the retrofit system. A comparison of the results
revealed a 40 % reduction in the average RTWC deflection, providing the motivation for
further investigation of the technology.
Given these encouraging results, Jacklin and El Damatty (2014) refined the previously
developed retrofit concept as a series of modular sections that can be easily applied and
stored, and replaced the costly carbon fibre bars with more cost-effective aluminum. A
picture of the new design is shown in Figure 1.5 below.
Wire Net
External Cable Carbon fibre
External Cable
Rigid Bars
Bearing Cables
Figure 1.5 Retrofit system proposed by Jacklin and El Damatty (2014)
This new design of the retrofit system was incorporated into the updated numerical model
similarly to the previous exercise, where a non-linear static analysis was used to
incrementally apply a more realistic load to the underlying LFWS. The load applied
simulated winds in excess of 25 m/s such that the RTWCs would exhibit plastic
deformation to observe the load sharing behaviour between the two load paths. A
parametric study was conducted to optimize the sizes of the various components.
Jacklin and El Damatty (2014) also conducted the first experimental tests of the retrofit
system, by subjecting a 9 m by 1.2 m strip of a full scale roof without overhang to an uplift
force produced by a hydraulic jack located under the test section. A photo of the test setup
Figure 1.6 Sample roof strip and retrofit tested by Jacklin and El Damatty (2014)
The roof had a slope of 4:12, used 3-16D spiral nails in the RTWCs, and consisted of three
trusses spaced at 0.6 m. The retrofit system used 3/16 in. and 1/2 in. diameter aircraft cable
for the interior and exterior cables respectively, as well as a 2 in. by 4 in. by 1/4 in. hollow
aluminum section as the rigid bar. This experiment concluded that the presence of the
retrofit system decreased the expected deformation at the RTWCs by approximately 40 %,
validating the results of the numerical model.
1.3
Objectives
Furthering the experimental research of Jacklin and El Damatty (2014), the current study
compares the performance of a reduced scale LFWS with and without a reduced scale
retrofit system subject to wind loading. The primary objectives of this investigation are to
better understand the interaction between the retrofit and the underlying LFWS, and to
evaluate the effectiveness of the retrofit as a means of preventing roof damage. In this
defined as the increase in velocity required to achieve: (i) initial separation, (ii) initial
RTWC failure, (iii) windward RTWC failure. However, the use of wind to generate
destructive failure in a reduced scale LFWS requires additional objectives for the
development and validation of an appropriate testing environment, and the development of
an appropriate scaling method to scale component strength.
The objectives of each chapter in this investigation can then be summarized as follows:
- Design a simple, reduced scale destructive testing environment that produces a
sufficiently great wind speed over a suitably large wind field. This should
demonstrate the viability of similar additions to improving wind tunnel capabilities.
- Characterize the resulting wind field and determine the resulting pressure
coefficient and RTWC load distributions.
- Design a reduced scale test specimen that approximates the behaviour of a full scale
LFWS and meets the geometric constraints as set out by the testing environment.
- Predict the behaviour of the test specimen using a numerical model.
- Observe total windward RTWC failure in the test specimen at a desired failure
velocity, and optimize the numerical model to better correspond with the recorded
failure mode.
- Predict the behaviour of the test specimen and a reduced scale version of the retrofit
- Observe comparative improvement to the test specimen and retrofit system under
similar wind load, and optimize the numerical model to better correspond with the
recorded response.
1.4
Thesis Structure
This thesis has been prepared in the ‘Integrated Article’ format. The current chapter
discusses the motivation for the following research by investigating the inherent
susceptibility of older LFWSs to wind induced uplift loads. The chapter further investigates
previously developed measures to protect these vulnerabilities such as building code
changes, and retrofitting methods. An evaluation of retrofitting methods is then conducted
with a specific focus on proposed roof harness designs. The retrofit design and research
developed and conducted by Jacklin and El Damatty (2014) are reviewed and assessed.
The primary objectives of the thesis are then defined to expand on this research and the
requirements of the current research, to be addressed in subsequent chapters, are then
outlined. The final chapter provides a summary of the key findings of the current research
and suggested improvements for future research.
Structural Behaviour Analysis of a Reduced Scale LFWS Subject
to Wind Load
The second chapter recounts prior work regarding development of an outdoor testing
environment for reduced scale applications at the WindEEE dome, as well as the associated
uplift load imparted to a reduced scale structure. It then describes the development of the
reduced scale LFWS, corresponding numerical model, results of the destructive test, and
post-failure numerical model. The chapter first introduces the scaling process by which the
model is generated and a non-linear static analysis is performed to assess the roof behaviour
over a range of wind speeds. The experimental test is then discussed and the results
presented. The numerical model is updated to reflect the observed experimental roof
response, and the results of the initial and updated numerical models are then compared
with the experimental results to determine accuracy. Importantly, this chapter presents the
behaviour of the LFWS as the control variable.
Structural Behaviour Analysis of a Reduced Scale Retrofitted
LFWS Subject to Wind Load References
Similar to the previous chapter, the third chapter discusses development of the reduced
scale retrofit system, addition of the retrofit to the numerical model, results of the
experimental test, and a post-failure adaptation of the initial model. However, this chapter
also compares the numerical and experimental results of the retrofitted and unretrofitted
structures, and suggests an alternate configuration to the retrofit system to improve
performance. As before, the chapter describes the same process for decreasing the strength
and size of the retrofit components, as well as the incorporation of the system into the
existing numerical LFWS model. The experimental test and results are then presented,
followed by a description of the adaptations made to the numerical model from post-failure
analysis and corresponding results. Again, the accuracy of the initial and post-failure
models are compared and recommendations are made as to improvement measures. The
third chapter then uses the results of the previous chapter to compare the benefit of applying
the retrofit system, and an alternate retrofit configuration is produced and analyzed to
1.5
References
Baskaran, A. and Dutt, O., 1997. Performance of roof fasteners under simulated loading conditions. Journal of Wind Engineering and Industrial Aerodynamics, 72(0), 389-400
Bimberg, U., and Bimberg, O. (1997), U.S Patent No. 5623788. Washington, DC: U.S. Patent and Trademark Office.
Bitsuamlak, G.T., et al 2009, Computational assessment of blockage and wind simulator proximity effects for a new full-scale testing facility, Wind and Structures, Vol. 13 No. 1, 21-36
Cook, N. J., 1985. The designer's guide to wind loading of building structures. Garston, Watford: Building Research Establishment, Dept. of the Environment. USA
Dagnew, A., 2012. Computational Evaluation of Wind Loads on Low and High- Rise Buildings (Doctoral Dissertation).
Federal Emergency Management Agency (FEMA), 1993. Building Performance:
Hurricane Iniki in Hawaii - Observations, Recommendations, and Technical Guidance. Federal Emergency Management Agency.
Federal Emergency Management Agency (FEMA), 2010. Wind Retrofit Guide for Residential Buildings. Federal Emergency Management Agency.
Jacklin, R., El Damatty A. A., Dessouki, A. A., 2014. Finite-Element Modeling of a Light-Framed Wood Roof Structure. Wind and Structures, Vol. 19 No. 6, 603-621
Morrison, M. J. (2010). Response of a Two-Story Residential House Under Realistic Fluctuating Wind Loads. (PhD Thesis). London, Ont.: Department of Engineering, The University of Western Ontario.
Luzzi, J., 1999. U.S Patent No. 5881499. Washington, DC: U.S. Patent and Trademark Office.
Reed, T. D., Rosowsky, D. V. and Schiff, S. D. (1997). Uplift capacity of light-frame rafter to top plate connections. Journal of Architectural Engineering, 3(4), 156-163.
Roof Damage and Insurance., 2016, July 29, Retrieved December 25, 2016, from http://www.insurance.com/home-and-renters-insurance/coverage/have-a-20-year-old-roof-you-may-lose-your-homeowners-insurance.html
Stewart, M. G., 2003. Cyclone damage and temporal changes to building vulnerability and economic risks for residential construction. Journal of Wind Engineering and Industrial Aerodynamics, 91(5), 671-691
Tsoumis, G. 1991. Science and technology of wood: structure, properties, utilization. New York: Van Nostrand Reinhold.
van de Lindt, J., Graettinger, A., Gupta, R., Skaggs, T., Pryor, S., and Fridley, K., 2007. Performance of wood-frame structures during Hurricane Katrina. Journal of
2
Structural Behaviour Analysis of a Reduced Scale
LFWS Subject to Wind Load
2.1
Introduction
Connections in the vertical load path of light-frame wood structures (LFWSs) allows the
sheathing to transfer vertical forces imposed on the roof to the trusses beneath, then further
to the stud walls and through to the foundation. Historically, sheathing connections to roof
trusses and the roof truss connections to stud walls are typically nailed, with poor
withdrawal resistance (FEMA, 1993; van de Lindt et al., 2007). After Hurricane Andrew
in 1993 caused considerable economic losses, largely due to the failure of roofing system
components (Baskaran and Dutt, 1997), building codes across North America began to
reflect the need for increased capacity in these connections. Since the building code
changes only affected new construction, it left older structures prone to damage during high
speed wind events. This became evident in the aftermath of Hurricane Katrina, where older
structures experienced considerable damage (van de Lindt et al., 2007).
Though there exist retrofitting options for older structures such as adhesives, straps,
hurricane ties, and the installation of additional studs (FEMA, 2010), these options are
relatively invasive and are approximately 15-50 % of the cost of the structure to implement
(Stewart et al, 2003). This points to a need for a low-cost, and minimally invasive method
of improving vertical load paths.
One such method is the roof harness, where a mesh of cabling or fabric covers the roof and
is tethered to either the foundation of the structure or surrounding piles. The harness is
designed for temporary application in the event of a high wind speed event warning, and
exist various patents for roof harness systems (Bimberg 1997; Luzzi 1999), the system
developed by Jacklin and El Damatty (2014) shown in Figure 2.1 seeks to address issues
apparent in their design through improving modularity, increasing stiffness, and reducing
the weight of the retrofit system. The proposed roof harness retrofit system consists of
modular strips of bearing cables connected through rigid bars to two external cables which
are anchored to piles surrounding the structure.
External Cable
Rigid Bars
Bearing Cables
Figure 2.1 Retrofit system proposed by Jacklin and El Damatty (2014)
Finite element analysis (FEA) and experimental testing are performed to understand the
structural behaviour of this roof harness configuration and the underlying roof. The primary
objective of the experimental testing is to first determine the capacity of the roof through
RTWC failure, and then comparatively examine the performance of the roof with the
harness.
Experimental testing involves subjecting a whole structure to a range of wind speeds,
on inter-truss load sharing and non-linear roof-to-wall connection behaviour. The
WindEEE Dome in London, Canada is chosen as the testing facility as the exterior platform
can accommodate a large test specimen that is loaded until failure. A three-dimensional
contraction is used to increase the incident wind velocity and direct the flow at the test
specimen.
The test specimen is designed such that (i) failure occurs at a sufficiently small fraction of
the maximum available wind velocity, (ii) RTWC failure is the primary failure mode, (iii)
its geometry is sufficiently within the wind-field generated by the contraction, and (iv) the
demand-capacity ratios of structural members are similar to the full scale structure.
To reduce the capacity of the RTWC connections while maintaining a ductile failure mode
similar to full scale nailed connections, smaller nails are evaluated as potential candidates.
Using a simple displacement controlled apparatus, the average force-displacement
relationship is determined for a variety of smaller candidate nails. FEA models of potential
configurations for the reduced scale structure are then generated using non-linear springs
to model the RTWCs and loaded with the pressure coefficient distribution generated from
Rosenkrantz and El Damatty (2016). However, due to minimum bounds in observed nail
candidate capacity, the number of trusses are reduced in the final test specimen
configuration to promote failure at the target velocity.
Once the configuration of the reduced scale structure is determined according to the
capacity of the reduced RTWC, a static non-linear analysis of the structure using the newly
developed RTWC constitutive relationship is conducted assuming full scale members
converge. Iteratively, the cross-section dimensions are optimized such that the demand
capacity ratios of each structurally pertinent member are the similar to those in the full
scale structure loaded at the same fraction of the failure load.
Length and strength scaling can be valuable tools to destructive experimental research by
reducing the amount of space and load required of testing apparatuses. The primary goal
of this paper is to demonstrate the ability of these techniques applied to a LFWS in
accurately replicating the failure mode observed in full scale structures. The secondary
goals are to prove the accuracy in which the FEA can model the recorded failure mode,
and to assess the sensitivity of structural behaviour to various RTWC constitutive relations.
2.2
Testing Environment, Initial Specimen Geometry and
Load Effects
Testing Environment
This section focusses on prior work by Rosenkrantz and El Damatty (2016). The WindEEE
Dome at the University of Western Ontario is selected as the testing venue as its ability to
accommodate outdoor testing greatly reduces the risk of facility damage when performing
destructive tests. Outdoor testing requires the dome to act as an open circuit wind tunnel
where two garage doors on opposite ends of the hexagonal structure open to allow air to
pass through. However, since reverse flow from the fans produced relatively low wind
velocities, a three dimensional linear contraction is employed to increase the incident wind
velocity.
The dimensions of the resulting wind field cover a 1.9 m height and a 6 m width. The mean
measured via cobra probes, measuring the wind profile and assess the propagation of the
jet flow through the incident portion of the wind field.
a) b)
Figure 2.2 Measured velocity and turbulence intensity profiles respectively
Decay in both wind velocity and flow smoothness is noticeable near the sides and top of
the wind field, where the jet mixes with the relatively stagnant outdoor air. The dimensions
of the proposed test specimen are designed to be within the uniform range of the contour
plots, resulting in uniform flow across the windward face of the specimen. Though uniform
flow produces different pressure distributions over a structure than a more realistic
boundary layer flow, it is important to note that the wind field in this experiment is not
intended to simulate reality. As such, it is used as a structural loading mechanism used to
conveniently compare suction induced behaviour over complex test specimens under
Specimen Geometry
The geometry of the test specimen was designed to (i) fit within the uniform area of the
wind field and (ii) promote failure in the RTWC at a suitably low wind velocity. The latter
criteria is to allow the retrofitted structure to have a substantial margin of velocity with
which to demonstrate a performance improvement. To determine the geometry of the test
specimen, a variety of augmentations are applied to the FEM developed by Jacklin and El
Damatty (2014). At the outset, the size of the structure is reduced to 3 m square by 0.9 m
at the eave height to fit within the wind field. Additionally, since the house is tested at an
incident angle of 0 ̊, the roof pitch is decreased from 4:12 to 3:12 to promote greater flow
separation and consequently greater suction across the roof. The RTWCs are then modelled
as pin connections simply to assess the load attributed to each model, and all member sizes
are left as in the full scale model. Using the CP distribution developed from wind tunnel
tests by Dagnew et al (2012) for a similar roof shape, a static pressure distribution is applied
over the roof corresponding to 30 m/s, produced by the contraction apparatus at
approximately 75% fan speed. A linear static analysis is performed, indicating a need to
reduce the number of trusses from 16 to 4 such that tributary area allocated to each RTWC
can be maximized. Given the relatively small number of trusses, the end trusses are
designed to simulate interior trusses to prevent significant load attraction to much stiffer
gable end trusses. This is done by replacing plywood cladding with reinforced plastic
sheeting and removing stud wall supports along the truss length, ensuring that the end
trusses have no added in-plane stiffness from cladding while sealing the building envelope,
Wind Load Effects
From this analysis, the geometry of the structure is set and a rough estimate of the RTWC
uplift forces are generated and deemed suitable. A prototype specimen then is built and
tested in the apparatus at a variety of fan speeds to establish the effects of the applied wind
field, namely the suction distribution across the roof and the RTWC uplift forces.
The roof is outfitted with 40 differential pressure transducers distributed across the roof.
One port on each pressure transducer is directly exposed to the exterior and interior of the
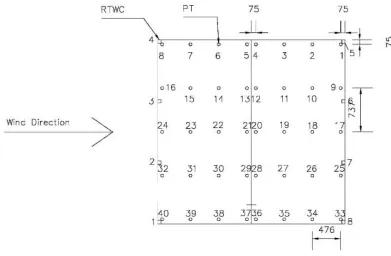
roof. A schematic of the instrumentation is shown in Figure 2.3 below.
Figure 2.3 Diagram of pressure transducer and load cell layout
The wind profile used in this experiment is very uniform, and produces atypically even
pressure distributions over the roof of the specimen. Borrowed from Cook (1985), Figure
2.4 a) and b) show the difference in pressure distribution over the top of a cube in uniform
a) b)
Figure 2.4 CP distributions over flat roof in a) uniform and b) boundary layer flows
The uniform profile produces a comparatively even pressure distribution since there is a
lack of Reynolds stresses encouraging flow reattachment (Cook, 1985). Similarly, the
pressure distribution observed from the test is notably uniform. Figure 2.5 shows the test
results compared to experimental results of a specimen with a similar 3:12 slope gable roof
tested in boundary layer flow with a roughness length of z0 = 0.23 m, similar to suburban
exposure (Dagnew, 2012).
The shape of the two curves are qualitatively similar, however the separation and
reattachment of flow at the windward edge and peak of the roof are significantly less in
uniform flow. Though undetected along the centre of the roof, since the eave height of the
test specimen is relatively high, erosion of the wind field may introduce pressure variation
near the edges of the roof towards the leeward half. Though the pressure profile does not
simulate reality, it does impart the required pressure to generate failure.
Uplift forces are measured by push-button style load cells under each RTWC. Since these
load cells can only measure compression, weights are hung between the roof trusses near
the RTWCs. This imparts an initial compressive force at the RTWCs greater than the
maximum expected value of uplift, so that the load cells are constantly in compression and
the roof remains fixed to the walls. RTWC reactions are then measured as a decrease in the
initial load. Table 2.1 shows the average RTWC reaction recorded at each fan speed. The
location of each RTWC is as outlined in section 2.2 previously.
Fan
Speed RTWC 1 RTWC 2 RTWC 3 RTWC 4 RTWC 5 RTWC 6 RTWC 7 RTWC 8
50% 101.5 206.9 184.2 101.5 43.9 86.8 81.9 26.1
60% 153.1 290.8 265.1 153.1 68.3 123.0 118.4 40.8
75% 229.5 430.5 408.1 229.5 99.9 173.3 158.5 65.6
Table 2.1 Average RTWC reaction (N)
RTWCs 1-4 recorded larger uplift due to the localized effects of flow separation in this
area. Further, the RTWCs experience uplift proportional to the tributary area allocated to
them, since there is no failure-induced load redistribution experienced in this test.
Consequently, end truss RTWCs 1, 4, 5, and 8 recorded approximately half the load
At 50% fan speed, the RTWC uplift force of approximately 207 N was chosen as the
criterion regarding average maximum ultimate failure capacity for selection of a smaller
nail for the reduced RTWC. Assuming that failure of the unretrofitted structure initiates at
50% fan speed, this offers the retrofitted structure a margin of 50% fan speed to
demonstrate performance enhancement.
2.3
Strength Scaling and the Design of a Reduced Strength
Scaled LFWS
Concept of Structural Scaling
In cases where the dynamic effects of loading can be neglected, as in the case of a typical
LFWS subject to wind loading, strength scaling can be applied to mimic the structural
behavior of a full scale structure on a reduced length scale. This is achieved by preserving
the demand-capacity ratios of individual structural members relative to each other. To
provide a basis for comparison, the demand-capacity ratios of individual structural
members are compared to the ratio of the current wind velocity to the velocity that initiates
failure.
The reduced length scaled test specimen is designed such that failure mode of interest
initiates at the desired velocity and that the structural behavior resembles that of the full
scale structure. Since RTWC failure is isolated as the governing failure mode, alternatives
for full scale RTWCs are sought to reduce the capacity of the connection while maintaining
a similarly ductile constitutive relation. Once the properties of a suitable reduced capacity
RTWC are established, an iterative comparison of the full and reduced scale FEMs are
carried out using incrementally increased uniform loads using a static non-linear analysis.
demand capacity ratios at any given fraction of the failure loading conditions are similar to
those in the full scale structure. RTWC demand capacity ratios are also compared in the
same manner with the expectation that these values are unity when failure loading
conditions are applied.
RTWC Scaling
2.3.2.1 Literature Review
The RTWC research regarding toe-nail connection withdrawal behaviour is sourced from
studies that used both load and displacement controlled approaches. Reed et al. (1997)
provided a ramp load used to induce a continuous rate of displacement between 2.54
mm/min. and 5.08 mm/min. The resulting deflection curve shown below was established
from load-deflection measurements collected every 3.2 mm up to 12.7 mm, 1/5 of the total
nail length. The most common failure mode of the toenail connection was pullout from the
top plate.
More detailed testing of test samples focusing solely on toe-nail connections was
conducted by Morrison (2010) and Khan and Kopp (2012). These studies compared the
effects of withdrawal using ramp loading and simulated wind loading. Morrison (2010)
provide Table 2.2 shown below comparing the distribution of failure types among the
tested specimens, and the correlation of failure type to mean failure capacity.
Failure Mode % of Failures
All Nails Split 8 %
D-Side Split 21 %
S-Side Split 6 %
All Nails Pull Out 65 %
Khan and Kopp (2012) have performed further testing on toe-nailed connections and have
produced an average load displacement curve, shown in Figure 2.6 below, for 35 samples
subjected to an 8 kN/min ramp load.
Figure 2.6 Typical force – displacement relationship (Khan and Kopp, 2012)
Further, statistics of the parameters from both bi-linear and curvi-linear fits were generated
to assess the non-linear response. The bi-linear statistics, shown in the Table 2.3 below, are
used for simplicity as a benchmark for assessing behaviour similarity.
Statistics
Yield Capacity,
𝐅𝐲 (kN)
Yield Displacement,
𝐃𝐲 (mm)
Initial Slope, 𝐊𝟎 (mm) Failure Capacity,
𝐅𝐜 (kN)
Failure Displacement,
𝐃𝐜 (mm)
Secondary Slope,
𝐊𝟏 (mm)
Mean 1.17 1.22 1.06 2.84 10.57 0.19
Maximum 2.26 2.15 2.61 3.93 17.48 0.28
Minimum 0.59 0.55 0.46 1.97 5.06 0.05
Std. Dev. 0.36 0.41 0.47 0.57 3.41 0.06
COV 0.31 0.33 0.45 0.20 0.32 0.31
2.3.2.2 Test Description
The criteria governing nail size selection for the reduced scale RTWCs is simply to reduce
the capacity of the connection as much as possible while maintaining similarity in
withdrawal response to a full scale toe-nail connection. Therefore, testing began with ten
connection samples using 2D common nails, the smallest size framing nail available that
had no supplementary shank features to improve withdrawal strength such as spiraling or
rings. However, before connections using the 2D nail are tested, ten connection samples
using 12D spiral shank are tested and the results were compared to those from literature to
verify the testing method and identify any skewness in the data.
All test specimens consist of a 1’ long 2” x 4” segment simulating the roof truss and two
1½’ long 2” x 4” segments simulating the top plate. The segments simulating the top plate
were fastened together with six 1½” long deck screws to ensure that any relative
displacement would occur exclusively between the roof truss and the top plate segments.
Further, two metal contact points are installed on either end of the roof truss segment where
displacement from the jacks is applied. Three nails are hand driven through the roof truss
to the top plate in according to the schematic shown in Figure 2.7 below. There is an s-side
and a d-side, corresponding to the side of the sample with a single nail and double nails
respectively. The wood used was No. 1 grade SPF, and was qualitatively dry. The moisture
content was not quantitatively verified as this parameter is known to have a negligible
effect on withdrawal behaviour, when compared to factors such as fabrication (Khan and
Figure 2.7 Toe-nail connection schematic (AWC, 2007)
The test apparatus used two hand operated hydraulic jacks to induce discrete displacement
between rates of approximately 6 mm/min to 12 mm/min. This is slightly faster than the
rate of displacement used by Reed et al (1997) but within the envelope specified by ATSM
D1761. There are four load cells that act as a force balance, and are located on top of the
jack crossheads and at either end of the top plate segment. An average of the sum of forces
recorded at the load cells above the crossheads less the own weight of the specimen and
instruments and of the sum of forces recorded at the load cells at either end of the top plate
are what is used to determine the force the total uplift force on the test specimen.
Displacement was recorded with a linear variable displacement transducer installed above
the roof truss segment. The configuration shown in Figure 2.8 below allows top plate
segment to be braced against the inside of the hollow steel section while the roof truss
Figure 2.8 Toe-nail connection test setup
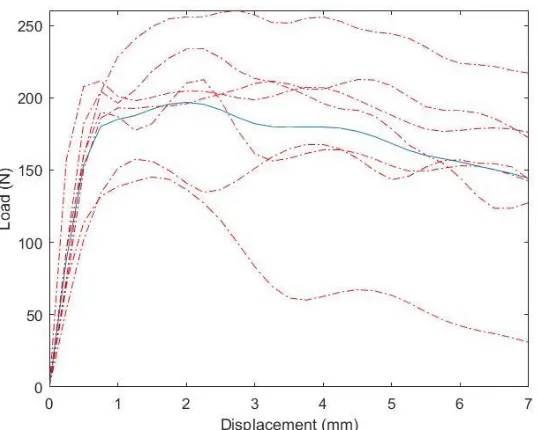
2.3.2.3 Compare Observed 12D Results to Literature
The typical force-displacement curve is the calculated as the average withdrawal force in
eight of the tested toe-nail connection samples, where the curves with the highest and
lowest ultimate capacity are removed. As displacement was applied in discrete increments,
removing the effect of relaxation was done by fitting smoothing spline with a smoothing
parameter value of 0.9 to the force-displacement relations of each sample, as shown in
Figure 2.9 RTWC test sample 2 with and without smoothing
As the force-displacement curves are fitted as functions of displacement, the typical curve
is then simply the average of the fitted withdrawal force for each sample for every value of
displacement between 0 mm and 20 mm, or approximately half the embedment length. The
calculated average curve is shown in Figure 2.10 below.
12D spiral nails were specifically chosen as a test control, to be compared to the data
produced by Khan and Kopp (2012) using the same nail in a similar set of tests. This data
will be referred to in this paper as the ‘literature’. To quantitatively assess behavioural
similarity to the literature, the bi-linear statistics for the above figure are presented in Table
2.4 below. As in the literature, an arbitrary selection method is used to determine the yield
point.
Statistics
Yield Capacity,
𝐅𝐲 (kN)
Yield Displacement,
𝐃𝐲 (mm)
Initial Slope,
𝐊𝟎 (mm)
Failure Capacity,
𝐅𝐜 (kN)
Failure Displacement,
𝐃𝐜 (mm)
Secondary Slope,
𝐊𝟏 (mm)
Mean 1.50 1.24 1.21 2.05 8.24 0.16
Maximum 2.10 1.35 1.60 3.43 16.10 0.09
Minimum 1.20 1.05 1.14 1.27 1.50 0.16
Std. Dev. 0.31 0.11 0.24 0.68 5.66 0.06
COV 0.20 0.09 0.20 0.33 0.69 0.40
Table 2.4 Typical bi-linear force – displacement statistics from displacement test
Though the range of the test statistics is somewhat small compared to the literature, the
failure capacity and displacement are both still highly dependent on the type of failure
initiated. The difference between these test values and the values produced by Khan and
Kopp (2012) as a percentage of the latter are presented in Table 2.5 below.
Percent Difference Yield Capacity Yield Displacement Initial Slope Failure Capacity Failure Displacement Secondary Slope Mean 28.21 % 1.64 % 14.15% 27.82 % 22.04 % 15.79 %
Maximum 7.08 % 37.21 % 38.70 % 12.72 % 7.89 % 67.86 %
Minimum 103.39 % 90.91 % 147.83 % 35.53 % 70.36 % 220.00 %
Std. Dev. 13.89 % 73.17 % 48.94 % 19.30 % 65.98 % 0.00 %
COV 35.48 % 72.73 % 55.56 % 65.00 % 115.63 % 29.03 %
Given the highly variable nature of wood product performance, the difference between the
mean bi-linear test statistics and those from Khan and Kopp (2012) demonstrate a good
agreement. Further, the failure mode of each sample are documented in Table 2.6 below.
Failure Mode % of Failures
All Nails Split 10 %
D-Side Split 30 %
S-Side Split 20 %
All Nails Pull Out 40 %
Table 2.6 Failure mode statistics from test
Though this distribution is more even across all failure modes than as recorded in the
literature, the two obvious modes of the data correspond with similar modes in the
literature. As the population of this test includes only ten specimens, the expectation is that
an increase in the number of specimens would allow the current distribution to approach
that of the literature.
The agreement between both the distributions of failure mode and characteristics of the
force displacement relationships indicate that the test design is valid and that it is suitable
for determining the behaviour of similar toe-nail connections using different nail sizes.
2.3.2.4 Compare 2D Curve and Types of Failure Observed to
Literature
The same method of generating the typical force displacement relationship of connections
using the 12D spiral nail is used for connections using the 2D common nail. However,
while loading the apparatus one of the specimens broke due to the small size of nail used,
Again, a smoothing spline was fitted to the force displacement relationship for each
specimen with a smoothing parameter of 0.9 to remove the effects of relaxation. Then, an
average of each of the fitted functions is determined over the interval of 0 mm to 7 mm,
approximately half the embedment length of the nail. The typical force displacement curve
is shown in Figure 2.11 below.
Figure 2.11 Typical 2D force – displacement curve from test
Importantly, the above 2D withdrawal curve demonstrates an approximate tenfold
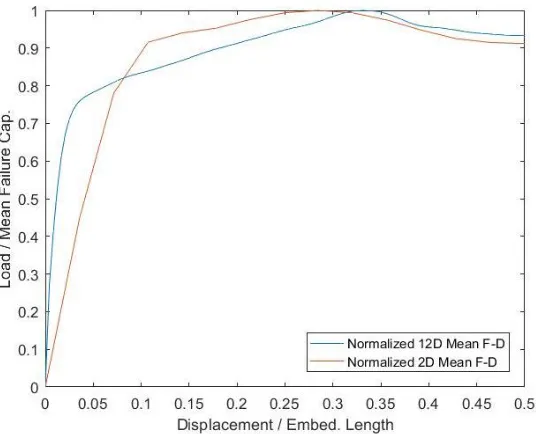
reduction of ultimate failure capacity compared to a connection using 12D nails. However,
to compare the behaviour of the curves from the 12D and 2D nails, both sets of data need
to be normalized. Therefore, the withdrawal load is normalized to the average failure
capacity and the displacement is normalized to the vertical embedment length of the toenail
connection. Figure 2.12 below shows both the 12D and 2D normalized force displacement
Figure 2.12 Normalized mean force-displacement curves
The statistics of the normalized mean curves are described in Table 2.7 below.
Normalized Mean Statistics
Yield Capacity
Yield Displacement
Initial Slope
Failure Capacity
Failure Displacement
Secondary Slope
2D 0.85 0.10 8.50 1.00 0.28 0.83
12D 0.75 0.03 25.00 1.00 0.33 0.83
% Diff. 11.76% 70.00% 194.12% – 17.00% 0.00%
Table 2.7 Bi-linear parameters for 2D and 12D normalized typical force – displacement
The most apparent difference in behaviour between the two nail sizes is the mean
normalized initial slope. The 12D connections tended to have a much greater initial
stiffness, possibly due the spiraled shank. However, the secondary slope is virtually
identical and there are only small differences in both the yield capacity and ultimate failure
displacement.
The failure modes of the two tests and the test from the literature are compared in Table