Journdl of
Volume 12, Number 1 January, 1959RANGE
MANAGEMENT
----
Grazing Intensity Trials on Seeded Ranges
In the Ponderosa Pine Zone of Colorado
W. M. JOHNSON
Range Conservationist, Rocky Mountain Forest and Range Experiment Stationl, Fort Collins, Colorado.
Seeding ranges for the im- provement of forage values is now a recognized practice. De- pleted ranges and abandoned farmlands in the ponderosa pine zone of Colorado can be success- fully seeded (Hull and Johnson, 1955). The kind of grass to plant, when, where, and how, have been determined through re- search, but comparable informa- tion on how to graze seeded ranges is scarce. Proper grazing use of established stands is es- sential to good management.
The Rocky Mountain Forest and Range Experiment Station conducted a study to determine the proper degrees of grazing use on some of the more important grasses used in seeding. The study was made from 1946 to 1956 at the Manitou Experimen- tal Forest, 28 miles northwest of Colorado Springs, Colorado.
Seeded Ranges
Seeded ranges consisting of four separate grasses and one mixture were established on abandoned fields. Crested wheat-
IMaintained by the Forest Service, U. S. Department of Agriculture, in cooperation with Colorado State University, Fort Collins, Cololrado. Author stationed at Laramie, Wyo- ming, in cooperation with Univer- sity of Wyoming.
grass (Agropyron cristatum),
smooth brome (Bromus inermis)
and a mixture consisting of two parts crested wheatgrass, two parts smooth brome, and one part yellow sweetclover (Melilo-
tus officinalis) were planted in the spring of 1946. Intermediate wheatgrass (Agropyron inter- medium) was planted in the spring of 1948. Russian wildrye
(Elymus junceus) was planted in the spring of 1949. All seedings were given two complete grow- ing seasons to become established before the grazing treatments were applied.
The study consisted of two blocks of experimental paddocks or units. In each block each spe- cies and the mixture were planted in a lo-acre area. The 10 acres were subdivided into one 5-acre unit for moderate stock- ing, one 3-acre unit for light stocking, and one 2-acre unit for heavy stocking.
Grazing Procedure
Grasses were grazed to cer- tain stubble heights to represent the different grazing intensities. For all ranges except those seed- ed to Russian wildrye, these stubble heights were established as 2 inches to represent heavy grazing, 4 inches for moderate grazing, and 6 inches for’ light grazing. Corresponding stubble
I
heights for the shorter Russian wildrye were 1% inches, 3 inches, and 4% inches. Growth rate exceeded the rate of utiliza- tion, so that at the peak of growth leaf heights were usually well in excess of the prescribed stubble heights. Stubble height measurements were converted to percent-volume utilization by height-weight tables (Lommas- son and Jensen, 1943).
Following these guides, graz- ing ordinarily commenced in late April or early May, and con- tinued through to the end of Oc- tober. In years of low yields, however, cattle were removed somewhat earlier or intermit- tently as the desired stubble heights were reached.
Four yearling Hereford heifers were assigned at random to each lo-acre area. They were divided into two groups of two animals and rotated at weekly intervals in such a manner that two ani- mals were always on the mod- erate-use unit. Grazing on the light- and heavy-use units was on a “week-on, week-off” rota- tion.
Whenever possible, heifers were placed on the seeded range when leaf height in the lightly- grazed units averaged 4 inches. This was sometimes delayed be- cause of spring snow storms. They were left on the experi- mental areas, following the pre- scribed rotation, until the de- sired utilization was obtained. If sufficient regrowth occurred after the heifers were removed, they were again put on the range and the areas were re- grazed.
2
in terms of herbage production and vigor. These were measured each year.
The prescribed stubble heights were obtained within reasonable limits of variation. Average stub- ble heights at the end of the grazing period seldom varied more than 0.2 inch from the pre- scribed amount, except on the areas grazed to a 6-inch stubble height. Here the maximum aver- age variation for any grass and any year was 1 inch. In most cases the deviation was within 0.5 inch of the 6-inch height. .
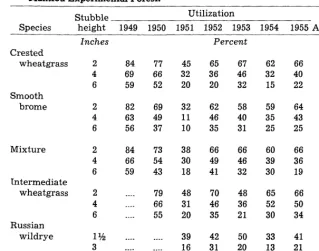
Utilization
Utilization, when expressed as percentage of weight removed, varied greatly from year to year (Table 1). This was to be ex- pected since the utilization goals were based on leaving an almost constant volume of the grasses ungrazed regardless of the amount of growth during the year. During years of poor growth, such as 1951, the percent- age of herbage removed was very low. When the grasses made good growth, as in 1949, the per- centage of herbage removed was high.
On crested wheatgrass, utiliza- tion averaged 67 percent for the 2-inch stubble height treatment, but varied from 45 percent to 84 percent. Average utilization for the 4-inch stubble height units was 46 percent; and for the 6- inch treatment, 31 percent. Vari- ation between years for the 4- and 6-inch treatments was of about the same magnitude as for the 2-inch treatment.
Herbage utilization on smooth brome averaged 61 percent for the a-inch stubble height treat- ment, 41 percent for the 4-inch stubble height, and 31 percent for the 6-inch stubble height. The variation between years was even greater than on crested wheatgrass. For example, the percent utilization on the 2-inch stubble height treatments varied from 32 percent in 1951 to 82 per- cent in 1949.
W. M. JOHNSON
Table 1. Percenj utilization of herbage on seeded ranges, 1949 fo 1955, Manifou Experimental Forest.
Stubble Utilization
Species height 1949 1950 1951 1952 1953 1954 1955 Average
Inches Percent
Crested wheatgrass Smooth brome Mixture Intermediate wheatgrass Russian wildrye
2 84 77 45 65 67 62
4 69 66 32 36 46 32
6 59 52 20 20 32 15
2 82 69 32 62 58 59
4 63 49 11 46 40 35
6 56 37 10 35 31 25
2 84
4 66
6 59
2 4 6 1% 3 4% ___* ____ 73 54 43 79 66 55 _.-- _.-- __-_
38 66 66 60
30 49 46 39
18 41 32 30
48 70 48 65
31 46 36 52
20 35 21 30
39 42 50 33
16 31 20 13
12 17 10 4
66 67
40 46
22 31
64 61
43 41
25 31
66 65
36 46
19 35
66 63
50 47
34 33
41 41
21 20
10 11
Utilization on the mixture units was similar to that on the smooth brome and crested wheatgrass units. Utilization averaged 65 percent on the 2-inch stubble height, 46 percent on the 4-inch stubble height, and 35 per- cent on the 6-inch stubble height. Variation in use between years was of about the same magnitude as for crested wheatgrass.
There was considerable differ- ence in the utilization of crested wheatgrass and smooth brome in the mixture units, especially in the 4- and g-inch stubble height treatments. Smooth brome was grazed more closely than crested wheatgrass. Comparative aver- age stubble heights for the two grasses were:
Actual stubble height
Stubble in inches
height Crested Smooth
in inches wheatgrass brome
2 2.2 1.8
4 4.4 3.5
6 6.5 4.0
This indicates a preference by cattle for the smooth brome.
Utilization on the intermediate wheatgrass followed the same
pattern as on the other grasses. For the 2-inch stubble height, percent utilization averaged 63 percent, 47 percent on the 4-inch stubble, and 33 percent on the 6- inch stubble.
Average utilization of Russian wildrye was 41 percent on heav- ily grazed units, 20 percent on moderately grazed units, and 11 percent on the lightly grazed units. Because of the shorter type of growth, these rates of use were considerably less than those for other grasses. Varia- tion in use from year to year was also less than for other grasses. because there was less variation in the height growth of the leaves.
Vigor
Plant vigor as reflected in height growth is often used as a measure of the effect of grazing intensity (Short and Woolfolk, 1956). In this study, leaf height at the start of the grazing period was used as an indication of rela- tive vigor.
GRAZING SEEDED RANGES IN THE PINE ZONE OF COLORADO 3 tial height growth was 3.8 inches
as compared with 4.5 inches for the 6-inch stubble height, and 4.4 inches for the 4-inch stubble height.
Similar differences in vigor were observed on all of the other grasses in the study, but the amount of change varied with the kind of grass. Comparable average initial heights for the four grasses are as follows:
Treatment Species -
Z-inch 4-inch g-inch Crested
wheatgrass 3.8 4.4 4.5
Smooth
brome 3.4 4.1 4.2
Intermediate
wheatgrass 3.6 4.4 4.5
1 yZ -inch 3-inch 4 % -inch Russian
wildrye 3.8 4.2 4.2
Differences in initial height growth were most pronounced in intermediate wheatgrass and least in Russian wildrye. It is also apparent that the 4- and 6- inch stubble height treatments had no effect on height growth.
The initial heights of leaves showed a definite relation to grazing intensity and indicated that plant vigor was decreased or that initial rates of growth of all species were at least slowed down by the heavier rates of grazing.
Herbage Production
Herbage yields were obtained from plots protected from cur- rent grazing by portable ex- closures or cages and clipped at maturity, air-dried, and weighed. Regrowth produced in 1953 was also harvested and added to the first clipping to give total pro- duction. Herbage yields of all the grasses varied widely.
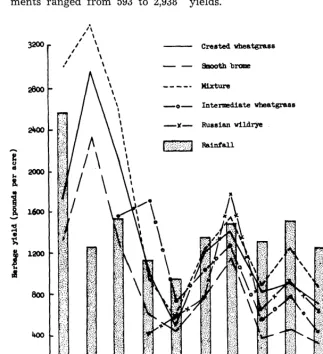
After the initial period of es- tablishment, rainfall seems to be the most important single factor in determining herbage yields (Fig. 1). During the third year after planting, the yield of herb-
age
from all grasses except Rus- sian wildrye reached a peak ofproduction, then stabilized in re- lation to rainfall. Yields of Rus- sian wildrye continued to in- crease until the fifth year. How- ever, precipitation also increased during the fourth and fifth years after the low of 9.70 inches in the third year; hence, the difference shown may be a response to in- creased moisture.
The peak yield for the crested wheatgrass, smooth brome, and mixture occurred in 1948; for in- termediate wheatgrass in 1950, and for Russian wildrye in 1953. It would appear that during the first and second years the root systems are being established and by the third year are suf- ficiently strong to make full use of the available soil moisture. Average herbage yield for crest- ed wheatgrass from all treat- ments ranged from 593 to 2,938
pounds per acre. For the other grasses it was as follows: smooth brome, 347 to 2,320 pounds per acre; mixture, 537 to 3,314 pounds per acre; intermediate wheat- grass, 406 to 1,769 pounds per acre; and for Russian wildrye, 506 to 1,683 pounds per acre. Re- growth was produced by all spe- cies in 1953 and was especially high in Russian wildrye, con- tributing 47 percent to total pro- duction.
During the period from 1947 to 1950, the mixture produced significantly more herbage than either the crested wheatgrass or smooth brome plantings. It is believed that the addition of the yellow sweetclover to the mix- ture of crested wheatgrass and smooth brome was largely re- sponsible for the increase in yields.
- Crested wheatgrass
--
3aoothbraPe___w- &&w
-o- Intermediate wheatgrass
FIGURE 1. Average herbage tou Exp lerimental Forest.
4
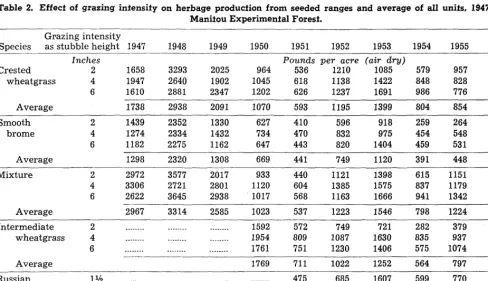
Grazing Intensify and Herbage Yields
Grazing crested wheatgrass to a 2-inch stubble height had little effect on herbage even after 9 years of use (Table 2). Under this intensity of grazing, all of the plants in the units were grazed rather uniformly. During some years, such as 1950, 1951, 1953, 1954, and 1956, yields were lower, but in other years yields tended to equal or exceed those from areas receiving the other treat- ments. Grazing use in the 4- and 6-inch stubble height treatments was very spotty. , Some plants
were grazed very closely, while others were untouched. Those plants left ungrazed one year were not grazed the following year because of the accumulation of old growth. This condition was corrected by mowing in early spring to remove the old growth in an attempt to obtain relative- ly uniform grazing.
In comparison with the 4- and 6-inch grazing treatments, smooth brome began to decline
W. M. JOHNSON
in yield under the 2-inch treat- ment in 1952, but the big de- crease was first noticeable in 1954. During the rest of the study, yields on areas grazed to a-inch stubble were approxi- mately half the yields on the areas grazed to 4- or 6-inch stub- ble heights. There was no sig- nificant difference between the yield of the areas grazed to the 4- and g-inch stubble heights.
No significant decreases in herbage yield have occurred on the mixture pastures as a result of the grazing treatments. Yields decreased under all intensities of grazing from the high levels that were characteristic of the early years of the study. At the time of establishment the grass stands consisted of almost equal quanti- ties of crested wheatgrass and smooth brome, and in 1950 the yield consisted of 522 pounds per acre of crested wheatgrass and 501 pounds per acre of smooth brome. By 1955, crested wheat- grass was producing 1,183 pounds per acre, as compared with 41
pounds for smooth brome. At this time, the mixture under all intensities of grazing was pre- dominantly crested wheatgrass, and the few plants of smooth brome that remained were very low in vigor (Fig. 2).
As far as can be determined at the present time, the herbage yield of Russian wildrye has not been affected by any of the pre- scribed grazing intensities. Fluct- uations in yield have occurred as a result of rainfall variation, but are not related to grazing use.
Damaging effects of grazing to a 2-inch stubble height were re- flected in herbage yields of inter- mediate wheatgrass as early as the fourth year of grazing. By 1955, the sixth year of grazing, yields on the 2-inch stubble height treatment were only about one-third as much as on the lighter intensities of use. In 1956 the yield on areas grazed to a 4-inch stubble height were very low, but prior to 1956 they had not been significantly different
Table 2. Effect of grazing intensify on herbage production from seeded ranges and average of all units, 1947-1956, Manitou Experimental Forest.
Grazing intensity
Species as stubble height 1947 1948 1949 1950 1951 1952 1953 1954 1955 1956
Inches Pounds per acre (air dry)
Crested 2 1658 3293 2025 964 536 1210 1085 579 957 599
wheatgrass 4 1947 2640 1902 1045 618 1138 1422 848 828 683
6 1610 2881 2347 1202 626 1237 1691 986 776 765
Average 1738 2938 2091 1070 593 1195 1399 804 854 682
Smooth 2 1439 2352 1330 627 410 596 918 259 264 253
brome 4 1274 2334 1432 734 470 832 975 454 548 413
6 1182 2275 1162 647 443 820 1404 459 531 376
Average 1298 2320 1308 669 441 749 1120 391 448 347
Mixture 2 2972 3577 2017 933 440 1121 1398 615 1151 616
4 3306 2721 2801 1120 604 1385 1575 837 1179 946
6 2622 3645 2938 1017 568 1163 1666 941 1342 910
Average -2967 3314 2585 1023 537 1223 1546 798 1224 824
Intermediate 2 _ _ _ _ _ _ _ _ ____- ___ -_______ 1592 572 749 721 282 379 274 wheatgrass 4 ________ _ . _ _ . _ . . -_.__--- 1954 809 1087 1630 835 937 367 6 _ _ - _ _ _ _ _ _ _ _ _ _ _ _ _ -_____-- 1761 751 1230 1406 575 1074 576
Average 1769 711 1022 1252 564 797 406
Russian 1 Y2 --.- ---- ________ ________ --- 475 685 1607 599 770 598 wildrye 3 __I_____ ____- ___ -_______ __-__.__ 532 839 1620 526 841 708 4$ ________ ________ ________ _.______ 510 734 1824 743 1008 626
GRAZING SEEDED RANGES IN THE PINE ZONE OF COLORADO 5 from yields on the lightly grazed
unit.
Sfocking Rafes
An average of 45.6 heifer-days per acre was obtained by graz- ing crested wheatgrass to a 2- inch stubble for 7 years. How- ever, the fluctuations in use be- tween years was very wide and, as expected, correlated closely with herbage yield. The least stocking for this degree of use was 19.5 heifer-days per acre in 1954, and the greatest was 63.0 heifer-days per acre in 1949 (Table 3). Average stocking for the 4- and 6-inch stubble heights was 32.0 and 27.3 heifer-days per acre, respectively. No definite trends in use as related to graz- ing intensity are shown by the data on crested wheatgrass. Throughout the study the num- ber of heifer-days of grazing per acre was highest on the 2-inch stubble treatment, moderate on the 4-inch, and least on the 6- inch.
Unlike crested wheatgrass, the animal-months obtained from smooth brome reflect the effect of the different intensities of use. In the beginning, there was a relatively wide difference in stocking between the 2- and 4-
FIGURE 2. Original grass in the mixture pastures was half smooth brome and half crested wheatgrass. In 1955, smooth brome was confined to a few scattered plants and crested wheatgrass had taken over the site.
inch treatments. This difference was gradually reduced until in 1954 the two treatments required about the same stocking to give the required grazing intensities. In 1955, the 4-inch treatment ac- tually produced more animal- months. This follows the same trend established for herbage yields. It further substantiates the conclusion that grazing smooth brome to a 2-inch stubble height is injurious to the plants.
Stocking on the areas seeded
Table 3, Heifer-days of grazing on seeded ranges, 1949-1955, Manifou Experimental Forest
Stubble Heifer-days per acre
--
Species height 1949 1950 1951 1952 1953 1954 1955 Average -
Inches Number
Crested 2 63.0 48.5 33.0 54.5 49.2 19.5 51.2 45.6 wheatgrass 4 52.4 32.6 25.1 41.0 25.1 19.6 28.5 32.0
6 46.6 23.3 21.8 32.7 22.0 22.0 23.0 27.3
Smooth 2 55.0 39.2 22.0 28.0 24.2 14.0 18.2 28.7 brome 4 43.4 26.3 16.8 26.2 21.8 14.0 19.5 24.0 6 30.6 18.7 14.0 17.3 19.0 10.0 22.5 18.9
Mixture 2 68.5 50.5 33.2 50.0 51.2 22.0 55.2 47.2 4 65.8 33.6 22.3 38.2 32.2 19.4 44.9 36.6 6 51.3 24.6 17.0 31.0 24.0 22.0 45.0 30.7
Intermediate 2 ________ 64.5 27.5 39.2 35.2 14.0 13.7 32.3 wheatgrass 4 .__ .____ 46.8 31.2 38.1 35.0 21.2 33.8 34.3 6 ________ 40.6 22.6 31.0 39.2 16.0 25.6 29.2 Russian 1% .--- .___ *___ 39.7 48.2 53.0 36.5 52.2 45.9 wildrye 3 --- ________ 27.5 36.2 39.0 26.4 39.9 33.8 4% . . ..__._ ________ 21.3 34.5 37.5 23.7 37.2 30.8
to the mixture averaged higher
than that of the other seeded areas. The a-inch intensity aver- aged 47.2 heifer-days per acre; the 4-inch intensity averaged 36.6; and the 6-inch intensity, 30.7. The higher stocking oc- curred during the early part of the study, while yellow sweet- clover was still present and while smooth brome was still an important part of the forage. During the latter part of the study stocking on the mixture re- mained high, but, was exceeded occasionally by other grasses.
6 W. M. JOHNSON
FIGURE 3. After three years of grazing intermediate wheatgrass to a 2-inch stubble height, herbage yields had been significantly reduced and invading species were dominant in the stand.
Stocking rates on Russian other grasses was 41.5 heifer- wildrye were much higher than days per acre for crested wheat- would be expected from a com- grass, 21.3 for smooth brome, 42.3 parison of herbage yields with for the mixture, and 25.9 for in- other grasses. For the period termediate wheatgrass. The abil- 1951 to 1955, the average stocking ity of Russian wildrye to make of Russian wildrye grazed to a rapid and abundant regrowth, as 1%~inch stubble was 45.9 heifer- illustrated by the 1953 data, is no days per acre. For the compar- doubt responsible for the high able period, stocking for the stocking rates. So far, grazing heavy rates of grazing on the Russian wildrye to a lJ&inch
Table 4. Daily gain and gain per acre of yearling Hereford heifers on seeded pastures af Manifou, 1948-1956. (Average of all infensiiies of grazing)
Species
Crested wheatgrass
Smooth brome
Weight gain of heifers
1948 1949 1950 1951 1952 - 1953 1954 1955 1956 Average
per per per per per per per per per per per per per per per per per per per per day acre day acre day acre day acre day acre day acre day acre day acre day acre day acre
Pounds
1.41 1.78 1.52 1.93 1.85 1.45 1.88 1.66 1.85 1.70
82.2 98.3 50.0 44.1 76.3 56.8 10.3 64.5 54.0 59.6
1.29 1.95 1.32 2.12 2.60 1.74 0.74 1.92 1.59 1.70
75.4 83.7 35.0 35.7 62.1 48.0 2.8 38.5 33.2 46.0
Mixture
Intermediate wheatgrass
Russian wildrye
Native range
1.47 2.00 1.76 2.23 2.03 1.69 2.31 1.71 1.93 1.90
85.5 126.3 60.1 48.7 77.8 68.2 12.8 86.3 65.6 70.1
______ ______ 1.73 2.23 1.98 2.10 2.25 1.99 2.10 2.05
______ ______ 83.7 43.3 64.8 63.6 12.0 64.4 58.6 55.8
____-_ ______ ______ 1.51 1.58 1.37 1.48 1.98 1.77 1.62
._____ ______ _-____ 38.0 51.6 53.8 10.3 82.0 65.6 50.2
______ 1.63 1.58 1.46 1.69 1.92 1.54 1.48 1.56 1.61
stubble height has not had any apparent effect on stocking rate.
Cattle Gains
Daily cattle gains, based on average of all intensities of graz- ing on these seeded ranges, were good but not exceptional. Aver- age daily gain for crested wheat- grass was 1.70 pounds per head per day (Table 4). For the other grasses the daily gains were: smooth brome, 1.70 pounds; mix- ture, 1.90 pounds; intermediate wheatgrass, 2.05 pounds; and Russian wildrye, 1.62 pounds. Moderately grazed native bunch- grass ranges in the same area produced daily gains of 1.61 pounds per head for the period 1949 to 1955, inclusive.
GRAZING SEEDED RANGES IN THE PINE ZONE OF COLORADO 7 pounds of gain per acre; crested
wheatgrass, 51.0 pounds; inter- mediate wheatgrass, 51.1 pounds; Russian wildrye, 50.2 pounds; and smooth brome, 36.7 pounds. Native ranges on the Manitou Experimental Forest have aver- aged 12.7 pounds gain per acre. However, these include forest types as well as grassland, so are not directly comparable. Gain per acre is a function primarily of stocking which, in turn, is de- termined by herbage yield. For this reason, the fluctuation in gain per acre is closely related to fluctuation in herbage yield.
Discussion and Summary
Successful seeding of depleted farm and rangelands results in highly productive ranges. The yield of herbage can be increased manyfold and may be increased 3 to 5 times over that of good adjoining native range. Grazing capacities and beef production are also greatly increased. Suc- cessful seeding of a few acres of land may thus be sufficient to fill existing gaps in the yearlong feed program for livestock. It may provide needed forage for spring or fall use, or supplement summer grazing lands, or furnish additional hay for winter feed- ing.
However, seeding is not a cure- all for the problems of the live- stock operator. It in itself creates
additional problems of manage- ment that require careful con- sideration and wise planning.
One of the biggest problems centers around the large fluctua- tion in herbage yield from one year to the next. Herbage yields of crested wheatgrass, for in- stance, varied from 600 pounds per acre to 2,900 pounds per acre. Great flexibility in herd manage- ment would be needed to make wise and efficient use of the for- age available.
Crested wheatgrass was grazed to a 2-inch stubble height with- out seriously injuring the ability of the grass to grow and produce normal amounts of herbage. At this rate of grazing, there was some reduction in the initial growth rate, but this was appar- ently overcome during the grow- ing season and was not reflected in total herbage yields. Grazing crested wheatgrass to 4- or 6-inch stubble heights was not efficient from the standpoint of beef pro- duction and presented problems in uneven use of the forage. The relation of these grazing intensi- ties to longtime range mainte- nance was not determined, but it was observed that the 2-inch stubble left very little litter for maintaing good soil conditions.
A 4-inch stubble should be left on smooth brome. Closer graz- ing injures the plants. Vigor, as
measured by early leaf growth, is reduced and herbage yields are lowered.
Intermediate wheatgrass is in- jured quickly and seriously when grazed during the spring and summer to a 2-inch stubble height. Plant vigor as measured by initial height growth and herbage yields was greatly re- duced after only 2 years of graz- ing to this intensity. Grazing to a 4-inch stubble height did not appear to injure the plants.
Only 6 years of record are available for interpreting results on Russian wildrye, but so far grazing to a l%-inch stubble height has had little effect on herbage yield and, therefore, little effect on stocking rates. Perhaps a more conservative grazing use, say 2 inches, would be a safer approach until more definite results are available.
LITERATURE CITED
HULL, A. C., JR. AND W. M. JOHNSON. 1955. Range seeding in the ponde- rosa pine zone in Colorado. U. S. Dept. Agr. Cir. 953. 40 pp.
LOMMASSON, T. AND CHANDLER
JENSEN. 1943. Determining utiliza- tion of range grasses by height- weight tables. Jour. Forestry 41: 589-593.
SHORT, L. R. AND E. J. WOOLFOLK. 1956. Plant vigor as a criterion of
range condition. Jour. Range
Mangt. 9:66-69.
NEWLY ELECTED SOCIETY OFFICERS FOR 1959
Officers of the American Society of Range Management elected for the year 1959 are:
President: DONALD F. HERVEY, Colorado State University, Fort Collins, Colorado.
Vice President:
New Mexico. FRED H. KENNEDY, U. S. Forest Service, Albuquerque,
Board of Directors, 1959-61:
JOHN G. CHOHLIS, Western Livestock Journal, Sacramento, California,
Adequacy of Some Important Browse Species
In Overwintering of Mule Deer
ARTHUR D. SMITH
Professor of Range Management, Utah State University, and Associate Project Leader, F.A., Utah State Depart- ment of Fish and Game, Logan, Utah
Winter is a critical period for
game animals in temperate cli-
mates. During this season food
supplies are at or near their min-
imum; cold and inclement
weather puts stresses on the bod-
ily functions of animals and, at
the same time, hampers the ani-
mals in their attempts to secure
forage. Population levels are
therefore, frequently, if not in-
variably, determined by the con-
dition of the game habitat used
during the winter months. Be-
cause of these facts, knowledge
of the value of species utilized
for food during winter months is
of extreme importance to the
game manager. Throughout the
West, but especially in those por-
tions where snowfall restricts the
available range for big-game ani-
mals, winter food supplies are of
especial concern. These consider-
ations led to studies directed
toward an evaluation of native
browse plants as sources of for-
age during the winter months.
Digestion tests conducted pre-
viously provided valuable inf or-
mation regarding the nutritive
content of individual
plants
(Smith, 1950b, 1952, and 1957).
During these studies it was noted
that oftentimes the amount of
forage consumed was low for cer-
tain species. Sagebrush
(Arte-miss tridentata)
and juniper
(Juniperus osteosperma)
partic-
ularly come in this category.
Even though a plant has a high
level of nutrients, if, for some
reason or other, it is not eaten
in sufficient quantity, it cannot
adequately support an animal. It
was, therefore, deemed advisable
to conduct feeding tests in which
the response of the animal to
specified diets could be observed.
In Utah three species of plants
are most important in the over-
wintering of deer, sagebrush,
juniper, and scrub oak
(Quercusgambelii).
Other plants are more
attractive to deer than are these
three, but because of natural
abundance and the fact that the
more desired plants have under-
gone reductions on most areas
over the years of heavy use, the
three species listed probably pro-
vide the bulk of the forage for
deer on Utah ranges during the
winter months. Of the three, oak
is less widely distributed, but is
often more abundant than either
of the other two. In other areas
sagebrush is the most important
single plant; and in still others,
juniper provides the major part
of the forage.
Procedures
These facts suggested the plan
of study in which these three
species would be tested alone
and in combinations. For com-
parison, a diet which included
these three species in addition to
other more palatable browse
plants was included. Because of
the great amount of work in-
volved in hauling feed and mak-
ing accurate records, the study
was conducted during three win-
ters, 1954-55, 1955-56, and 1956-57.
Tests were begun toward the end
of December or early January
with the onset of cold weather.
Whenever a test was discon-
tinued, other animals and diets
were started as pens were va-
cated. Most tests were termi-
nated before the middle of
8
March. Unless the condition of
the animals indicated that fur-
ther testing would be unwise,
tests were discontinued after 60
or 70 days. This period was
judged to be the limit of the se-
vere winter period except in ex-
treme years. By early March,
slopes become bare of snow and
opportunity is afforded to sup-
plement the straight browse diet
with other plant materials, and
tests of longer duration than this
were judged to be unnaturally
long. The animals were weighed
each week as a guide in judging
the duration of the tests.
The deer were held captive in
individual pens near Logan,
Utah, and fed prescribed diets.
Browse material was cut from
the adjacent winter range. The
cut material was weighed daily
after the browsed material from
the previous day’s feeding had
been removed. The differences
in the initial and final weights
of the browse material was cor-
rected to correspond with ob-
served changes in weights of
bundles of browse handled iden-
tically to the material provided
the animals except that it was
not within reach of the deer.
The loss in weight attributed to
deer consumption was corrected
to air-dry weight by means of
sample materials hand-clipped
from the check bundles
and
dried. Sheds were available to
provide protection to the ma-
terials and minimize errors due
to snow accumulation on the
forage.
Animals being
fed on re-
stricted diets were given small
amounts of other species once
each week. This was done in
the belief that feeding but one
plant was unnatural, for even on
deteriorated ranges
a small
amount of better browse forage
is usually available.
.
BROWSE IN OVERWINTERING OF DEER 9
FIGURE 1. Oak brush bundled and anchored to racks in feeding shed.
simulate browsing. These clipped bundles were reweighed and the same calculations made as in the case of the materials fed to the deer. The computed removal was then compared to the actual weight of material removed by clipping.
Resulfs and Discussion
Comparison of the hand- clipped materials with the com- puted removal indicate an ac- ceptable degree of accuracy in the feeding method. Although occasionally there were substan- tial differences between the ac- tual and calculated figures due to breakage of the plants or loss of material from a bundle in han- dling, the mean differences were not great. The calculated amounts differed from the actual by +2.6 percent, -1.5 percent,
+0.5 percent, and +0.03 percent in the case of sagebrush, juniper, curlleaf mahogany (Cercocarpus ledifolius), and oak respectively. The pertinent data regarding the animals used and the dura- tion of the tests are given in Table 1. An attempt was made to balance the several feeding tests by including animals of the dif- ferent ages and sex classes in all diets. This was not precisely pos- sible because of inadequate num-
bers of animals within each of these classes. However, this ob- jective was approximately at- tained.
It will be noted that the ju- venile animals could be held on the restricted diets a shorter pe- riod of time than could older ani- mals. Exceptions to this oc- curred in the case of animal
1143 fed upon oak in 1954-55, and the two juveniles fed oak in com- bination with other forages in
1956-5’7, A418 and A405. How- ever, because the duration of the tests was arbitrarily limited, these instances may not invali- date the conclusion that juven- iles are less able to survive diets of restricted species composition even when the amount of feed available is not limited. It is possible that, had all tests been continued indefinitely, there may have been further confirmation of the inability of young animals to survive as well as older ones on these particular diets.
Only one animal was lost dur- ing the course of the studies. A juvenile fed upon oak died with- in 24 hours of being removed from the test after 41 days. It did not appear to have been in more serious condition than did other animals being fed other diets at the time of their removal. In
several instances animals were noticeably weakened at the close of the tests. The dead animal was examined by members of the veterinary department staff. The cause of death was not de- termined.
The shortest mean -duration of the tests was recorded with sage- brush. Since the termination of the tests was based upon subjec- tive criteria such as the general appearance of the animal and weight lost, no great precision could be attained, and too great significance cannot be attached to the small differences in the duration of the tests of sagebrush and juniper. Except for animal 1149, animals were able to sub- sist on oak alone as long as those on a varied diet.
The weights of the animals are shown in Table 1. Percentage losses as small as 2 percent and as large as 24 percent were re- corded. The greatest average weight loss was observed in ani- mals on sagebrush, although the superiority indicated for juniper on this score is very slight. Based upon the results secured herein, oak produced smaller weight losses than did either juniper or sagebrush. This is of particular interest in view of the low nutri- ent level found for this species in digestion trials (Smith, 1957).
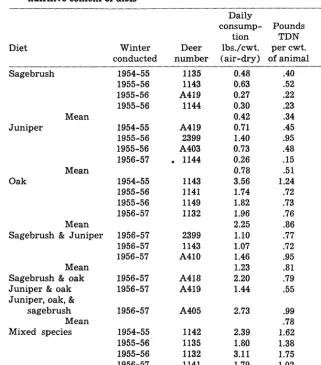
Amounti Consumed
The ability of oak to support animals for appreciable periods in spite of low nutrient value is perhaps partially explained by the amounts ingested. It will be observed that the level of intake of oak is high, all animals con- suming nearly two pounds per hundredweight (Table 2). By contrast, those fed sagebrush and juniper c on sum e d considerably less than one-pound per hundred- weight on the average.
The animals fed on varied diets ate two and a quarter pounds per hundredweight. This figure is somewhat less than the average intake reported for two male
.
10 ARTHUR D. SMITH
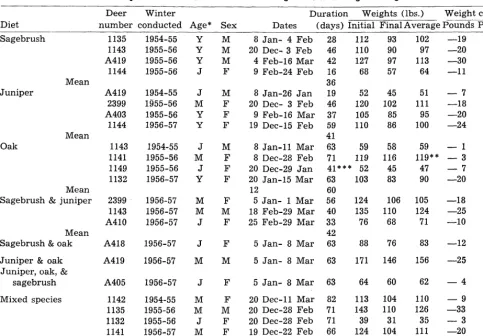
Table 1. Summary of deer used, duration of feeding tests, and weight changes of animals.
Diet
Deer Winter Duration Weights (lbs.) Weight change
number conducted Age* Sex Dates (days) Initial Final Average Pounds Percent
Sagebrush 1135 1954-55 Y M 8 Jan- 4 Feb
1143 1955-56 Y M 20 Dee- 3 Feb
A419 1955-56 Y M 4 Feb-16 Mar
1144 1955-56 J F 9 Feb-24 Feb
28 112 93 102 -19 -17
46 110 90 97 -20 -18
42 127 97 113 -30 -24
16 68 57 64 -11 -16
36 -19
19 52 45 51 - 7 -13
46 120 102 111 -18 -15
37 105 85 95 -20 -19
59 110 86 100 -24 -22
41 -17
63 59 58 59 - 1 - 2
71 119 116 119** - 3 - 3
41*** 52 45 47 - 7 -13
Mean
Juniper A419 1954-55 J M 8 Jan-26 Jan
2399 1955-56 M F 20 Dee- 3 Feb
A403 1955-56 Y F 9 Feb-16 Mar
1144 1956-57 Y F 19 Dee-15 Feb
Oak
Mean
1143 1954-55 J M
1141 1955-56 M F
1149 1955-56 J F
1132 1956-57 Y F
8 Jan-11 Mar 8 Dee-28 Feb 20 Dee-29 Jan 20 Jan-15 Mar
12
5 Jan- 1 Mar 18 Feb-29 Mar 25 Feb-29 Mar
63 60 56 40 33 42 63
103 83 90 -20 -19
-9
-15 h
-19 -13 -16 -14 Mean
Sagebrush & juniper 124 106 105 -18
135 110 124 -25
76 68 71 -10
2399 1956-57 M F
1143 1956-57 M M
A410 1956-57 J F
Mean Sagebrush & oak
Juniper & oak Juniper, oak, &
sagebrush
Mixed species
A418 1956-57 J F 5 Jan- 8 Mar 88 76 83 -12
A419 1956-57 M M 5 Jan- 8 Mar 63 171 146 156 -25 -15
A405 1956-57 J F 5 Jan- 8 Mar 63 64 60 62 -4 -6
1142 1954-55 M F 20 Dee-11 Mar
1135 1955-56 M M 20 Dee-28 Feb
1132 1955-56 J F 20 Dee-28 Feb
1141 1956-57 M F 19 Dee-22 Feb
82 71 71 66 70
113 104 110 -9
143 110 126 -33
39 31 35 -3
124 104 111 -20
-8 -23 -8 -16 -14 Mean
*M = mature (over 2 years) ; Y = l-2 years; J = under 1 year.
***Means are the averages of weekly weights. This animal increased in weight each week for four weeks. ***This animal died within 24 hours of completion of tast.
tions. Of these, four ate larger quantities of sagebrush, and four ate more of juniper, thus veri- fying the approximate equality of these two species from a pref- erence standpoint.
earlier (Smith, 1950a) which was 2.65 pounds per hundred- weight. It is, moreover, less than the intake recorded for the ani- mals being tested in 1954-55. In that winter all animals were fed a varied diet for a period of 18 days prior to the outset of the regular test diets. This was done to familiarize the student help with the technique and provide an opportunity for the animals to become accustomed to the spe- cies to be used. The average for- age intake for four animals dur- ing this familiarization period was 2.7 pounds per hundred- weight of animal, varying from 2.1 to 3.4. In other years animals
were supplied browse materials
prior to the tests, but no records were kept of the amounts con- sumed.
The low intake of juniper and
sagebrush is of particular inter- est. The latter one especially has been found to be high in nutri- ents (Smith, 1950 and 1957). Moreover, it is held in high re- gard by many as a source of for- age for deer. In previous tests, sagebrush appeared to be some- what more palatable than did Utah juniper (Smith, 1950a; Smith and Hubbard, 1954). The data secured in the present feed- ing trials verify the approximate equality in palatability of these species, but tend to indicate slight superiority of juniper as a sustaining diet. This indication is contrary to conclusions drawn earlier from field observations.
Exclusive of those animals fed these two species alone or to- gether, eight animals had access to sagebrush and juniper regu- larly as part of their daily ra-
While these tests were being performed, it was noted that cer- tain animals on a varied diet in- cluding the three major species as well as curlleaf mahogany, bitterbush (Purshia trident&a), chokecherry (Prunus virginiana
var.melanocarpa), birchleaf ma- hogany (Cercocarpus mon-
tanus), and cliffrose (Cowania
stansburiana) ate fairly substan-
BROWSE IN OVERWINTERING OF DEER
11brush (0.31 pounds per hundred-
weight) than did two animals fed
sagebrush alone. Furthermore,
reference to Table 2 will show
that when sagebrush and juniper
were fed together, the average
daily intake was almost identi-
cally the same as the sum of the
average intakes of the two spe-
cies when fed separately.
A similar situation exists in
the case of juniper. In one in-
stance the average intake per
hundredweight of the species
taken in combination with other
forages compared favorably with
consumption of juniper alone.
Animal 1135, for example, while
on a varied diet consumed 0.40
pounds of juniper per hundred-
weight daily.
These data suggest the possi-
bility that deer may have some
limit for consumption of these
species which is little affected by
the other forage available. This
point of view is given further
weight by some observations of
other deer which during 1956-57
were not being used in the feed-
ing tests. These animals were
being fed commercial livestock
pellets and alfalfa hay as well as
such browse material as was not
consumed by the experimental
animals. Invariably these ani-
mals left their hay and pellets
to eat browse when it was placed
in the pens, some animals pre-
ferring sagebrush to the artifi-
cial feeds. The same response
was noted with juniper, but it
was less pronounced.
It is interesting to note that
although the amount of oak con-
sumed was much greater than
was the case either with juniper
or sagebrush when fed alone,
when these three were fed along
with better forage plants this su-
periority is not evident. Thus,
animal 1142 ate a relatively large
amount of sagebrush, 457 grams
daily, and but small amounts of
either oak or juniper. Another,
number 1135, consumed
225
grams daily of juniper and small
amounts of oak and sagebrush.
The other two animals on the
Table 2. Daily forage consumpiion nutritive content of diets by
during course of feds and
Diet
Daily
consump- Pounds tion TDN Winter Deer lbs./cwt. per cwt.
conducted number (air-dry) of animal Ratio
Sagebrush 1954-55 1135
1955-56 1143
1955-56 A419
1955-56 1144
Juniper
Oak
Mean
Mean Sagebrush & Juniper
Mean Sagebrush & oak Juniper & oak Juniper, oak, &
sagebrush Mean Mixed species
Mean
1954-55 A419 1955-56 2399 1955-56 A403 1956-57 . 1144
1954-55 1143 1955-56 1141 1955-56 1149 1956-57 1132
1956-57 2399 1956-57 1143 1956-57 A410
1956-57 A418 1956-57 A419
0.48 .40 0.63 .52 0.27 .22 0.30 .23
0.42 .34 .24
0.71 .45 1.40 .95 0.73 .48 0.26 .15
0.78 -51 .35
3.56 1.24 1.74 .72 1.82 .73 1.96 .76
2.25 .86 .60
1.10 .77 1.07 .72 1.46 .95
1.23 .81 .56
2.20 .79 1.44 .55
1956-57 A405 2.73
1954-55 1142 1955-56 1135 1955-56 1132 1956-57 1141
2.39 1.80 3.11 1.79 2.25 .99
.78 .54 1.62
1.38 1.75 1.02
1.00
varied diet ate more oak than
either of the other species, but
the amounts consumed
were
small and the differences not
marked. These data further sug-
gest that not preference, but a
differential in the tolerance of
deer for these three species, ac-
counts for the difference in con-
sumption when these species are
fed alone.
Both sagebrush and juniper
are known to exhibit great in-
dividual differences in palatabil-
ity, for animals eat of some
plants of either species but avoid
others. In juniper, and presum-
ably in sagebrush, this varied
palatability appears to be related
to the essential oil content of the
individual plants (Smith, 195Oc)
.In the case of juniper the evi-
dence of selective foraging is ob-
vious in the high-lined effect that
is produced
on the selected
plants, but this is not true with
sagebrush. This factor may be
expected to influence the results
secured when these two species
are compared under the condi-
tions of this experiment, for it is
not possible to be certain of sup-
plying representative material
of these variable species.
12
ARTHUR D. SMITH
FIGURE 2. Yearling doe being fed juniper and showing signs of poor nutrition, 1956-57.
riods during which these con-
sumption figures were noted
were short, however. The possi-
bility thus exists of selecting su-
perior strains of these two spe-
cies if we could learn to identify
them in the field. This possibility
takes on added significance as re-
vegetation programs are under-
taken on deteriorated ranges.
Nutritive
Infake
Forage intake figures show a
wide variation between the dif-
ferent diets. It is known, how-
ever, that wide differences exist
between the digestible nutrients
of the species used (Smith, 1957).
Accordingly, the amounts of di-
gestible nutrients actually con-
sumed were calculated for the
various diets (Table 2).
Sagebrush, for example, has a
high level of TDN. On the basis
of nutrient content, its value
with reference to the other diets
is improved somewhat. It pro-
duces about 40 percent of the to-
tal nutrients provided by oak, al-
though the mean level of con-
sumption between the two spe-
cies differs by almost six times.
Neither sagebrush nor juniper
provided a great amount of nu-
trients, but together they ap-
proached the level of nutrient in-
take of oak.
Because it was not possible to
provide a balance of age classes
of animals in sufficient numbers
to provide adequate basis for de-
termining mean values for these
age classes, it is difficult to com-
pare these nutrient levels with
those recommended for domestic
animals. Comparison of the data
secured with those recommended
for sheep (Pope, A. L. et al.,
1957) indicates that only two ani-
mals secured adequate nutrients.
These were deer 1142 and 1135,
mature animals fed on a varied
diet. The other mature animal
on this diet secured but 1.02 TDN
per hundredweight of animal
which is about 20 percent less
than that required for a ewe of
comparable weight. The fourth
animal which secured more than
one pound of nutrient per hun-
dredweight was a juvenile fed
oak, number 1143. Based upon
the recommended amounts for
lambs of comparable size, even
the 1.24 pounds daily intake by
this animal is only about half
enough. Yet two of the animals
fed oak lost but little weight
(Table 1), in spite of the appar-
ent inadequacy of the diets.
The findings suggest the im-
propriety of attempting final
evaluations of range plants from
the standpoint of content alone.
Chemical analyses frequently
have been used to rate forage
plants. Without doubt consider-
able error is inherent in such a
procedure. In the first place,
gross anaylses do not at all in-
dicate the availability of the
various chemical fractions to
the animals. Moreover, as is
shown in the data herein re-
ported, even nutrient values pro-
vide incomplete pictures of the
place of an individual species in
support of a range or game ani-
mal.
Although sagebrush and juni-
per contribute heavily to the sup-
port of deer herds, neither ap-
pears to be satisfactory when it
constitutes the sole item in the
diet. Each would appear to be
most valuable when other for-
age species are available to be
taken in conjunction with them.
Approximately one-fourth of the
nutrient intake of the animals
fed on a varied diet was supplied
by sagebrush and juniper. Nearly
one-sixth of the nutrients came
from sagebrush alone. As better
forage plants become limited it
seems probable that these species
can assume an even greater im-
portance without ill effects to
the animals.
Summary
During three winters mule
deer were fed on prescribed diets
of browse species common to
Utah ranges. From the stand-
points of distribution and abun-
dance, sagebrush, juniper, and
oak are the most important, al-
though not the most preferred,
browse species. These three spe-
cies were fed singly and in com-
bination. They were also in-
cluded in diets which included
all the more preferred browse
forages.
BROWSE IN OVERWINTERING OF DEER 13 fed together, the mean level of
consumption of these two spe- cies was equal to the sum of the amounts consumed when they were fed singly. No entirely satisfactory explanation can be found for the lower consumption of sagebrush and juniper in these as compared to earlier data.
Oak was eaten in quantity whether fed alone or together with sagebrush or juniper. How- ever, it was not eaten well in comparison with the more pre- ferred species making up the varied diets Some animals on varied diets ate more sagebrush or juniper than they did oak.
The duration of feeding trials wds least for sagebrush, second for juniper, and third for sage- brbsh and juniper together.
None of the diets appeared to be adequate in digestible nutri-
ents when compared to recom- mended allowances for domestic sheep. It may be improper, how- ever, to expect to attain the lev- els of nutrition desired for do- mestic animals with game ani- mals in the wild.
Neither chemical content nor digestible nutrients is an ade- quate measure of a plant’s value as forage. Only when the reac- tion of an animal toward the plant is observed in comparison to other forages can its impor- tance be assessed. Plants may have high value in a mixed diet, but may be inadequate as the sole source of forage.
LITERATURE CITED
POPE, A. L. et al. 1957 Nutrient re- quirements of sheep. Publication 504. National Academy of Sci-
ence-National Research Council, Washington, D. C.
SMITH, ARTHUR D. 1950a. Feeding deer on browse species during winter. Jour. Range Mangt. 3:130- 132.
. 1950 b. Sagebrush as a winter feed for deer. Jour. Wildlife Mangt. 14: 285-289.
. 195Oc. Inquiries into differential consumption of juniper by mule deer. Fish and Game Bul. 9(5)4.
. 1952. Digestibility of some native forages for mule deer. Jour. Wildlife Mangt. 16: 309-312.
. 1957. Nutritive value of some browse plants in winter. Jour. Range Mangt. 10:162-164.
AND RICHARD L. HUB- BARD. 1954. Preference ratings for winter deer forages from northern Utah ranges based on browsing time and forage consumed. Jour. Range Mangt. 7: 262-265.
Snow Management Research in
High Sierra Range’
RAYMOND M. RICE
Forest Hydrology Project Leader, California Fwcsc ana Range Experiment Station, Forest Service, U. S. Depart- ment of Agriculture, Berkeley, California
Californians have become in- creasingly aware of the impor- tance of the water needed for ag- riculture and the industries of their state. They have prepared a thorough, forward looking plan
(Calif., 1957) to develop and transport water to the far reaches of the state. Included in the plan is the intensive manage- ment of California’s mountain watersheds. The State of Cali- fornia, Department of Water Re- sources, and the U. S. Forest Service, California Forest and Range Experiment Station, have joined hands in a program to
IPaper presented at the December 1957 meeting of the California Sec- tion, American Society of Range Management.
conduct research into methods of improving water yield from the snow zone of the state. The pro- gram is called the California Co- operative Snow Management Re- search (Anderson, 1956).
Management of the snow zone for water production may signi- ficantly influence the available summer range and hence range management in the Sierras and Cascades.
The present emphasis on snow zone research results from the importance of this zone to the water yield of the state. Accord- ing to Colman (1956)) 95 percent of California’s water comes from the forested and brush covered lands-42 percent of the State’s area:
1. Forty-four percent of the State’s water comes from the commercial forests be- low the snow pack and the foothill brushlands.
2. Thirty-eight percent comes from the commercial forests within the snow zone. 3. Thirteen percent comes
from the alpine part of the snow zone above the com- mercial timber belt.
The snow zone occupies only 12 percent of the land area yet yields 51 percent of the State’s water. This high yield and the fact that it produces water later in the year than the other zones makes the snow zone the most valuable and most important water producing area in the State.
The snow research program aims to develop ways of manag- ing land for improved water pro- duction. Improvement can take the form of:
1. Increasing the total stream- flow.
BROWSE IN OVERWINTERING OF DEER 13 fed together, the mean level of
consumption of these two spe- cies was equal to the sum of the amounts consumed when they were fed singly. No entirely satisfactory explanation can be found for the lower consumption of sagebrush and juniper in these as compared to earlier data.
Oak was eaten in quantity whether fed alone or together with sagebrush or juniper. How- ever, it was not eaten well in comparison with the more pre- ferred species making up the varied diets Some animals on varied diets ate more sagebrush or juniper than they did oak.
The duration of feeding trials wds least for sagebrush, second for juniper, and third for sage- brbsh and juniper together.
None of the diets appeared to be adequate in digestible nutri-
ents when compared to recom- mended allowances for domestic sheep. It may be improper, how- ever, to expect to attain the lev- els of nutrition desired for do- mestic animals with game ani- mals in the wild.
Neither chemical content nor digestible nutrients is an ade- quate measure of a plant’s value as forage. Only when the reac- tion of an animal toward the plant is observed in comparison to other forages can its impor- tance be assessed. Plants may have high value in a mixed diet, but may be inadequate as the sole source of forage.
LITERATURE CITED
POPE, A. L. et al. 1957 Nutrient re- quirements of sheep. Publication 504. National Academy of Sci-
ence-National Research Council, Washington, D. C.
SMITH, ARTHUR D. 1950a. Feeding deer on browse species during winter. Jour. Range Mangt. 3:130- 132.
. 1950 b. Sagebrush as a winter feed for deer. Jour. Wildlife Mangt. 14: 285-289.
. 195Oc. Inquiries into differential consumption of juniper by mule deer. Fish and Game Bul. 9(5)4.
. 1952. Digestibility of some native forages for mule deer. Jour. Wildlife Mangt. 16: 309-312.
. 1957. Nutritive value of some browse plants in winter. Jour. Range Mangt. 10:162-164.
AND RICHARD L. HUB- BARD. 1954. Preference ratings for winter deer forages from northern Utah ranges based on browsing time and forage consumed. Jour. Range Mangt. 7: 262-265.
Snow Management Research in
High Sierra Range’
RAYMOND M. RICE
Forest Hydrology Project Leader, California Fwcsc ana Range Experiment Station, Forest Service, U. S. Depart- ment of Agriculture, Berkeley, California
Californians have become in- creasingly aware of the impor- tance of the water needed for ag- riculture and the industries of their state. They have prepared a thorough, forward looking plan
(Calif., 1957) to develop and transport water to the far reaches of the state. Included in the plan is the intensive manage- ment of California’s mountain watersheds. The State of Cali- fornia, Department of Water Re- sources, and the U. S. Forest Service, California Forest and Range Experiment Station, have joined hands in a program to
1Papcr presented at the December 1957 meeting of the California Sec- tion, American Society of Range Management.
conduct research into methods of improving water yield from the snow zone of the state. The pro- gram is called the California Co- operative Snow Management Re- search (Anderson, 1956).
Management of the snow zone for water production may signi- ficantly influence the available summer range and hence range management in the Sierras and Cascades.
The present emphasis on snow zone research results from the importance of this zone to the water yield of the state. Accord- ing to Colman (1956)) 95 percent of California’s water comes from the forested and brush covered lands-42 percent of the State’s area:
1. Forty-four percent of the State’s water comes from the commercial forests be- low the snow pack and the foothill brushlands.
2. Thirty-eight percent comes from the commercial forests within the snow zone. 3. Thirteen percent comes
from the alpine part of the snow zone above the com- mercial timber belt.
The snow zone occupies only 12 percent of the land area yet yields 51 percent of the State’s water. This high yield and the fact that it produces water later in the year than the other zones makes the snow zone the most valuable and most important water producing area in the State.
The snow research program aims to develop ways of manag- ing land for improved water pro- duction. Improvement can take the form of:
1. Increasing the total stream- flow.