Microfluidic & microrheological studies of protein
interactions at the single–molecule & single–cell level
Marcus Otten
Microfluidic & microrheological studies of protein
interactions at the single–molecule & single–cell level
Marcus Otten
Dissertation
an der Fakultät für Physik
der Ludwig-Maximilians-Universität
München
vorgelegt von
Marcus Otten
aus Starnberg
Zusammenfassung
Das Bestreben, biologisches Leben auf der molekularen Nano-Skala zu verstehen, hat das breite Feld der Nanobiowissenschaften hervorgebracht. Die Physik unterstützt dieses Vorhaben durch die quantitative Beschreibung von Gesetzmäßigkeiten, denen diese Moleküle und ihre Wechselwirkungen unterliegen. Besonders in der molekularen und zellulären Biophysik hat sich der Schwerpunkt von einem rein geno-mischen Verständnis des Lebens hin zu dynageno-mischen Prozessen und funktionalen Wechselwirkungen in Zellen und Geweben verschoben.Proteinenehmen an verschiedensten Aufgaben des zellulären Lebens, wie Genregulation, metabolischen Enzymreaktionen oder Zellmechanik des Zytoskeletts, teil. Sie sind daher von besonderem Interesse für das Verständnis der dynamischen Prozesse. In jeder dieser Aufga-ben wechselwirken sie mit anderen Biomolekülen, sei es mit DNA in transkriptioneller Genregulation, mit anderen Proteinen in enzymatischen Reaktionen, oder als Teil von makromolekularen Komplexen wie dem Zytoskelett. Diese Wechselwirkungen und die sie beherrschenden Kräfte sind eng mit der bio-logischen Funktion gekoppelt.
Zur Untersuchung dieser Wechselwirkungen, sogar auf Einzelmolekül- oder Einzelzell-Ebene, wur-den eine Vielzahl von Methowur-den entwickelt. Zudem bilwur-den „Lab-on-a-Chip“-Systeme das biochemi-sche Pendant zu der aus der Mikroelektronik und digitalen Revolution bekannten Miniaturisierung und Parallelisierung. Nichtsdestotrotz wurden diese beiden Gebiete, Einzelmolekül-Mechanik und Lab-on-a-chip-Systeme, bisher nicht verknüpft.
Abstract
The endeavor to understand biological life at the molecular nano-scale has given rise to the wide inter-disciplinary field of nanobiosciences. The physical sciences contribute to this venture by quantitative description of laws concerning the involved constituents and their interactions. In particular, in molecu-lar and cellumolecu-lar biophysics, focus has shifted from a purely genomic view of life to dynamic processes and functional interactions in cells and tissues.Proteinsare the workhorses of cellular life and involved in tasks as diverse as gene regulation, enzymatic reactions of the metabolism or cytoskeletal cell me-chanics. They are thus of special interest to understanding these dynamics. In each of these tasks, they interact with a variety of biomolecules, be it with DNA in transcriptional gene regulation, with other pro-teins in enzymatic reactions, or as part of macromolecular assemblies such as the cytoskeleton. These interactions and their governing forces have been found to be closely related to biological function.
A range of methods have been developed to study these types of interactions, even at the single–molecule or single–cell level. At the same time, the miniaturization and parallelization known from microelec-tronics and the digital revolution, have found their counterpart in biochemical laboratory techniques in the form of microfluidic lab–on–a–chip technologies. Nevertheless, these two fields of single-molecule mechanics and lab–on–a–chip parallelization have so far resisted conjunction.
Contents
1 Introduction 1
2 Scientific context 5
2.1 Molecular interactions . . . 5 2.2 Force spectroscopy and force assays . . . 9 2.3 Microfluidic lab–on–a–chip technologies . . . 13
3 Microfluidic protein micro–arraying for single–molecule force spectroscopy 19 3.1 Summary of associated manuscript M1 . . . 19 3.2 Associated manuscript M1 . . . 21
4 A microfluidic chip to probe protein–DNA interaction forces 35
4.1 Summary of associated publication P1 . . . 35 4.2 Associated publication P1 . . . 37
5 Actin–Microtubule interaction effects on intracellular subdiffusion 47
5.1 Summary of associated publication P2 . . . 47 5.2 Associated publication P2 . . . 49
6 Conclusion and Outlook 61
A Appendix 67
A.1 Technical information . . . 67 A.2 Supplementary information to associated manuscript M1 . . . 74 A.3 Supplementary information to associated publication P1 . . . 86
Bibliography 94
1 Introduction
A growing body of interdisciplinary research at the intersection between biology, chemistry, and physics is concerned withbiologicallyrelevant questions, involving the building blocks of the animate world, ranging from single DNA or protein molecules to cells and further to organisms. The answers to these questions have been found to require knowledge about phenomena at the nano-scale. In this area of nanobioscience, fundamental research has considerably gained ground, notably with the ability to create and manipulate artificial objects at the nanoscale [1,2], to read and decipher biological information [3,4], and to apply these insights for diagnostic and therapeutic purposes [5, 6].
Considerable as these advances, e.g. in genomics, might be, it has also become clear that interest is increasingly shifting towardsinteractionsbetween molecular constituents, rather than the static infor-mation encoded in genes1.Thus, the study of interactomes [7] or gene regulatory networks [8] are con-stantly gaining attention. In both cases, proteins play a central role, as do their interactions with other proteins in the former case and with DNA sequences in the latter case. Furthermore, the interactions of proteins as part of macromolecular assemblies are essential to understanding cell behavior. The study of entire networks of interaction partners – interactomes or gene regulatory networks – intrinsically re-quires large amounts of data, for not only thenodesof the networks but also their connectingedgesare probed. When interactions are studied, the governing forces are of particular interest from a physicist’s perspective. On the single protein scale, force is closely related to function, exemplarily demonstrated in the case of mechanically activated enzymes [9]. In analogy, in single cells macromolecular structures such as the cytoskeleton are closely related to force generation, transmission, and sensing [10].
At the same time, lab–on–a–chip technologies have immensely contributed to the parallelization, minia-turization and comparability of scientific methods [11], in particular in the nanobiosciences. Microflu-idic technology and large–scale integration are prominent examples of lab–on–a–chip implementations. They have helped to further develop existing protocols and enabled the invention of new methods. Thus, they are perfectly suited for the study of these data–intensive networks. Nevertheless, the most widespread lab–on–a–chip methods still rely on ensemble averaging for ease of use. Recent advances in non-averaging single–molecule techniques have for the most part resisted integration into high– throughput methods. Singular examples of high–throughput single–molecule experiments are primarily found in the field of sequencing technologies [3, 4] and demonstrate the disruptive effect of combining single–molecule methods with high throughput: Previous sequencing technologies have been virtually outpaced.
The scientific scope of this thesis thus lies at the intersection of interaction studies of single proteins as part of larger networks and their potential integration into parallelized experimental approaches for higher throughput and facilitated comparability. More specifically, it addresses questions concerning the miniaturization and parallelization of single–molecule or single–cell studies of protein interactions.
1Genomes are not static on an evolutionary time-scale. Furthermore, epigenetic effects do introduce changes over the course
Figure 1:Lab–on–a–chiptechnologies and microfluidic devices have advanced miniaturization and paralleliza-tion in nanobioscience laboratory techniques. Shown here is an artistic rendering of the microfluidic chip used in the context of this thesis. Image by C. Hohmann, Nanoinitiative Munich (NIM).
2 Scientific context
To foster understanding of what governs life at the micro– and nano–scale, the study of life’s “elemen-tary particles“, the biomolecules, has long been at the center of fundamental life–science research. A physicist’s perspective on “elementary particles“cannot be complete without a profound understanding of the interactions and forces governing their interplay. Therefore, the methods to study these biomolec-ular interactions and the knowledge about them have evolved rapidly over the past decade.
To illustrate the scientific context of the work presented in this thesis, this chapter serves a three–fold purpose: First, an overview of the different types of molecular interactions of interest in this thesis is given: interactions of proteins with other proteins, with DNA, or as part of a macromolecular assembly. Second, the previous method development work is sketched. Three methods related to interaction force measurements, which are used and further developed in this thesis are the core interest of this section. And third, the relatively new field of microfluidics and lab–on–a–chip is introduced. Some examples of how it transformed existing methods or enabled new methods are given, with an exclusive focus on nanobiotechnology.
2.1 Molecular interactions
2.1.1 Protein–protein interactions
Proteins are the functional workhorses of living cells, carrying out tasks ranging from enzymatic re-actions in metabolism to stimulus response. In most of these tasks, they interact with other proteins. Especially palpable is the case for enzymatically active proteins. More often than not, distortion of the protein–protein interaction interface or misfolding are disease–related [12,13]. As a result, the pair–wise interactions of proteins are at the core of current efforts of protein engineering and drug design.
Two hypotheses for the pair-wise interaction of proteins were formulated on the basis of data from X-ray crystallography and refined by nuclear magnetic resonance (NMR) [14] and molecular dynamics (MD) simulations [15]. These hypotheses are named induced fit and conformational selection [16]: The induced fit involves a stepwise conformational change upon binding. Conformational selection, on the other hand, presumes a dynamic equilibrium of multiple configurations, one of which is selectively favored by the binding partner and consequently more frequently populated upon binding. Both models rely on a free energy landscape, which explains folding of binding partners into a functional state, and on the presence of hot spots, which are interface regions with high structural conservation, high density and a particular amino acid composition [17].
melanogaster[7]. The acquired amount of data is impressive 1 and can only be handled by computa-tionalin silicomethods and graph theory [20]. Nevertheless, the knowledge about these system–level networks is biased: statistical bias favors a few cellular environments due to experimental constraints. Furthermore, highly expressed or more ancient, conserved proteins are overrepresented [20].
Contrary to simple identification of binding partners in high–throughput, some methods have contributed to relate force and function for single protein pairs [21], which is particularly interesting in the case of enzymes. The quantitative characterization includes information about the energy landscape, such as potential widths and dissociation rates.
Model system: Cohesin–Dockerin interaction
Figure 2 introduces a particularly intriguing class of enzymes, presented in the context of this thesis and involved in biomass degradation by multimodular protein assemblies, the cellulosomes [22]. These assemblies are directed by a strong and high–affinity protein–protein interaction between dockerin and cohesin. Their affinity is characterized by a dissociation constant in the pM range and driven by a double 22-residue calcium binding loop–helix F–hand motif, forming the dockerin interface [23]. Cellulolytic enzymes each bear a dockerin module and can thus modularly bind to the scaffoldin on the cell wall presenting multiple cohesin modules.
of cohesins and dockerins represents a step forward in cellulosome
research and suggests signi
fi
cant future opportunities for
eluci-dating the structural and functional properties of these re
fi
ned
molecular systems.
Results
Cohesin and Dockerin Fusion Constructs.
The dockerin under
in-vestigation comprised the WT Cel48S dockerin module from
C.
thermocellum.
This protein was expressed in
Escherichia coli
as a
C-terminal fusion to the xylanase T6 enzyme from
Geobacillus
stearothermophilus
to increase stability and expression levels as
described previously (5). The xylanase T6 enzyme was modi
fi
ed
with an internal T129C mutation to introduce a cysteine residue at
a position spatially removed from the C-terminally fused dockerin.
This cysteine was used in conjunction with maleimide chemistry to
site-speci
fi
cally immobilize the protein on the AFM cantilever or
sample surface, as shown in Fig. 2
A
. The xylanase module crystal
structure showing the position of the internal cysteine residue is
shown in
Fig. S1
A
. The construct is denoted xylanase
–
dockerin,
and a version without the T129C mutation had been produced and
characterized in previous works by our group (4, 6). Protein amino
acid sequences are provided in
Dataset S1
.
The cohesin under investigation comprised the
C. thermocellum
CipA cohesin2 module (Coh2). This protein was expressed in
E.
coli
as an arti
fi
cial C-terminal fusion to the CBM from the CipA
scaffoldin of
C. thermocellum
to facilitate puri
fi
cation via a
cellu-lose af
fi
nity column and to improve expression levels, as described
previously (5). The CBM was modi
fi
ed with an A2C site-speci
fi
c
mutation for surface attachment before force spectroscopy. The
CBM crystal structure is shown in
Fig. S1
B
.
We used the SWISS-MODEL workspace (7) in conjunction
with the crystallized cohesin and dockerin structures (PDB ID
codes 2CCL and 1OHZ) (2, 8) to model the structure of our
cohesin
–
dockerin pair based on structural homology. The results
from this model for dockerin binding mode 1 are shown in Fig.
1
C
. Equilibrated structural models of the cohesin
–
dockerin
complex in each binding mode side-by-side for comparison are
found in
Fig. S2
.
Unfolding Fingerprints of Fusion Proteins.
Force spectroscopy
inves-tigations were undertaken in which one of the binding partners
was covalently immobilized onto an aminosilanized cantilever and
the other onto a glass surface via NHS-PEG-maleimide spacers at
the engineered cysteine residues. The stability of single-molecule
binding interfaces between the protein constructs was probed by
contacting the surface repeatedly with the cantilever. After each
approach
–
retract cycle, the
x
–
y
piezo stage was actuated, exposing
new surface molecules to the same molecule on the cantilever.
The recorded force
–
distance traces exhibited sawtooth-like peaks
if successful binding of cohesin and dockerin was established. Each
peak in the force
–
distance trace corresponded to the unfolding of
a single protein domain or folded subdomain, whereas the last peak
always corresponded to rupture of the cohesin
–
dockerin binding
interface. Positions along the amino acid chain that resisted the
applied load represented energy barriers to unfolding. The speci
fi
c
positions of these energy barriers could be used as a
fi
ngerprint
to identify the various protein domains of interest. This analysis
method based on contour lengths has been previously used to
identify globular protein domains, interrogate key residues
in-volved in the folding of membrane proteins (9
–
17), and probe the
sequence-dependent stability of nucleic acid hairpins (18, 19).
We probed our binding partners in two different experimental
con
fi
gurations to obtain a complete picture of the reversibility of
domain unfolding and binding interface generation. Fig. 2
A
depicts
the pulling con
fi
guration, which we refer to as pulling con
fi
guration
(
i
), where the more stable CBM
–
cohesin was attached to the
cantilever and probed repeatedly. With each force
–
distance trace,
a new dockerin module was probed by the same cohesin, giving rise
N term.
A
B
C
...DVNDDGKVNSTD AVALKRYVLR SGISINTDNA DLNEDGRVNSTD LGILKRYILK...
Ca2+ Ca2+
Applied force Ca-binding loop 1 Ca-binding loop 2
Helix 1 Helix 2 Helix 3
Dockerin Binding mode 1
Binding mode 2
N term. Dockerin Binding mode 1 L83 D39 Cohesin Enzymatic subunits Anchoring protein Scaffoldin subunit Dockerin Cohesin CBM Bacterial cell
Fig. 1. Schematics of the C. thermocellum cellulo-some. (A) Organization of the CipA scaffoldin of C. thermocellum, with dockerin-containing enzymes and anchoring protein. The enzymatic subunits are orga-nized at high density along the scaffoldin subunit, mediated by high-affinity type I cohesin–dockerin interactions. (B) Primary sequence and secondary structural elements of the dockerin module. Key resi-dues involved in binding modes 1 and 2 are high-lighted in red and green, respectively. (C) Equilibrated structural model of the cohesin–dockerin complex used in this work. The alanine mutation sites D39 and L83 on the cohesin are shown in red.
100 0 100 0 100 0 250 200 150 100 50 0 Single Double Force [pN] Distance [nm] CBM Xyn PEG
B
60% 33% 7% Ratio 3 2 1 4 Doc 0A
PEG Xylanase Dockerin Cohesin CBM PEGFig. 2. Force spectroscopy of the type I cohesin–dockerin interaction. (A) Schematic of the pulling geometry. (B) Typical unfolding patterns of the CBM–cohesin:xylanase–dockerin complex. The first nonlinear rise in force was caused by stretching of the PEG and protein linker regions. Afterward, a series of up to three sudden drops in force with decreasing height was observed, corresponding to xylanase (Xyn) unfolding. Finally, the cohesin– dockerin interface ruptured in a single step (Single), or in a two-step process characterized by an 8-nm contour length increment (Double). In∼7% of the cases, an additional high-force peak was observed consistent with the un-folded length of the cellulose-binding module (CBM). The last peak in all traces was attributed to rupture of the cohesin–dockerin binding interface. A total of 880 force–distance traces were analyzed to arrive at the ratio values shown on the right.
20432 | www.pnas.org/cgi/doi/10.1073/pnas.1211929109 Stahl et al.
Figure 2:Cohesin–Dockerin interaction (A)Dockerin and cohesin proteins establish high–affinity and high– rupture–force binding between enzymatic subunits and a scaffoldin protein of cellulosomes on the outer cell walls of cellulolytic bacteria,e.g. C. thermocellum. (B)The binding interface of dockerin shows a double calcium binding loop–helix F–hand motif (black). Cohesin can bind to this interface in two modes (red and green). (C)Crystal structure of both dockerin (blue) and cohesin (yellow) in binding mode 1. reproduced from Ref. [23]
1Yeast is arguably best studied, with an estimated 50% of interactions identified. Although, the numbers of involved proteins
2.1 Molecular interactions 7
2.1.2 Protein–DNA interactions
Proteins and DNA interact in a variety of contexts in all living systems, including immune response, mismatch repair and gene regulation. The immune system relies on the recognition of pathogenic nucleic acids by dedicated proteins [24]. DNA-damage response proteins are involved in detecting, signaling and repairing endogenous and environmental damage to the genetic material of an organism [25] [26].
Nonetheless, the most prominent example of interaction between proteins and DNA occurs in transcrip-tional gene regulation, when transcription factors bind to genes – typically in close proximity to the pro-moter – in order to activate or repress the RNA polymerase binding and activity [8]. Taking the example of transcription factor binding, it has recently become evident, that different measures must be com-bined to fully understand the underlying mechanisms [27]. These measures include binding force [28], specificity [29, 30], affinity [31], and turnover [32]. Compared to binding and turnover dynamics, mere occupancy levels are not reliable in predicting functional regulation [33].
High-throughput PDI techniques and studies
ChIP-chip/ChIP-seq
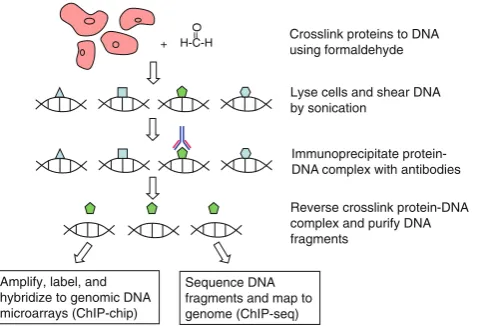
Chromatin immunoprecipitation (ChIP) is a well established method used to characterize PDIs in vivo. A comprehensive review on the recent progress of all the ChIP-based approa-ches can be found in [9]. In brief, ChIP-based approaches include the following steps (Fig.1). First, chemicals such as formaldehyde are applied to cells to covalently crosslink proteins and DNA that are in direct contact. Chromosomal DNA is then fragmented, and specific antibodies are used to immunoprecipitate their target TFs along with any cross-linked DNA fragments. Finally, the bound DNA fragments are analyzed using polymerase chain reaction (ChIP-PCR), for which is it necessary to have some prior knowledge of candidate regions. Alternatively, the genomic regions bound in vivo can be characterized in a comprehensive
and unbiased manner using chromatin immunoprecipitation coupled with either microarray readout (ChIP-chip) [10,11] or high-throughput sequencing (ChIP-seq) [12–14].
Table 2 Summary of high-throughput PDI studies
Study Species TF family Protein length No. of TFs Technology
Noyes [36] Drosophila Homeobox DBD 84 B1H
Hu [41] Human All the major human TFs and uDBPs
Full 1013a Protein microarray
Berger [24] Mouse Homeobox DBD 168 PBM
Badis [27] Mouse Major mouse TFs DBD 104 PBM
Deplancke [34] Worm Worm TFs DBD 112 Y1H
Wei [67] Human and mouse ETS DBD/full 27 PBM and TF DNA-binding
specificity assay
Zhu [26] Yeast Major yeast TFs DBD 89 PBM
Badis [25] Yeast Major yeast TFs DBD 112 PBM
Harbison [15] Yeast Major yeast TFs Full 203b ChIP-chip
PDIProtein-DNA interaction,TFtranscription factor,DBDDNA-binding domains,uDBPunconventional DNA-binding protein a
A total of 4,191 human TFs tested, 1,013 with DNA-binding activity and 437 with generated DNA-binding motifs b
A total of 203 yeast TFs tested, 147 DNA-binding motifs generated and 116 with high confidence
Table 3 Summary of PDI database
Database Species DNA-binding
protein
No. of defined binding motifs (logos)
Cost Approach
TRANSFAC [18] Multiple TFs 1,300 Commercial and
free versions
Multiple
JASPAR [77]a Multiple TFs 457a Free Multiple
UniPROBE [78] Multiple, mainly mouse, worm, yeast
TFs 393 Free PBM
hPDI [55] Human TFs and uDBPs 437 Free Protein microarray
TFTranscription factor,uDBPunconventional DNA-binding protein a Overlapped with UniPROBE
H-C-H
O=
+ Crosslink proteins to DNA using formaldehyde
Lyse cells and shear DNA by sonication
Immunoprecipitate protein-DNA complex with antibodies
Reverse crosslink protein-DNA complex and purify DNA fragments
Amplify, label, and hybridize to genomic DNA microarrays (ChIP-chip)
Sequence DNA fragments and map to genome (ChIP-seq)
Fig. 1 Workflows of ChIP-chip and ChIP-seq
Protein–DNA interactions 1659
123
(a)Chromatin-immunoprecipitation (ChIP)Applications
In the original proof-of-principle study for parallel sequencing-based SELEX, the approach was validated by determining binding specificities of 14 TFs from different gene families [20]. For all the TFs tested, the number of sequences was of the same order of magnitude as the ones using SELEX-SAGE, with lower cost and simpler proce-dure. The results are in good agreement with the previous knowledge of the DNA-binding motifs of these TFs. The DNA-binding preferences of two TFs were also success-fully validated using ChIP-seq.
Protein binding microarray
Protein binding microarray (PBM) analysis allows high-throughput characterization of PDIs by directly probing purified proteins to a double-stranded DNA (dsDNA) microarray (Fig.3). The basic idea is that a given recom-binant TF protein is labeled and then bound directly to the dsDNA microarray. The DNA-binding specificity of that protein can be directly determined by measuring the signal intensity of bound dsDNAs.
In an early proof-of-principle study, Bulyk et al. [21] synthesized and printed short dsDNAs onto a microarray and then probed the microarray with C2H2 zinc finger DNA-binding domain of Egr1. They found that spots with higher signal intensities contained higher affinity binding sites, which suggested that the dsDNA microarray can indeed be used to determine specific PDIs. Later, Warren et al. [22] created microarrays with short synthetic dsD-NAs covering all possible sequence variants of 10 base pairs (bp). Exhaustive search of the entire 10-bp DNA space allows one to detect subtle differences in
DNA-binding activity, and thus a highly accurate consen-sus DNA-binding site is generated. This DNA microarray design permits a rapid and unbiased approach to determine DNA-binding specificity given a protein without any prior knowledge about its possible DNA-binding profiles. However, as the length of DNA-binding sites to be examined increases, it becomes difficult to fit all possible binding sequences on a single microarray. To overcome this limitation, a compact universal DNA microarray design was proposed [23], where a number of DNA-bind-ing sites are allowed to overlap within a given DNA spot. For example, 31 overlapping 10-bp DNA sequences can be packed in a 40-bp DNA molecule. Such design permits a comprehensive examination of all possible sequence vari-ants of a given length, which saves great space on a chip and therefore lowers experiment costs.
Compared to the SELEX-based in vitro selection, PBM provides a larger number of sequence variants to be examined and therefore defines more precise DNA-binding motifs. However, as the PBM method needs relatively high amounts of recombinant protein, it is difficult to analyze proteins that do not express well, such as many full-length TFs, or proteins that require post-translational modifica-tions. Because extensive washing is required to avoid non-specific binding, PBM can normally only detect interac-tions with high affinity. Moreover, PBM cannot currently effectively determine binding specificities for TFs that prefer longer than 10-bp DNA-binding sequences due to the limited number of sequences that can be placed on a chip.
Applications
The power of the PBM approach was dramatically dem-onstrated in a large-scale PDI study by Bulyk, Hughes, and their colleagues, in which the sequence preferences of the majority mouse homeodomain-containing TFs (168) were characterized via probing all possible 8-mer dsDNA sequences [24]. A total of 168 DNA-binding motifs were identified and clustered into 65 distinct groups, showing a rich and diverse sequence preference in homeodomain TFs. Using the identified binding profiles, the authors sought to predict the DNA profiles of a TF from the primary amino acid sequence of the protein. The authors compared pre-viously published chromatin immunoprecipitation data for individual homeodomain TFs with the PBM data obtained in this study and found a considerable amount of overlap. After these first successful efforts, the Bulyk and Hughes’ groups continued characterizing DNA-binding specificities for the majority of yeast TFs. The Hughes’ group identified binding specificities for 112 DNA-binding proteins representing 19 different gene families [25]. More than half of the identified binding motifs corresponded to Double-strand a
single-stranded DNA microarray by primer extension
Hybridize a GST-tagged TF on the microarray
Detect binding events by using a fluorophore-labeled anti-GST antibody
Data analysis
Fig. 3 Workflow of protein binding microarray (PBM)
Protein–DNA interactions 1661
123
(b)Protein-binding arrays (PBM)previously identified ones. In addition, new consensus sites were identified for 36 TFs whose binding preference was not previously characterized. Using previously published ChIP-chip datasets, the authors further characterized two TFs in greater detail and found that their binding sequences tend to cluster at roughly -100 bp relative to the tran-scription start site (TSS), illustrating the biological relevance of the in vitro PDI. Using PBMs that cover all possible 8-mers, the Bulyk group also characterized the DNA-binding preferences for 89 yeast TFs [26]. The authors predicted the potential target genes, regulatory roles, and condition specificities of these TFs using their 8-mer binding profiles. Finally, the authors proposed that these PBM data may be used to interpret ChIP-chip data in order to distinguish direct versus indirect binding targets of immunoprecipitated TFs.
More recently, the Bulyk and Hughes’s groups together profiled the binding site preferences for 104 mouse TFs of different TF families [27]. When the DNA-binding pref-erences for 21 members of the Sox (SRY-related high-mobility group box)/TCF (T cell factor) family were compared, most of them (14/21) preferentially bound to an identical sequence, indicating conserved DNA-binding activity in this subfamily. For the homeodomain family, most of the members recognized the canonical TAAT core sequence, as demonstrated previously [24]. However, when examining the top 100 8-mer DNA sequences bound by each individual protein, one-third of them contained sequences that were substantially different from this canonical consensus homeodomain binding site. Even many well studied homeodomain TFs were found to be able to recognize two distinct binding sites. This observa-tion is consistent with a previous study in which Nkx2-5 was shown to recognize two distinct consensus sites, though binding affinity for each site was significantly dif-ferent [28].
Yeast one-hybrid
The SELEX and PBM approaches are well suited for identifying the preferred DNA-binding sequences for a given protein. However, when the goal is to identify pro-teins that can specifically recognize a given DNA sequence (e.g., a piece of DNA in the promoter of a gene of interest), the yeast or bacterial one-hybrid (Y1H or B1H) system would be a proper choice [29, 30]. More recently, a large number of metazoan TFs have been cloned into expression constructs suitable for Y1H analysis, increasing the extent to which it is possible to systematically interrogate TFs that bind a specific target sequence [31, 32].
Originally, the Y1H system used DNA cloning methods based on restriction digestion for generating the plasmid constructs required, a substantial roadblock for scaling up
to high-throughput analysis. This problem was recently solved by using the Invitrogen Gateway-compatible Y1H system, which allows high-throughput subcloning of mul-tiple DNA baits (cis-regulatory DNA elements) into a Y1H destination vector and detects PDIs based on the selection of reporter gene expression in yeast (Fig.4) [33]. This provides a high-throughput method for the identification of interactions between a DNA ‘‘bait’’ and a protein ‘‘prey.’’ In brief, DNA baits are subcloned to two reporter genes and the two bait::reporter constructs are integrated into the genome of the host yeast strain, where one reporter (HIS3) is used for positive selection of constructs that drive reporter expression, while the other (lacZ) can be measured for a more quantitative readout of transcriptional activation levels [33]. As a control, the baits are first tested for their ability to activate reporter gene expression in the absence of prey proteins, which consist of a fusion of a protein of interest and a transcription activation domain. In the presence of prey proteins, when the protein of interest can recognize and bind to the DNA bait, expression of the reporter gene is activated, and PDIs between the prey protein and its DNA targets can thus be identified.
Applications
Using the Y1H approach, the Walhout group used the promoters of 72C. elegansdigestive tract gene as ‘‘baits’’ and 117 proteins as ‘‘preys’’ and identified 283 specific PDIs [34]. This study identified target sites for 10% of all worm TFs, many of which were previously uncharacter-ized, and the newly annotated TFs are enriched in the digestive tract. Interestingly, they found that 10 proteins not possessing any known DBDs also bound to specific DNA sequences. Using ChIP-PCR assays, eight of these ten proteins were confirmed to bind these sequences in yeast, suggesting that there might be additional uncharac-terized DBDs in worms. Because large DNA fragments can
AD+TF
Bait sequence Positive marker Negative marker Integrate bait sequence
and two selective markers into yeast genome
Transform the construct encoding a fusion of a transcription activation domain (AD) and a TF
Bait sequence Positive marker Negative marker
TF
AD The transcription of the
selective marker is activated if the TF interacts with the bait sequence
Remove self-activation clones by the negative marker
Negative selection medium +
Fig. 4 Workflow of yeast one-hybrid (Y1H)
1662 Z. Xie et al.
123
(c)Yeast-one-hybrid (Y1H)
This central and complex role of protein–DNA interactions has spurred the development of a wide range of methods to study them. The most widespread can be classified as based on yeast–one–hybrid (Y1H) [35, 36], chromatin–immunoprecipitation (ChIP) [37] or protein–binding arrays (PBM) [38, 39], as summarized in Figure 3. Each one of these has its intrinsic strengths and weaknesses. ChIP detects the interactions in their physiologicalin vivoenvironment, but requires specific antibodies for precipitation. If one protein is to be screened against a wide range of binding sequences, a PBM approach is typically chosen, although high amounts of the protein are required and mostly high affinity sequences will be detectable. Y1H is thus a complimentary approach in the sense that it detects binders to a single given DNA sequence.
An additional challenge is the growing need for high–throughput implementations of these established methods, for example in yeast–one–hybrid as proposed by Henset al.[40]. Currently, no single method is known, which works without specific antibodies and is capable of screening multiple DNA sequences against multiple proteins at high sensitivity or resolution. Given the importance of protein–DNA inter-actions in living systems, the development of improved methods is thus inevitable.
Model system: EcoRI
For many of these protein–DNA interaction detection methods, the restriction endonuclease EcoRI from Escherichia colihas emerged as a standard proof–of–principle system before they are applied to physi-ologically more relevant or complex proteins. As a homodimer, it presents a high affinity and specificity to its preferred (palindromic) binding sequence 5’-GAATTC-3’ (cf. Figure 4), which it cleaves by hy-drolysis in the presence of its cofactor Mg2+[41].
158 Jen-Jacobson
FIGURE 1 Energetic components of specific and nonspecific binding of EcoRI endonucle-ase. Favorable contributions are represented by blue arrows, unfavorable by red and observed netDG7bindby green (values for sequence no. 1, Figure 9, at pH 7.3, 0.18M salt, 227C). All
components are estimated and may vary from true values by{50% (see text). For specific binding, the large unfavorable contribution from ‘‘DNA distortion, protein conformation and vibrational restrictions’’ is estimated as the difference between the sum of other components and observedDG7bind. The division into separate components should not be taken to mean that
these contributions to complex formation are independent of each other; they are not.6
terface or for long range electrostatic effects (i.e., from the salt-dependence data, and then add a con-tribution for the interactions of uncharged groups global ion redistribution upon binding)?66
Concepts based solely upon stoichiometric cation with phosphoryl oxygens (Figure 2a). An alternative is to calculate separately the contributions from in-displacement from DNA phosphate by charged side
chains14would appear to be inadequate to deal with teractions of charged67 – 69and uncharged groups
with phosphoryl oxygens. It turns out that the free-the complexity of free-the interactions in free-the protein –
DNA recognition interface. For example, the salt energy contribution of a salt-bridge with a charged side chain is not very different from the contribution dependence of EcoRI binding to a cognate site
(M. Kurpiewski, D. J. Chi, D. Cao, and L. Jen- of a hydrogen bond from an uncharged group to phosphate as determined from studies with mutant Jacobson, unpublished results) indicates that a net
of approximately 12 cations are displaced, but it is proteins.69The two approaches yield similar total
contributions of about030 kcal/mol for the pro-not obvious how this relates to the protein –
phos-phate interactions visualized in the crystal structure tein – phosphate interactions.
Of the 14 phosphates that interact with protein, of the complex.40 – 42One approach is to calculate
the contribution of the polyelectrolyte effect15,67,68
six (three on each DNA strand at pNpGAApTTC)
0010
/ 8701$$0010 09-12-97 11:00:39 nasa W: NAS
(a)Energetic components. (b)Crystal structure.
Figure 4:EcoRI binds its target DNA sequence highly specific as a homodimer. (a)The energetic compo-nents differ between specific (left) and nonspecific (right) binding and show both favorable (blue) and unfavorable (red) contributions to yield a difference in net binding free energy∆G(green). (b)The crystal structure shows two EcoRI monomers (blue and green) forming a homodimer to bind to their consensus dsDNA ligand (red). (a) reproduced from Ref. [42] c1997 John Wiley & Sons, Inc., with kind permission from John Wiley and Sons. (b) rendered from PDB code 1ERI, Ref. [43].
2.2 Force spectroscopy and force assays 9
enthalpically driven by formation of bonds between protein andDNA phosphates, whereas the specific complex with the consensus sequence additionally presents bonds between protein andDNA bases, and energetic contributions based on the hydrophobic effect. These additional contributions are necessary to overcome the entropically driven restrictions of the rotational and translational freedom [42].
2.1.3 Interactions of macromolecular assemblies
Conserved through all branches of life, the main cellular constituents can be classified in four sim-ple classes: nucleic acids, amino acids, sugars and fatty acids. These monomers assemble into poly-mers, typically DNA/RNA, proteins, polysaccharides and lipids, respectively. The underlying building schemes are astonishingly solid and yield macromolecules which surpass their building blocks in size by orders of magnitude: For example, amino acids have an average molecular weight of approximately 110Da, but the giant muscle protein titin – assembled from amino acids alone – is 3.6·106Dain size. The involved length scales are thus very different and the interactions governing their interplay accord-ingly disparate. In some cases, these macromolecules can be assembled non–covalently into even larger structures. Examples of macromolecular assemblies include membranes, viral capsids, enzyme com-plexes, and protein filaments.
Model system: Actin filaments and microtubules
In the context of this thesis, one particular pair of macromolecular assemblies was chosen to be studied in detailin vivo: actin filaments (AF) and microtubules (MT), two main constituents of the cytoskeleton. They are both assembled from polypeptide subunits: actin and tubulin. Actin filaments are typically organized in the cortex, beneath the plasma membrane. MT are typically stretched radially outward from the centrosome. The cytoskeleton in general, and AF and MT in particular, are involved in a series of physiologically relevant phenomena, including cell division [44], mechanical stimulus response [10], and migration [45].
Various modes of interaction between actin filaments and microtubules have been found and studied. An important distinction must be made between regulatory and structural interactions [46]. An exemplary regulatoryinteraction is mediated by the GTPase RhoA, which responds to MT shortening [47] by in-ducing MT stabilization [48] and actomyosin contraction [49].Structuralinteractions on the other hand typically involve mechanical contact, for example via plectin [50] or some molecular motor proteins binding both to microtubules and actin filaments and thus being susceptible of mediating interactions between the two macromolecules.
Besides its many important roles in cell shape, migration and division, the cytoskeleton plays a central role in intracellular transport [51], both in a directed, ballistic mode and in a diffusive manner. For reasons of crowding, caging and obstruction [52], these diffusive phases are not perfectly Brownian, which is hypothesized to be partially due to cytoskeleton components, although the exact contributions and effects remained to be elucidated.
2.2 Force spectroscopy and force assays
about specifically suited methods to study them. It is of core relevance in the context of this thesis to recapitulate common points and differences between them.
2.2.1 Single–molecule AFM force spectroscopy
Designed originally for imaging purposes on the basis of a scanning tunneling microscope, the atomic force microscope (AFM) [53] relies on a cantilever, whose vertical position or deflection is typically determinedviathe reflection of an infrared (IR) laser off its tip onto a quadrant photodiode. Beyond the use as an imaging microscope, it was soon adapted to record forces rather than simple height dif-ferences of the cantilever by determining its spring constant. The force spectroscopy of receptor–ligand interactions, such as biotin–avidin, was a prime example for its use in biological systems [54].
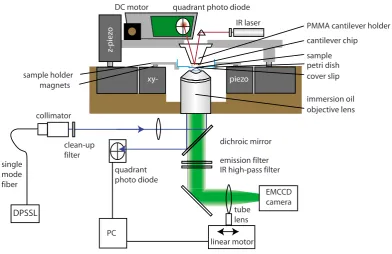
More recently, a combined Total Internal Reflection Fluorescence (TIRF) – AFM was proposed to facil-itate and improve on single–molecule studies involving fluorescence imaging [55]. This combined setup is shown in Figure 5 and allows for the simultaneous confocal surface imaging from below the sample and the access with the AFM cantilever from above for single–molecule force spectroscopy experiments.
thin cover slips, with a thickness of up to 0.15 mm. These
thin glass substrates are prone to deformation and vibrations,
coupling through the system acoustically an even more
im-portant mechanically, and through the air, which hampers
high-resolution AFM measurements. While sound coupling
into the system can be damped effectively by placing the
whole setup in a soundproof box, mechanical vibrations are
still hard to handle. Oscillations below 100 Hz, as arising
from the building, can be effectively damped by active
tables, but higher frequencies and especially noise sources
inside the microscope itself still have to be eliminated.
A high NA-objective lens needs immersion oil to be
op-erated to match the refractive index of the glass substrate.
When using the objective lens for adjusting the focus, as it is
done with virtually all commercially available objective-type
TIRF setups so far, additional vibrations from, e.g., a
focus-ing piezo are coupled into the glass cover slip. Moreover,
moving the objective lens for controlling the focus during the
experiment introduces drift mediated by the immersion oil’s
viscosity. However, for TIRF illumination the focus needs to
be adjusted very precisely, because the evanescent field is
only a few hundred nanometers in depth. During long
mea-surements temperature changes as well as buffer evaporation
may cause the surface to drift out of focus. Hence when
operating commercially available focus piezo stages of the
objective lens in a closed loop in order to correct for this
focus drift, strong vibrations couple into the sample through
the immersion oil, thereby making high-resolution AFM
ex-periments virtually impossible.
III. HYBRID TIRF/AFM
In the evolution of SPMs, compact designs, as rigid as
possible, have proven to minimize both vibrations and
ther-mal drift. This design principle should provide the best
solu-tion for the problems with the mechanical stability discussed
above.
16We kept our AFM head as short and compact as possible
共
see Fig.
1
兲
. Cantilever deflection is measured with an
infra-red superluminescent laser diode SLD-37-HP
共
Superlum
Di-odes Ltd, Cork, Ireland
兲
, which minimizes interferences of
the reflected beam and keeps the entire optical spectrum
open for fluorescent measurements. Servo motors controlling
the
z-position of the head and the position of the deflection
sensing photodiode allow for automatic compensation of
le-ver and probe drift during long term measurements.
The major difference of the presented setup to yet
exist-ing ones is the optimization of the mechanical stability of the
sample-cantilever entity. Whereas in conventional
micro-scopes the objective lens is mounted on a revolver and/or
focusing piezo, our setup contains a high NA-objective lens,
which is rigidly mounted in a massive aluminum block
di-rectly connected to the AFM head, as Fig.
1
shows. This way
the objective is integrated directly in the AFM head,
maxi-mizing the mechanical stability. The sample is located on the
cover slip, glued over a hole drilled into the bottom of a Petri
dish. The latter is clamped tightly to the
xy-piezo scanner by
strong magnets in order to be able to move the sample. It is
adjusted with micrometer screws for coarse alignment.
Mod-ern objective lenses with high NA, such as the Nikon 100
⫻
lens
共
CFI Apo TIRF 100
⫻
, NA 1.49, Nikon Inc., Tokyo,
Japan
兲
we used here, allow variation in the penetration depth
of the evanescent field, depending on the distance of the
beam from the rim of the objective lens. This is achieved by
shifting the laser orthogonally to the optical axis of the
ob-jective lens. This way the penetration depth can be varied
between approximately 200–500 nm.
Focusing is facilitated by moving the tube lens via a
motorized high-accuracy linear translation stage M-605,
共
Physik Instrumente, Karlsruhe, Germany
兲
which focuses the
fluorescence light from the sample onto the chip of the
elec-tron multiplying charge coupled device
共
EMCCD
兲
camera
共
Andor iXon DU-897, Andor Technology, Belfast, Ireland
兲
.
This motor is completely mechanically decoupled from the
rest of the instrument and does not need to stand on the
vibration insulation table.
In order to build a most compact instrument, for the
excitation path, the light of a solid-state diode pulsed laser
共
532 nm DPSS Laser, CrystaLaser, Reno, NV, USA
兲
is
coupled into a single-mode optical fiber and used for
fluo-rescence excitation via a compact slider unit consisting of a
collimator lens, a clean-up filter, a lens for focusing the beam
into the back focal plane of the objective lens, and an
adjust-able dichroic mirror that directs the light to the sample. This
unit can be replaced easily with another one containing an
alternative filter set, when working with a different laser. In
total internal reflection the back-reflected beam hits a
quad-rant photo diode, which measures its position. This way a
change in the lateral position of the reflected beam and hence
a change in distance between the objective lens and the cover
slip can be determined. Finally this information can be used
for the adjustment of the focus via the tube lens.
By moving the tube lens via the linear translation stage,
the relative distance from the charge coupled device chip and
therefore the magnification is altered. This effect can be
z-piez
o
piezo
quadrant photo diode
IR laser objective lens petri dish cover slip immersion oil cantilever chip sample holder magnets
PMMA cantilever holder
sample DC motor
dichroic mirror
emission filter IR high-pass filter
tube lens DPSSL single mode fiber collimator clean-up filter quadrant photo diode EMCCD camera linear motor PC
xy-FIG. 1.
共
Color online
兲
Schematic drawing of the combined AFM/TIRF
mi-croscope. TIRF excitation is performed by a diode pulsed solid-state laser
coupled to a single-mode fiber. Using a collimator lens and a biconcave lens
for focusing the beam on the back focal plane of the objective lens,
wide-field TIRF illumination is achieved. Fluorescence emission passes through
an appropriate filter set and is collected by the EMCCD camera. The tube
lens is used for focusing and therefore mounted on a linear translation stage
controlled by a PC that reads the position of the back-reflected beam from a
quadrant photo diode. With this feedback a constantly sharp image can be
ensured.
063704-2
Gumpp
et al.
Rev. Sci. Instrum.
80
, 063704
共
2009
兲
This article is copyrighted as indicated in the article. Reuse of AIP content is subject to the terms at: http://scitationnew.aip.org/termsconditions. Downloaded to IP:
129.187.254.47 On: Fri, 27 Dec 2013 11:28:17
Figure 5:Combined TIRF/AFM setup: The sample (blue) is accessed from above with an atomic force micro-scope (AFM) (grey), featuring IR laser, cantilever, photodiode and z-piezo and from below with a Total Internal Reflection Microscope (TIRF) (black) featuring an excitation laser, filters, a motorized tube lens and an EMCCD camera. The sample and cantilever can be movedviaa xy-piezo stage. Reprinted with permission from Ref. [55]. c2009, AIP Publishing LLC.
2.2 Force spectroscopy and force assays 11
freely–jointed–chain (FJC) model and the freely–rotating–chain (FRC) model. Transformation into con-tour length space facilitates data interpretation, for the length increment is closely related to the number of monomers in the ruptured element, for example the number of amino acids in a protein of interest. It has become clear, that the interaction forces and the function of molecules are closely related on the single–molecule level [57]. The mechanoenzymatics relating force and function have exemplarily been elucidated with the protein titin kinase [58]: AFM–based SMFS revealed that mechanical strain–induced conformational changes unveil the ATP binding site necessary for lifting the autoinhibition of the kinase enzymatics. The capabilities of AFM–SMFS continue to be expanded, as highlighted by a recent investi-gation, which showed force–extension traces at high–speed with retraction velocities of up to 1mm·s−1, comparable to theµs-timescales studied by steered molecular dynamics (MD) simulations [59].
AFM–SMFS has brought about important insights into the dynamics of single molecules. The most widespread alternatives to study similar questions are magnetic tweezers and optical traps [60]. Both use external fields to control micrometer–sized beads. In the case of magnetic tweezers paramagnetic beads are subjected to forces in a magnetic field gradient with the advantage of good force resolution. Optical traps, on the other hand, rely on momentum transfer upon refraction, reflection and scattering of light, generating forces towards the focal point of a laser beam.
2.2.2 The molecular force assay MFA
Despite the numerous advantages of single–molecule force spectroscopy using an AFM cantilever, some biological investigations call for statistics from ensembles of a high number of probes. The experimental technique known as molecular force assay (MFA) addresses exactly this need [61].
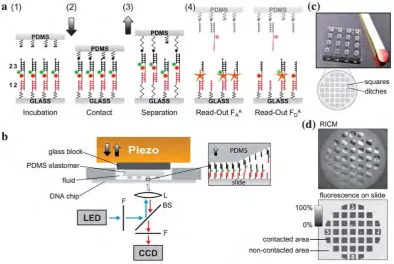
It is based on the assembly of two molecular bonds in series on a surface, one probe and one reference bond. A force is applied by coupling to a retracting surface. The coupling typically occurs via biotin– avidin interaction. After retraction, fluorescent labels reveal the bond rupture site, as shown in Figure 6. The probe bond rupture probability can be shifted by a potential binder, such as a DNA-binding protein. The molecular force assay boasts important advantages: First, the high surface density of force probes and parallel force load allow for significant statistics in a single run. Second, the active force load makes strong binders up to pM dissociation rates experimentally accessible. Third, the sensor being a single molecule, the noise is reduced to a minimum and sensitivity is high. Furthermore, binder molecules do not require fluorescent labeling, in particular, no cloning or immunolabelling are needed. Finally, the reference bond strength can be tuned over a wide rangeviaits oligomer length.
The applications of the molecular force assay in its classic, macroscopic form are numerous and span a wide variety of molecular interactions: Properties of DNA were elucidated in detail from detection of mismatches [62] to epigenetic modifications by methylation [63] or hydroxymethylation [64]. Beyond pure DNA probes, the effect of binding by polyamides, transcription factors and nucleases [65] and the interaction between RNA and proteins [66] were studied in high detail.
2.2.3 Measuring intracellular dynamics and forces
different MFPs matching the pads of the soft PDMS stamp (Fig. 1c). The glass slide is attached to a PMMA well with sili-cone lip seal and fixed on a stainless steel stage with permanent magnets. The PDMS elastomer is placed upside down on a glass block connected vertically to a closed-loop piezoelectric actuator (PZ 400, Piezo Systems Jena, Germany) and a DC motorized translation stage (Physik Instrumente GmbH, Germany). The whole contact device is mounted on an inverted microscope (Axio Observer Z1, Carl Zeiss MicroImaging GmbH, Germany)
with an xy DC motorized high-accuracy translation stage
(Physik Instrumente GmbH, Germany). The planar adjustment between stamp and DNA chip as well as the contact process (Fig. 1d) are controlled via reflection interference contrast microscopy.31
One novel advancement is the direct readout of the DNA chip placed in the contact device. First it allows the fluorescence readout of the sample directly before and after the contact process in buffer solution without any stringent washing steps as done previously. Due to the diminishment of the systematic error caused by washing steps, the reproducibility and robustness of the experiment could be improved further. Secondly we could move away from the confocal microarray scanner to epi-fluo-rescence microscopy, which has several advantages including a simpler setup, improved signal-to-noise ratio and an elevated
reliability against surface inhomogeneities as depicted later. High-power LEDs (Philips Lumileds Lighting Comp. CA) were used for illumination. A simple cooling system composed of heat sink and fans combined with low-noise current drivers stabilizes the intensity of the LEDs with less than per mil deviation per hour. A standard CCD camera (MRm, Carl Zeiss MicroImaging GmbH, Germany) was used for detection. The entire contact and detection process is semi-automated via customized control software (LabVIEW, National Instruments Germany GmbH).
Analysis
To determine the ratio between broken target and reference bonds, a more subtle analysis is required, since it cannot be assumed that all MFPs physically connect perfectly to both surfaces via the biotin$streptavidin bond. Uncoupled MFPs result in a background signal. In order to calculate the normal-ized fluorescence (NF) intensity the background signal caused by uncoupled MFPs has to be identified and subtracted from the latter one. For simplicity, the unlikely case that the bio-tin$streptavidin bond ruptures is not further considered, since the MFP remains in the state S0 (1$2$3) and does not affect the final result. The NF is defined as the ratio between broken reference bonds and the total amount of MFPs that have been
Fig. 1 Molecular force assay based on soft-print lithography. (a) Schematic representation of the MFA on a molecular level showing the basic principle and successively the assay processes. (a1) The molecular force probes (MFPs) are anchoredviaDNA strand1to the glass support. Each MFP comprises of 3 DNA strands. These 3 DNA strands hybridize in two DNA duplexes,1$2and2$3, coupled in series. DNA strand2carries a Cy5 as fluorescent marker and strand3a Cy3. The PDMS surface and the glass surface are still separated. (a2) The PDMS stamp is moved down to contact the glass surface. Thereby the biotin on DNA strand3couples to the streptavidin of the PDMS stamp and thus forms a bridge between the glass and PDMS. (a3) The surfaces are separated and a force builds up along both DNA duplexes of the MFPs until one of the two DNA duplexes ruptures. (a4) To count the number of intact, remaining1$2duplexes, the glass slide is readoutviathe fluorescence Cy5 dye on strand2. During the readout the PDMS stamp is far out of the focal plane. In the last step Cy5 is excitedviaFRET to mark all MFPs that did not couple to the PDMS stamp while in contact. (b) The fluid well with the DNA chip was placed in the contact device with PDMS stamp and detection system. A piezoelectric actuator moves the PDMS stamp along thez-axis to contact the DNA-chip. A standard fluorescence microscope with LED illumination and CCD camera is used to read out the sample. (c) The PDMS stamp consists of 16 pads. Each pad has a diameter and height of 1 mm. The microstructure on a pad comprises 100100mm squares with an elevation of 5mm. The trenches between the squares are about 41mm wide. (d) The planar adjustment between stamp and DNA chip as well as the contact process is controlledviareflection interference contrast microscopy. After contact, the fluorescence readout gives quantitative information about the ratio of broken reference and target duplexes.
858 | Lab Chip, 2011, 11, 856–862 This journal isªThe Royal Society of Chemistry 2011 Downloaded by Ludwig Maximilians Universitaet Muenchen on 05 April 2011 Published on 10 January 2011 on http://pubs.rsc.org | doi:10.1039/C0LC00302F
Figure 6:Classical Molecular Force Assay (MFA). (a)The molecular principle of the MFA builds on a se-quence of five steps: incubating the molecular force probes on the lower glass surface; establishing contact with the elastomeric (PDMS) top surface; applying rupture forces by surface separation; fluo-rescence readout of the rupture signal; and fluofluo-rescence read–out of the coupling efficiency signal.(b)
The macroscopic setup of the classical MFA features a piezo to establish contact between PDMS and glass surfaces, a fluid chamber, and an inverted epifluorescence microscope with LED excitation and CCD camera. (c)The elastomeric top of the classical MFA feature 16 macroscopic pillars with 100µ m-sized elevations. (d) The readout of Reflection Interference Contrast Microscopy (RICM) shows approach and retract dynamics. The readout of fluorescence signal after contact and separation reveals relative rupture probabilities. cThe Royal Society of Chemistry 2011; Reproduced from Ref. [61] with permission of The Royal Society of Chemistry.
on a wide range of timescales [67]: Switching of ion channels upon external stimulus is a matter of seconds; subsequent responses by the cell involving signaling cascades take minutes to hours; ultimate cell fate (division, differentiation, apoptosis) may take days. At the same time, the behavior of cell populations is heterogenous and noisy, so single–cell data is collected for quantitative studies of their dynamics. Accordingly varied are the methodsto study each of these events and dynamics and their plurality is beyond the scope of this thesis. Many are based on fluorescence imaging, some label–free, others use external probes such as cantilevers. A remarkable review of the specific uses and applications in single–cell studies for each of these has been given by Spilleret al.[67].
2.3 Microfluidic lab–on–a–chip technologies 13
living cell cytoplasm has been proposed, which bears close resemblance to soft glassy materials, with scaling laws of the rheological moduli and a continuous distribution of relaxation times [72].
Another particularly popular variant is based on the tracking of internalized particles [73]: The lo-cation of particles is determined in high precision by Gaussian fits to their fluorescence signal. The recorded single–particle traces can then be analyzed, typically by calculating Mean Squared Displace-ments (MSD) in the lagtime space.
h∆R2(τ)i=h(R~(t0+τ)−R~(t0))2it0=A·τα
Some qualitatively different regimes are typically distinguished, according to the value of the MSD ex-ponentα:
MSD exponent regime
α=0 no net movement
α <1 subdiffusive
α=1 Brownian
α >1 superdiffusive
α=2 directed or ballistic
These MSD curves can then be transformed into frequency–space yielding viscoelastic moduli. Low values ofα≈0 correspond to elastic–like behavior (the in–phase rheological response functionG0(ω)), whereasα≈1 is characteristic of viscous behavior (similar to the out–of–phase rheological response G00(ω)). Lag–time dependent motion exponentsα(τ) correspond to viscoelastic materials with frequency– dependent moduliG∗(ω). In the context of this thesis, aLocal MSDanalysis algorithm is of particular interest: A rolling window screens the data subtrace by subtrace and calculates local motion parameters (in time), namely the effective diffusion constant and the MSD exponent [74].
2.3 Microfluidic lab–on–a–chip technologies
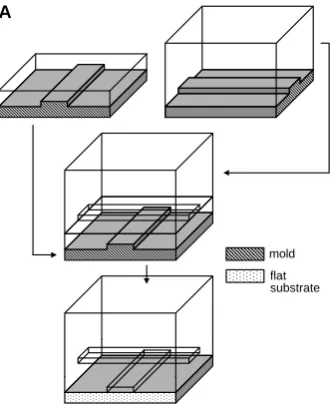
In an effort to miniaturize, parallelize and automize typical biochemical tasks from established labo-ratory processes, the fields of lab–on–a–chip in general and microfluidics in particular have spurred innovation over the past decade with significant success both in academic research and in commercial applications. The diversity of methods and applications is astonishing, ranging from pressure driven laminar flow to droplet–based digital microfluidics. This section covers the multilayer soft lithography technique used in the context of this thesis and gives an overview of alternative approaches.
2.3.1 Multilayer soft lithography and the MITOMI chip
![Figure 2 introduces a particularly intriguing class of enzymes, presented in the context of this thesisand involved in biomass degradation by multimodular protein assemblies, the cellulosomes [22]](https://thumb-us.123doks.com/thumbv2/123dok_us/1868603.1243052/16.595.75.516.414.626/introduces-particularly-intriguing-thesisand-degradation-multimodular-assemblies-cellulosomes.webp)