An Improved Hierarchal Clustering Algorithm
using Feature Reduction Techniques and
Clustering Validation Indices
Nitin Soni#1, Prof Abha Choubey*2 1,2
Computer Science and Engineering, Faculty of Engg & Tech, SSGI Bhilai, India
Abstract— Number of variables or attributes of any data set effect to a
large extent clustering of that particular data. These attributes directly affect the dissimilarity or distance measures thereby effecting accuracy of data. So dimensionality reduction techniques can definitely improve clustering. As clustering is a unsupervised machine learning technique, the validation of results obtained from application of clustering algorithm to a particular data set is a big issue. This paper formulates a new model for data clustering using combination of feature extraction, data clustering algorithm and clustering validity index/indices. The data clustering algorithm used is Agglomerative Hierarchal Clustering Algorithm. The different features reduction techniques used are PCA, CMDS, ISOMAP and HLLE. The clustering validity indices used are Silhouette index, Dunn index, Davies Bouldin Index and Calinski Harbasaz index.
Keywords—Agglomerative Hierarchal Clustering, PCA, CMDS,
ISOMAP, HLLE, Silhouette Index, Dunn Index, Davies-Bouldin Index, Calinski Harbasaz Index.
I. INTRODUCTION
Clustering is a process of classifying data tupples into groups called Clusters. The specific characteristics of these groups are not known beforehand. The tupples within a group of cluster are some similar to each other than they are to data instances in other groups. Clustering is an example of Unsupervised Learning. Data clustering is a universal data organization technique with applications in wide variety of fields such as marketing, engineering etc[1]. Different types of clustering algorithms are Hierarchal clustering, Partition clustering, graph clustering, density clustering etc. An important partition based techniques is Agglomerative Clustering Algorithm. This algorithm, considers each data tupple as a cluster. Out of all the clusters, two clusters are selected with minimum distance and are merged. This new cluster replaces the two clusters which have been combined. The above two steps are repeated until all there is only one clustering remaining. Clusters are combined using a distance metric and linkage criteria. Some of the distance metrics used are Euclidean distance, Manhattan distance, Mahalanobis distance etc. Different types of linkage include complete linkage, single linkage, centroid linkage [1]. This paper uses centroid linkage and Euclidean distance.
Feature or Dimensionality Reduction Techniques are used to reduce the number of variables or attributes of the data set. These techniques are linear such as PCA or non-linear such as ISOMAP[2]. The techniques used by this paper for feature reduction are PCA, CMDS, ISOMAP and HLLE. As clustering is a process of classification where class
is required [3]. There are three types of clustering validity indices:- internal, external and relative indices. Internal Indices measure quality of clustering indices without the use of any external knowledge. External indices compare the clustering algorithm results with class labels of data sets (if known). Relative Indices compare clustering results of different clustering algorithms. This paper uses the following four internal indices:- Davies-Bouldin Index[4], Calinski-Harbasaz Index[5], Dunn’s Index[6] and Silhouette Index[7].
Section I of this paper deals with the introduction of concepts used in this paper. Section II deals with Literature Review, Section III deals with Problem Identification, Section IV deals with Methodology, Section V with Datasets used for experiments, Section VI with Experiments and Results, Section VII on improved clustering algorithm Section VIII Conclusion followed by Acknowledgement
II. LITERATURE REVIEW
Impact of dimensionality reduction techniques on data Clustering algorithms has been quantified by researchers in past. In 2004 Chris Ding et al., showed that results of data clustering algorithms can be improved using dimensionality reduction techniques [8]. Seong S. Chaea et al in 2006 showed that Principal Coordinate Analysis (also known as classical multidimensional scaling) is better than Principal Component Analysis in improving data clustering results.[9]. Hai-Dong Meng et al., in 2010 showed that dimensionality reduction techniques had no effect on data clustering algorithms when number of dimensions of data set exceeded 30 [10]. Rajashree Dash et al., in 2010 derived initial centroids of reduced data set obtained by PCA for K-means algorithm and showed improvement in data clustering [11]. In August 2013,S. M. Shaharudin et al., proved that PCA improves data clustering significantly if Tukey's biweight correlation matrix is used instead of Pearson correlation matrix in calculating principal components [12] .
Olatz Arbelaitz et al., in 2012, have compared the efficiency of 30 different clustering validity indices [13].
III. PROBLEM IDENTIFICATION
visualization. Also linear dimensionality reduction techniques have been proven to be ineffective in improving data clustering results when number of dimensions of data set are more than 30 [10].
The large number of clustering validity indices has compounded the problem of data clustering. Different clustering validity indices give different results and at times it is very difficult to choose the clustering validity index for proper validation [13].
IV METHODOLOGY
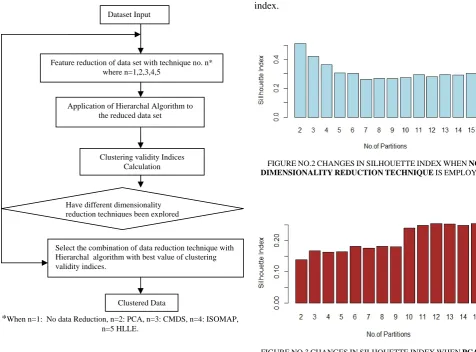
As shown in the figure, there are two impotents steps in the proposed model. In the first important step, dimensions of the data set are reduced using different dimensionality reduction techniques. The techniques used are PCA, CMDS, ISOMAP and HLLE. After this step the data is clustered using Hierarchal Clustering Algorithm. In the next step the clustering is validated using different clustering validity indices. In the last step the different clustering validity indices obtained from combination of dimensionality reduction techniques and hierarchal clustering algorithms have compared. In the end, a combination of data reduction technique, hierarchal clustering algorithm and clustering validity index has been proposed In all, a total of 20 experiments have been conducted before final model has been propsed. The figure 1 shows the methodology used.
NO
YES
*When n=1: No data Reduction, n=2: PCA, n=3: CMDS, n=4: ISOMAP, n=5 HLLE.
FIGURE NO.1 METHODOLOGY
V. DATASET FOR EXPERIMENTS
The dataset used for experiment is Libras Movement Data Set from UCI Machine Learning Repository [14]. This data set has has 360 tupples, 90 attributes and 15 clusters.
VI. EXPERIMENTS AND RESULTS
The impact of dimensionality reduction techniques on k-medoids clustering algorithm is shown by studying variation on clustering validity index with respect to number of partitions k. If a clustering validity index for a particular dimensionality reduction techniques accurately predicts the number of partition, that particular feature reduction method and clustering validity index is considered to be effective. In each case the database taken is Libras-Movement database. To conduct experiments, packages from MATLAB and R software are used.
VIA. CHANGES IN SILHOUETTE INDEX
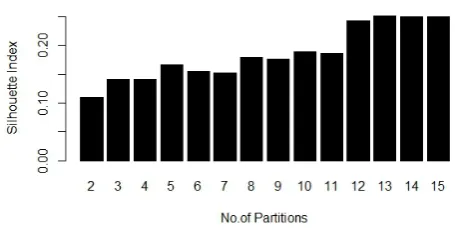
The value of silhouette index ranges from -1 to +1. A value of +1 implies that any data instance assigned to any particular cluster is similar to other instances in that particular cluster and a value of -1 indicates dissimilarity [7]. In figures 2 to 6 shown below depict values of silhouette indices when different dimensionality reduction techniques are used and also when no dimensionality reduction is done. In each figure horizontal axis depicts number of partitions and vertical axis depicts Silhouette index.
FIGURENO.2CHANGESINSILHOUETTEINDEXWHENNO
DIMENSIONALITYREDUCTIONTECHNIQUEISEMPLOYED
FIGURENO.3CHANGESINSILHOUETTEINDEXWHENPCAIS
EMPLOYED Dataset Input
Feature reduction of data set with technique no. n* where n=1,2,3,4,5
Application of Hierarchal Algorithm to the reduced data set
Clustering validity Indices Calculation
Select the combination of data reduction technique with Hierarchal algorithm with best value of clustering validity indices.
FIGURENO.4CHANGESINSILHOUETTEINDEXWHENCMDSIS EMPLOYED
FIGURE NO.5 CHANGES IN SILHOUETTE INDEX WHEN ISOMAP
IS USED.
FIGURE NO.6 CHANGES IN SILHOUETTE INDEX WHEN ISOMAP
IS USED
It is evident from above bar graphs, the silhouette index range when HLLE is applied as a dimensionality reduction technique is 0.92 to 0.96. For all other dimensionality reduction techniques and when no dimensionality reduction technique is applied the Silhouette index ranges from 0.2 to 0.4. So the bar graphs show dramatic improvement in silhouette index values when HLLE is applied as the dimensionality reduction technique as compared to other techniques or when no technique is applied, thereby showing improvement in quality of clustering. But the drawback of HLLE is that is unable to predict the
accurate number of clusters. Its value of silhouette index
remains constant for all values of partitions.
VI B. CHANGES IN DUNN INDEX
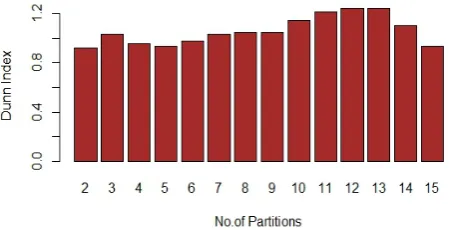
Next we consider changes in Dunn index. A higher value of Dunn index indicates better clustering results [5]. Figures 7 to 11 depict Dunn indices for different approaches. Horizontal axis shows different number of partitions and vertical axis depicts values of Dunn Index.
FIGURE NO.7 CHANGES IN DUNN INDEX WITH NO DIMENSIONALITY REDUCTION
FIGURE NO.8 CHANGES IN DUNN INDEX WITH PCA AS DIMENSIONALITY REDUCTION TECHNIQUE
FIGURE NO.9 CHANGES IN DUNN INDEX WITH CMDS AS DIMENSIONALITY REDUCTION TECHNIQUE
FIGURE NO.11 CHANGES IN DUNN INDEX WITH HLLE AS DIMENSIONALITY REDUCTION TECHNIQUE
It is evident from figure 6 to figure 11that Dunn Index values from range from 0 to 2.8 for different dimensionality reduction technique (the values are highest when no dimensionality reduction technique is applies ). So according to dunn index values, dimensionality reduction techniques don’t improve performance of hierarchal clustering algorithm.
VI C
.
CHANGES IN DAVIES–BOULDIN INDEXNext index considered is Davies-Bouldin index. The smaller the value of this index, the better the clustering results [4]. Figures 12- 16 depict show variation in values of Davies-Bouldin index for different values of partitions.
FIGURE NO. 12. CHANGES IN DAVIES-BOULDIN INDEX WHEN NO DIMENSIONALITY REDUCTION TECHNIQUE IS EMPLOYED
FIGURE NO.13. CHANGES IN DAVIES-BOULDIN INDEX WHEN PRINCIPAL COMPONENT ANALYSIS IS EMPLOYED
FIGURE NO. 14. CHANGES IN DAVIES-BOULDIN INDEX WHEN CMDS IS EMPLOYED
FIGURE NO. 15. CHANGES IN DAVIES-BOULDIN INDEX WHEN ISOMAP IS EMPLOYED
FIGURE NO. 16. CHANGES IN DAVIES-BOULDIN INDEX WHEN HLLE IS EMPLOYED
The figures 12 to 16 show that values of Davies-Bouldin Index approaches a lower value for correct number of clusters (The exception being FIGURE 14 where Davies-Bouldin index approaches lowest value for inaccurate number of clusters). But the variation in Davies-Bouldin indices is not much and so nothing can be concluded about efficacy of dimensionality reduction techniques.
VI D
.
CHANGES IN CALINSKI-HARABASZ INDEXNext we consider changes in Calinski-Harabasz Index. A higher value of Calinski-Harbasaz Index indicates
better clustering results [6]. Figures 17 to 21 depict the
FIGURE NO.17. CHANGES IN CALINSKI HARBASAZ INDEX WHEN NO DIMENSIONALITY REDUCTION IS EMPLOYED
FIGURE NO.18. CHNAGES IN CALINSKI HARBASAZ INDEX WHEN PCA IS EMPLOYED
FIGURE NO.19. CHANGES IN CALINSKI HARBASAZ INDEX WHEN CMDS IS EMPLOYED
FIGURE NO.20. CHANGES IN CALINSKI HARBASAZ INDEX WHEN ISOMAP IS EMPLOYED
FIGURE NO.21. CHANGES IN CALINSKI HARBASAZ INDEX WHEN HLLE IS EMPLOYED
Figures 17 to 20 are inconclusive. The range of values for Calinski-Harbasaz (CH) Index remains the same from 50 to 100 (except in case of FIGURE 17 where the values range from 650 to 320). In some cases the Index values decrease for accurate number of clusters instead of increasing. But figure number 21 stands out from the rest. First of all the range of values are from 50 to 1100, 1100 being the value for number of partitions equal to 15 and 50 for number of partitions equal to 2. So the CH Index is accurately predicting the number of partitions in the
Libras Movement database. Also the jump in the range of
values (38 to 1673) indicate a corresponding jump in the quality of clustering. This indicates that for Libras data base with 90 attributes and 15 classes, application of
HLLE improves clustering.
VII.AN IMPROVED HIERARCHAL CLUSTERING
ALGORITHM
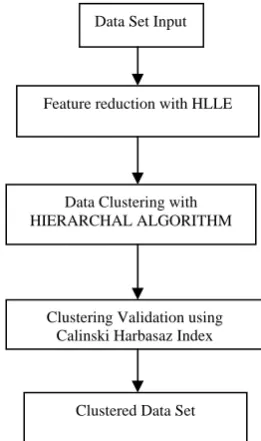
Based on above result the following figure 22 depicts an optimized data clustering HIERARCHAL DATA CLUSTERING algorithm.
FIGURE NO.22. AN OPTIMIZED DATA CLUSTERING ALGORITHM
Data Set Input
Feature reduction with HLLE
Data Clustering with HIERARCHAL ALGORITHM
Clustering Validation using Calinski Harbasaz Index
As it is clear from the above figure that our optimized HIERARACHAL DATA CLUSTERING algorithm uses
HLLE for dimensionality reduction and CALINSKI
HARBASAZ INDEX for clustering validation.
VIII. CONCLUSIONS
In this paper different techniques of dimensionality reduction in conjunction with HIERARACHAL CLUSTERING algorithm are applied on Libras Movement database. To detect their effectiveness, four clustering validity indices are used. From the results obtained it can be concluded that HLLE is a better dimensionality reduction technique than PCA, CMDS and ISOMAP for improvement of clustering results. Also
Calinski-Harbasaz Index outperforms Dunn Index, Davies Bouldin
Index and Silhouette Index for validating data clustering.
ACKNOWLEDGMENT
We would like to give special thanks to Mrs Samta Gajbhiye, Head of Department, Computer Science and Engineering, Faculty of Engineering and Technology, Shri Shankaracharya Group of Institutions(SSGI), Bhilai and Dr P.B.Deshmukh, Director, SSGI for their continuous motivation and support.
REFERENCES
[1] Bing Liu, Web Data Mining : Exploring Hyperlinks Contents and Data Second Edition, Springer-Verlag Berlin Heildberg 2007,2011.
2] Wendy L. Martinez, Angel R. Martinez, Jeffery L. Solka,
Exploratory Data Analysis with MATLAB Second Edition, CRC
Press, Taylor & FL Francis Group, 6000 Broken Sound Parkway NW, Suite 300, Boca Raton, 33487-2742, 2011.
[3] Goujon Gan, Chaoqun Ma, and Jianhong Wu, Data Clustering Theory, Algorithms, and Applications, ASA-SIAM Series on VA, Statistics and Applied Probability, SIAM, Philadelphia, ASA, Alexandria, 2007.
[4] D. L. Davies and D. W. Bouldin, A cluster separation measure, IEEETransactions on Pattern Analysis and Machine Intelligence, PAMI-1, no. 2:224-227, 1979.
[5] J. Dunn, Well separated clusters and optimal fuzzy partitions, Journal of Cybernetics, 4:95-104, 1974.
[6] T. Calinski and J. Harabasz, A dendrite method for cluster analysis, Communications in Statistics, 3, no. 1:1- 27, 1974
[7] Rousseeuw P.J, Silhouettes: a graphical aid to the interpretation and validation of cluster analysis, Journal of Computational and Applied Mathematics , 20:53-65, 1987
[8] Chris Ding and Xiaofeng He, Principal Component Analysis and k- means Clustering, SIAM, Philadelphia, ASA, Alexandria, VA, 2004 [9] S.S. Chae, W.D. Warde, Effect of using principal coordinates and
principal components on retrieval of clusters, Computational Statistics & Data Analysis 50 (2006) 1407 – 1417.
[10] Hai-Dong Meng, Jin-Hui Ma, Guan-Dong Xu, Experimental
Research on Impacts of Dimensionality on Clustering Algorithms,
978-1-4244- 5392-4/10 , IEEE 2010.
[11] Rajashree Dash, Debahuti Mishra, Amiya Kumar Rath, Milu Acharya A hybridized K-means clustering approach for high dimensional dataset, International Journal of Engineering, Science and Technology,Vol. 2, No. 2, 2010, pp. 59-66.
[12] S. M. Shaharudin, N. Ahmad, F. Yusof, Improved Cluster
Partition in Principal Component Analysis Guided Clustering,
International Journal of Computer Applications (0975 – 8887), Volume 75– No.11, August 2013.
[13] Olatz Arbelaitz ,IbaiGurrutxagan, Javier Muguerza, Jesu´s M.Pe´ rez, In˜igo Perona, An extensive comparative study of cluster validity indices, Pattern Recognition, Elsevier 2012.
[14] K. Bache and M.Lichman, (2013), UCI Machine Learning