Review and Comparative Study of Clustering
Techniques
Shraddha K.Popat Emmanuel M.
Pune Institute of Computer Technology Pune Institute of Computer Technology Department of Information Technology Prof. &Head of Information Technology
University of Pune University of Pune
India India
Abstract— Clustering is an automatic learning technique which aims at grouping a set of objects into clusters so that objects in the same clusters should be similar as possible, whereas objects in one cluster should be as dissimilar as possible from objects in other clusters. Document clustering aims to group in an unsupervised way, a given document set into clusters such that documents within each clusters are more similar between each other than those in different clusters. Cluster analysis aims to organize a collection of patterns into clusters based on similarity. This paper focuses on survey of various clustering techniques. These techniques can be divided into several categories: Partitional algorithms, Hierarchical algorithms, Density based, and comparison of various algorithm is surveyed and shows how Hierarchical Clustering can be better than other techniques.
Index Terms—Clustering, Document Clustering, Partitional, Hierarchical, Similarity measures.
I. INTRODUCTION
Data Miming is one of the important step for mining or extracting a great deal of information. It is designed to explore giant amount of information in search of consistent patterns and to validate the results by the detected patterns to the new subset of information. Clusters are often thought of as the foremost necessary unsupervised learning problem, which deals with the problems in data assortment of unlabelled information[10]. Clustering is the most interesting topics in data mining which aims of finding intrinsic structures in data and find some meaningful subgroups for further analysis. It is a common technique for statistical data analysis, which is used in many fields, including machine learning, data mining, pattern recognition, image analysis and bioinformatics. Thus a cluster could also be defined as the “methodology of organizing objects into groups whose members are similar in some way.”
Figure 1.Cluster Formation[20]
II. WHY CLUSTERING
Data Clustering is one of the challenging mining techniques in the knowledge data discovery process. Clustering huge amount of data is a difficult task since the goal is to find a suitable partition in a unsupervised way (i.e. without any prior knowledge) trying to maximize the intra-cluster similarity and minimize inter-cluster similarity which in turn maintains high cluster cohesiveness. Clustering groups data instances into subsets in such a manner that similar instances are grouped together, while different instances belong to different groups. The instances are thereby organized into an efficient representation that characterizes the population being sampled. Thus the output of cluster analysis is the number of groups or clusters that form the structure of partitions, of the data set. In short clustering is the technique to process the data into meaningful group for statistical analysis. The exploitation of Data Mining and Knowledge discovery has penetrated to a variety of Machine Learning Systems. A very important area in the field of Machine learning is Text Categorization. Feature selection and Term weighting are two important steps that decide the result of any Text Categorization problem.[24]
Figure 2.Clustering Process [15]
III. MOTIVATION
As the amount of digital documents over the years as the Internet grows has been increasing dramatically, managing information search, and retrieval, etc., have become practically important problems. Developing methods to organize large amounts of unstructured text documents into a smaller number of meaningful clusters would be very helpful as document clustering is vital to such tasks as indexing, filtering, automated metadata generation, population of hierarchical catalogues of web resources and,
Shraddha K.Popat et al, / (IJCSIT) International Journal of Computer Science and Information Technologies, Vol. 5 (1) , 2014, 805-812
in general, any application requiring document organization .Also there are large number of people who are interested in reading specific news so there is necessity to cluster the news articles from the number of available articles, since the large number of articles are added each data and many articles corresponds to same news but are added from different sources. By clustering the articles, we could reduce our search domain for recommendations as most of the users are interested in the news corresponding to a few number of clusters. This could improve the result of time efficiency to a greater extent and would also help in identification of same news from different sources. The main motivation is to investigate possible improvements of the effectiveness of document clustering by finding out various clustering algorithms available.
IV. TYPES OF CLUSTERING
Document clustering is define as the grouping of similar text document into clusters such as that the documents within the clusters have high similarity in comparison to one another but are dissimilar to documents in other clusters. As thousands of electronic documents have been added on the World Wide Web it becomes very important to browse or search the relevant data effectively. To identify suitable algorithms for clustering that produces the best clustering solutions, it becomes necessary to have a method for comparing the results of different clustering algorithms. Many different clustering techniques have been defined in order to solve the problem from different perspective, these are:-
• Partitional Clustering • Density based Clustering • Hierarchical clustering
A Partitional Clustering
Partitional clustering is considered to be the most popular class of clustering algorithm also known as iterative relocation algorithm. These algorithms minimize a given clustering criterion by iteratively relocating data points between clusters until a optimal partition is attained. Partition clustering algorithm splits the data points into k partition, where each partition represents a cluster. The partition is done based on certain objective function. The cluster are formed to optimize an objective partitioning criterion, such as a dissimilarity function based on distance, so that the objects within a cluster are “similar”, whereas the objects of different cluster are “dissimilar”. Partitioning clustering methods are useful for the applications where a fixed number of clusters are required. K-means, PAM (Partition around mediods) and clara are some of the partitioning clustering algorithms.
Figure 3.Partitional Clustering[17]
4.1.1 K-means
K-means was proposed by MacQueen and is one of the most popular partition-based methods. It partitions the dataset into k disjoint subsets, where k is predetermined. The algorithm keeps adjusting the assignment of objects to the closest current cluster mean until no new assignments of objects to clusters can be made.[18] One Advantage of this algorithm is its simplicity. It also has several drawbacks. It is very difficult to specify number of clusters in advance. Since it works with squared distances, it also sensitive to outliers. Another drawback is the centriods is not meaningful in most problems.
4.1.2 PAM(Partitioning Around Mediods)
The Partitioning Around Medoids (PAM) algorithm was introduced by Kaufman and Rousseeuw. It is based on the k representative objects, called medoids, among the objects of the dataset. The medoids are points with smallest average dissimilarity to all other points.[18] The algorithm follows the same steps that are followed by the k-means algorithm, but the use of medoids instead of means makes the algorithm more robust to outliers. PAM can also be used in datasets that have categorical and/or other types of discrete data, such as binary data. One of the problems of the PAM algorithm is that the desired number of clusters must be predetermined.
4.1.3 CLARA(Clustering Large Applications)
Both the k-means and PAM algorithms are slow and not practical because for a fixed number k of clusters as the number of possible subsets from a objects increases exponentially at the rate ka. One algorithm that tries to solve this problem is CLARA (Clustering LARge Applications). CLARA is a method based on PAM that attempts to deal with large dataset applications. CLARA uses the PAM algorithm to cluster a sample from a set of objects into k subsets.[ After this first step, each object not belonging to the initial sample is allocated to the nearest representative object, and a measure of clustering of the entire dataset is obtained. This measure is compared with n other measures obtained from the application of the algorithm in n different initial samples. The best clustering obtained from the different samples is the one selected by the algorithm.
4.1.4 CLARANS(Clustering Large Applications Based on Randomized Search)
It combines the sampling techniques with PAM. The clustering process can be presented as searching a graph where every node is a potential solution, that is, a set of k
medoids. The clustering obtained after replacing a medoid is called the neighbour of the current clustering. CLARANS selects a node and compares it to a user-defined number of their neighbours searching for a local minimum. If a better neighbour is found (i.e., having lower-square error),CLARANS moves to the neighbour’s node and the process start again; otherwise the current clustering is a local optimum. If the local optimum is found, CLARANS starts with a new randomly selected node in search for a new local optimum.
Shraddha K.Popat et al, / (IJCSIT) International Journal of Computer Science and Information Technologies, Vol. 5 (1) , 2014, 805-812
TABLE I.STUDYOFPARTITIONALCLUSTERINGALGORITHM
Name Cluster Shape Outlier/Noise Complexity Results
K-means Spherical Less robust to outliers Ο(n) Centre of clusters
PAM Arbitrary More robust to outliers than K-means Ο(k(n-k)2) Mediods of clusters
CLARA Arbitrary Sensitive to outliers Ο(k(40+k)2)+k(n-k)) Mediods of clusters
CLARANS Arbitrary Handles outliers Ο(kn2) Mediods of clusters
Summary of Partitional Clustering Algorithm
The choice of clustering algorithm depends on various factors viz- type of data available, clustering criterion, complexity, outlier detection and on the particular purpose and applications. The partitional clustering algorithm work well with spherical shaped clusters. K-mediods (PAM) is more robust than K-means in the presence of noise and outliers. K-mediods works well with small dataset and does not scale well for large dataset. For handling large data set, a more suitable sampling method called CLARA is used. CLARANS is considered to be most effective method among all as it handles outlier detection very well.
B Density Based Clustering
Density-based clustering algorithms are devised to create arbitrary-shaped clusters. In this approach, a cluster is regarded as a region in which the density of data objects exceeds a threshold. DBSCAN and SSN RDBC are typical algorithms of this type.[9]
Figure 4.Density Based Clustering[23]
4.2.1 DBSCAN
The DBSCAN algorithm was first introduced by Ester, and it depends on a density-based notion of clusters. Clusters are identified by looking at the density of points. Regions with a high density of points indicate the existence of clusters whereas regions with a low density of points indicate clusters of noise or outliers. This algorithm is suited to deal with large datasets, with noise, and is able to identify clusters with different sizes and shapes. This algorithm needs three input parameters: -
• k, the neighbour list size
• Eps, the radius that delimitate the neighbourhood area of a point (Eps neighbourhood)
• MinPts, the minimum number of points that must exist in the Eps-neighbourhood.
The clustering process is based on the classification of the points in the dataset as core points, border points and noise
points, and on the use of density relations between points to form the clusters. For each point of the dataset the algorithm identifies the directly density-reachable points using the Eps threshold provided by the user and classifies the points into core or border points. The most important point to note about this algorithm is that DBSCAN does not deal very well with clusters of different densities.
Figure 5.DBSCAN Clustering[23]
4.2.2 RDBC
RDBC an extended form of DBSCAN, is an algorithm to group neighboring objects of the database into clusters. Moreover, it does not require a predetermined cluster number to operate. The algorithm is based on DBSCAN and is applicable to any database containing data from a metric space. algorithm calculates a density measure based on the distance metrics that is computed from the data set according to the distance definition. It then selects the points that are dense enough in the space of distance metrics and constructs an abstract space based on these point[16]. It does this recursively until no more abstraction space can be built because it can change the parameters intelligently during the recursively process, In RDBC, it calls DBSCAN with different distance thresholds ε and density threshold MinPts, and returns the result when the number of clusters is appropriate. The key difference between RDBC and DBSCAN is that in RDBC, the identification of core points are performed separately from that of clustering each individual data points. RDBC is improvement over DBSCAN and yields superior results.
4.2.3 DENCLUE
It is a density clustering approach that models the overall density of a set of points as the sum of influence functions associated with each point. DENCLUE is based on kernel density estimation. The goal of kernel density estimation is to describe the distribution of data by a function. For kernel density estimation, the contribution of each point to the overall density function is expressed by an influence (kernel) function. The overall density is then merely the sum of the influence functions associated with each point. The
Shraddha K.Popat et al, / (IJCSIT) International Journal of Computer Science and Information Technologies, Vol. 5 (1) , 2014, 805-812
resulting overall density functions will have local density maxima, and can be used to define clusters. the kernel function is symmetric and its value decreases as the distance from the point increases. Normally the Guassian function is used as the kernel function
Fig6.(a) :Kernel[23] Fig(b):set of points[23] Fig(c): density function[23]
4.2.4 OPTICS
DBCAN, the partitioning density-based clustering algorithm can only identify a ―flat clustering, the newer algorithm OPTICS computes an ordering of the points augmented by additional information, i.e. the reachability distance, representing the intrinsic hierarchical (nested) cluster structure. cluster ordering, is displayed by the so-called reachability plots which are 2D-plots generated as follows: the clustered objects are ordered along the x-axis according to the cluster ordering computed by OPTICS [14] and the reachabilities assigned to each object are plotted along the abscissa. objects having a small reachability value are closer and thus more similar to their predecessor objects than objects having a higher reachability value.
RECHABILITY DISTANCE
Let p and o be objects from a database DB, let Nε(o) be the ε-neighborhood of o, let dist(o, p) be the distance between o
and p, and let MinPts be a natural number. Then the
reachabilitydistance of p w.r.t. o as shown in fig. , denoted as reachability-dist ε, MinPts(p, o), is defined as max(core-dist ε, MinPts(o), dist(o, p)).[14]
Figure 8: core distance(o), Rechabiltiy Distances r(p1,o), r(p2,o) for minPts=4[14]
The OPTICS algorithm creates an ordering of a database, along with a reachability-value for each object and it is called as seedlist. Initially, the seedlist is empty and all points are marked as not-done.[14]
TABLE II. STUDY OF DENSITY CLUSTERING
ALGORITHM
NAME DATATYP
E
NOIS E
COMPLEXIT Y
DBSCAN Numerical yes Ο(nlogn) OPTICS Numerical yes Ο(nlogn) DENCLU
E Numerical yes Ο(n2) RDBC Numerical yes Ο(n2)
V.MODEL SELECTION CRITERIA
There are various problems with the model based approach to clustering such as the selection of number of clusters, selection of number of components and assessment of a given model. There is a usual trade-off in model selection problems, as many components can overfit the data or too few components may not be fexible enough to approximate the model. Thus there is advancement in the model selection criteria methods to address the above issues. Basically there are two selection model: deterministic and stochastic. Deterministic methods are those which generally obtain the clustering solution based on the set of K-parameters and often are non-deterministic in nature.
5.1 Hierarchical Clustering
Hierarchical clustering algorithms divide or merge a dataset into a sequence of nested partitions. The hierarchy of the nested partitions can be agglomerative(bottom-up) or divisive(top-down). In the agglomerative method, clustering starts with each single object in a single cluster and it continues to cluster the closest pairs of clusters until all the objects are together in just one cluster. Divisive hierarchical clustering, on the other hand, starts with all objects in a single cluster and keeps splitting larger clusters into smaller ones until all objects are separated into unit clusters[5][11]. Both the hierarchical methods show the natural way of representing clusters, called as dendrogram. Examples for this algorithms are ROCK, BIRCH (Balance Iterative Reducing and Clustering using Hierarchies), CURE (Cluster Using REpresentatives).
Figure 9: Hierarchical Clustering.[23]
A cluster hierarchy can be interpreted as a standard binary tree where root represents all the sets of data objects to be clustered which forms the topmost level of the hierarchy (level0). At each level, the nodes which are the subset of entire dataset corresponds to the cluster. The entries in each of these clusters can be determined by traversing the tree from the current cluster node to the base singleton which are leaves of the tree. This cluster hierarchy
Shraddha K.Popat et al, / (IJCSIT) International Journal of Computer Science and Information Technologies, Vol. 5 (1) , 2014, 805-812
is called as dendrogram. The basic advantage of having hierarchical clustering method is that it allows cutting the hierarchy at the desired level and this feature makes it significantly different from other clustering algorithm. There are also different agglomerative clustering algorithms which use different similarity measures and thus based on that, different agglomerative clustering algorithms are: Single linkage, Complete linkage, Group average linkage, Centriod linkage, Ward’s criterion.
5.1.1Agglomerative Hierarchical Clustering
Each object initially represents a cluster of its own. Then clusters are successively merged until the desired cluster structure is obtained. one of the most widely used algorithms is agglomerative algorithms In the general case, the complexity of agglomerative clustering is Ο(n3), which makes them too slow for large data sets. Divisive clustering with an exhaustive search is Ο(2n) which is even worse and thus agglomerative hierarchical clustering are better than divisive clustering. The merging or division of clusters is performed according to some similarity measure, and thus hierarchical clustering methods could be further divided according to the manner that the similarity measure is calculated. These are:
5.1.2Single-link clustering
It is also called as nearest neighbor method, that considers the distance between two clusters to be equal to the shortest distance from any member of one cluster to any member of the other cluster. If the data consist of similarities, the similarity between a pair of clusters is considered to be equal to the greatest similarity from any member of one cluster to any member of the other cluster.[11]
Figure 10: single linkage[23]
5.1.3Complete-link clustering
It is also called as furthest neighbor method, that consider the distance between two clusters to be equal to the longest distance from any member of one cluster to any member of the other cluster[11].
Figure 11: Complete linkage[23]
5.1.4 Average-link clustering
It is also called as minimum variance method, that consider the distance between two clusters to be equal to the average distance from any member of one cluster to any member of the other cluster[11].
Figure 12: Average Linkage[23]
5.1.5Centriod Clustering
The centroid method uses the controid (center of the group of cases) to determine the average distance between clusters of cases[11].
Figure 13: Centroid Clustering[23]
I-Agglomerative Hierarchical Algorithm
STEP 1 - Start by assigning each item to a cluster, so that if you have N items, you now have N clusters, each containing just one item. Let the distances (similarities) between the clusters the same as the distances (similarities) between the items they contain.
STEP 2 - Find the closest (most similar) pair of clusters and merge them into a single cluster, so that now you have one cluster less with the help oh tf - itf.
STEP 3 - Compute distances (similarities) between the new cluster and each of the old clusters.
STEP 4 - Repeat steps 2 and 3 until all items are clustered into a single cluster of size N.
II-Advantages
• Capable of identifying nested clusters
• They are flexible - clustershape parameters can be tuned to suit the application at hand.
• They are suitable for automation.
• Can optionally combine the advantages of
hierarchical clustering and partitioning around
medoids, giving better detection of outliers. • Reducing effect of initial values of cluster on the
clustering results.
• OLR-based clustering algorithm considers more the distribution of data rather than only the distance between data points.
Shraddha K.Popat et al, / (IJCSIT) International Journal of Computer Science and Information Technologies, Vol. 5 (1) , 2014, 805-812
• The method can shorten the computing time and reduce the space complexity, improve the results of clustering
III-Similarity measures
Before clustering, a similarity/distance measure must be determined. The measure reflects the degree of closeness or separation of the target objects. choosing an appropriate similarity measure, especially for a particular type of clustering algorithms is crucial for cluster analysis,. For example, the density-based clustering algorithms, such as DBScan, rely heavily on the similarity computation[10]. Density-based clustering finds clusters as dense areas in the data set, and the density of a given point is in turn estimated as the closeness of the corresponding data object to its neighboring objects. In general, similarity/distance measures map the distance or similarity between the symbolic description of two objects into a single numeric value, which depends on two factors— the properties of the two objects and the measure itself. There are various distance measure, which have comparable effectiveness for the partitional text document clustering task[1]. Pearson correlation coefficient and the averaged. KLD divergence measures are slightly better and more balanced in that their resulting clustering. The Jaccard and Pearson coefficient measures find more coherent clusters. We can also investigate the effectiveness of the similarity measures with the multi-view point based cluster, which helps to cluster the documents based on different views and which yields effective clustering results.
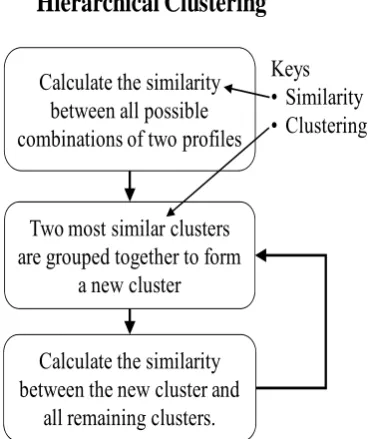
VI.PROPOSED ANALYTICAL MODEL
A hierarchical clustering algorithm creates a hierarchical decomposition of the given set of data objects. Depending on the decomposition approach, hierarchical algorithms are classified as agglomerative (merging) or divisive (splitting). The agglomerative approach starts with each data point in a separate cluster or with a certain large number of clusters. Each step of this approach merges the two clusters that are the most similar. Thus after each step, the total number of clusters decreases. This is repeated until the desired number of clusters is obtained or only one cluster remains. By contrast, the divisive approach starts with all data objects in the same cluster. In each step, one cluster is split into smaller clusters, until a termination condition holds. Agglomerative algorithms are more widely used in practice. Thus the similarities between clusters are more researched. If the data consist of similarities, consider the similarity between one cluster and another cluster to be equal to the greatest similarity from any member of one cluster to any member of the other cluster. In complete-linkage clustering (also called the diameter or maximum method), consider the distance between one cluster and another cluster to be equal to the greatest distance from any member of one cluster to any member of the other cluster.In average-linkage clustering, consider the distance between one cluster and another cluster to be equal to the average distance. This kind of hierarchical clustering is called agglomerative because it merges clusters iteratively.
Calculate the similarity
between all possible
combinations of two profiles
Two most similar clusters
are grouped together to form
a new cluster
Calculate the similarity
between the new cluster and
all remaining clusters.
Hierarchical Clustering
Keys
• Similarity
• Clustering
Figure 14 Hierarchical Clustering
Shraddha K.Popat et al, / (IJCSIT) International Journal of Computer Science and Information Technologies, Vol. 5 (1) , 2014, 805-812
VII. SUMMARY TABLE FOR COMPARISON OF CLUSTERING TECHNIQUES
Name Algorithm Key –idea Type of
Data
Advantages
Disadvantages
Partitional
K-means Mean Centroid
numerical
-Simple
-Most popular
-Sensitive to outliers
-Centroids not meaningful in most problems PAM
Mediod -centriod
robust to outliers Cluster should be pre -determined
CLARA Applicable for large data set Sensitive to outliers CLARANS Handles outliers effectively High cost
Density Based
DBSCAN Fixed sixe
numerical
-Resistant to noise
-Can handle clusters of various shapes and sizes.
-Cannot handle varying densities
OPTICS
Variable size
-Good for data set with large
amount of noise -Faster in computation
-Needs large no.of
parameters
DENCLUE -Solid mathematical foundation -parameters Needs large no.of
RDBC
-More effective in discovering varied shape clusters
-Handles noise effectively
-Cost Varying
Hierarchical agglomerative
CURE Partition samples Numerical
-Robust to outliers
-Appropriate for handling large dataset
Ignores information about inter-connectivity of objects
BIRCH multidimemsional Numerical --scales linearly suitable for large databases
-Handles only numeric
data
-sensitive to data records
ROCK Notion of links categorical --Appropriate for large dataset Robust space complexity depends on initialization of local heaps
S-link Closest pair of points - it does not need to specify no.of clusters
-Termination condition needs to be satisfied. -Sensitive to outliers
Ave-link Centriod of clusters - It considers all members in cluster rather than single point It produces clusters with same variance.
Com-link Farthest pair of points - Not strongly affected by outliers It has problem with convex shape clusters.
Grid
STING
Multiple grids
Numerical -Allows parallelization and multiresolution
-Does not define appropriate level of granularity
WaveCluster Numerical
- High-quality clusters
- Successful outlier handling -Cost Varying.
CLIQUE Density based grids
-Dimensionality reduction - Scalability
-Insensitive to noise
-Prone to high dimensional clusters
CONCLUSION
Since clustering is applied in many fields, a number of clustering techniques and algorithms have been surveyed that are available in literature. In this paper we presented the main characteristics of various clustering algorithms. Moreover, we discussed the different categories in which algorithms can be classified (i.e., partitional, hierarchical, density-based, grid-based, model based).We concluded the discussion on clustering algorithms by a comparative study with pros and cons of each category. We have also discussed the concept of Similarity measures which proves to be the most important criteria for document clustering.
REFERENCES
[1] Khaled M. Hammouda, Mohamed S. Kamel , “Efficient phrase-based document indexing for web document clustering” , IEEE transactions on knowledge and data engineering, October 2004
[2]Clustering with multi-viewpoint based Similarity measure.” IEEE transaction on knowledge and Data Engineering, vol. XX, No. YY 2011.
[3]“Active Clustering: Robust and Efficient Hierarchical Clustering using Adaptively Selected Similarities”, Proceedings of 14th international conference on Artificial Intelligence and Statistics, 2011.
[4]“Hierarchical Clustering”, IEEE trans. on Knowl. and Data Eng., April 2009.
[5]E.M. Voorhees. “Implementing agglomerative hierarchical clustering algorithms for use in document retrieval. Information Processing and Management”, 22(6):465–476, 1986.
Shraddha K.Popat et al, / (IJCSIT) International Journal of Computer Science and Information Technologies, Vol. 5 (1) , 2014, 805-812
[6]Sun Da-fei,Chen Guo-li,Liu Wen-ju. The discussion of maximum likehood parameter estimation based on EM algorithm. Journal of HeNan University. 2002,32(4):35~41
[7]Haojun sun, zhihui liu, lingjun kong, “A Document Clustering Method Based On Hierarchical Algorithm With Model Clustering, 22nd international conference on advanced information networking and applications.
[8]Shi zhong, joydeep ghosh, Generative Model-Based Document Clustering: A Comparative Study, The University Of Texas.
[9]T. Soni Madhulatha, “An overview of Clustering Methods”,IOSR Journal of Engineering, Apr.2012, Vol. 2(4) pp: 719-725
[10] Prof. Neha Soni, Dr.Amit Ganatra. “Comparitive Study of Several Clustering Algorithms”, International Journal of Advanced Computer Research,Volume-2,Number-4,Issue-6 December 2012.
[11] Yogita Rani and Dr.Harish Rohil, “A Study of Hierarchical Clustering Algorithm”, International Journal of Information and Computation Technology.ISSN 0974-2239 Volume 3, Number 11 (2013), pp. 1225-123
[12] K.A.V.L.Prasanna and Mr. Vasantha Kumar, “Performance Evaluation of multiview-point based similarity measures for data clustering”, Journal of Global Reasearch in Computer Science, Volume 3, no.11,November 2012.
[13] K.Sathiyakumari, V.Preamsudha , “A Survey on Various Approaches in Document Clustering”, Int. J. Comp. Tech. Appl., Vol 2 (5), 1534-1539
[14] Glory H. Shah, C. K. Bhensdadia, Amit P. Ganatra , “An Empirical Evaluation of Density-Based Clustering Techniques”,International Journal of Soft Computing and Engineering (IJSCE) ISSN: 2231-2307, Volume-2, Issue-1, March 2012
[15] M. Kuchaki Rafsanjani, Z. Asghari Varzaneh, N. Emami Chukanlo, “A survey of hierarchical clustering algorithms”, The Journal Of Mathematics and Computer Science, Vol .5 No.3 (2012) 229-240
[16] K.Rajendra Prasad et. al. “Survey on Clustering Techniques for large datasets for Efficient Graph Structures”, International Journal of Engineering Science and Technology, Vol. 2 (7), 2010, 2707-2714 [17] Amandeep Kaur Mann and Navneet Kaur, “Survey Paper on
Clustering Techniques”, International Journal of Science, Engineering and Technology Research (IJSETR) Volume 2, Issue 4, April 2013
[18] S. Anitha Elavaras, “A Survey on Partitional Clustering Algorithm”, International Journal of Enterprise Computing and Business Systems, Vol. 1 Issue 1 January 2011.
[19] Ashish Jaiswal, Prof. Nitin Janwe , “Hierarchical Document Clustering: A Review”, 2nd National Conference on Information and Communication Technology (NCICT) 2011 Proceedings published in International Journal of Computer Applications® (IJCA)
[20] R.Saranya, P.Krishnakumari, “Clustering with Multi view point-Based Similarity Measure using NMF”, International Journal of scientific research and management (IJSRM)Volume 1,Issue 6-2013 [21] Anoop Kumar Jain, Prof. Satyam Maheswari, “Survey of Recent
Clustering Techniques in Data Mining, International Journal of Computer Science and Management Research Vol 1 Issue 1 Aug 2012.
[22] Sushreeta Tripathy, Prof.Sarbeswara Hota, “A survey on Partitioning and Parallel Partitioning Clustering Algorithm” , International Conference on Computing and Control Engineering (ICCCE 2012), 12 & 13 April, 2012
[23] Dr.Emmanuel M, Saurabh Khatri, Dr. RameshBabu D R, “A Novel Scheme for Term weighting in text Categorization: Positive Impact Factor”,IEEE International Conferemce on Systems, Man, and Cybernetics,2013
[24] (2013) The Wikipedia website. [Online]. Available: http://en.wikipedia.org/wiki.
Shraddha K.Popat et al, / (IJCSIT) International Journal of Computer Science and Information Technologies, Vol. 5 (1) , 2014, 805-812
![Figure 2.Clustering Process [15]](https://thumb-us.123doks.com/thumbv2/123dok_us/7825005.1296577/1.595.321.538.487.602/figure-clustering-process.webp)
![Figure 5.DBSCAN Clustering[23]](https://thumb-us.123doks.com/thumbv2/123dok_us/7825005.1296577/3.595.326.524.289.403/figure-dbscan-clustering.webp)
![Figure 9: Hierarchical Clustering.[23]](https://thumb-us.123doks.com/thumbv2/123dok_us/7825005.1296577/4.595.309.541.529.653/figure-hierarchical-clustering.webp)
![Figure 12: Average Linkage[23]](https://thumb-us.123doks.com/thumbv2/123dok_us/7825005.1296577/5.595.85.256.642.756/figure-average-linkage.webp)