IJEDR1504097
International Journal of Engineering Development and Research (www.ijedr.org)582
Reducing Rejection Rate in Small Scale Machining
Unit Using 7 Quality Control Tools - A Review
1
Shyam H. Bambharoliya,
2Hemant R. Thakkar
1M.E. (Scholar) Industrial Engineering, 2Associate Professor, 1Department of Mechanical Engineering,
1G. H. Patel College of Engineering & Technology, V. V. Nagar, Gujarat, India
_______________________________________________________________________________________
Abstract- Increasing productivity and profitability are main objectives of any organization. Many tools and techniques are used to reduce rejections and defects of product. Most of the rejections and defects are occurred due to improper control of quality of product. So use of 7 Quality control tools is best way to reduce rejections and defects of product after analyzing of manufacturing process. Another advantage is increasing customer satisfaction by use of 7 Quality control tools in today competitive market. Based on application of these tools will increase the level of standard products which they require as vision of an organization.
Index Terms - PDCA Cycle, Quality Gurus, Quality Management, Seven Quality Control Tools.
________________________________________________________________________________________________________
I. INTRODUCTION
A. Quality: An Overview
According to kaoru Ishikawa, Majority of Quality related problems (Around 95%) are solved by implementation or using of 7 Quality control tools [3]. He also gave useful tool called as Ishikawa diagram or Fishbone diagram or Cause and effect diagram to find probable root causes for given any problem in organization related to quality improvement, productivity, etc. [7]. While as per Joseph M. Juran, he derived Quality triangle such as Quality planning, Quality Improvement and Quality control.
B. Quality: Historical Background
Table I: History of Quality
Early 1950 Quality management practices developed rapidly in Japanese plants [10]. Late 1950 Japan’s imports into the USA and Europe increased rapidly [10].
1969 First international conference on quality control, sponsored by Japan, America and Europe [10]. 1979 Quality systems had been published by Britain as The British Standard (BS) 5750[10]. 1983 National Quality Campaign was launched with ISO 9000[10].
C. Quality Gurus: Contribution
Table II: Contribution of Gurus
Edwards Deming PDCA Cycle[11]
Joseph Juran Quality Trilogy[12]
Armand Feigenbaum Total Quality Control[11]
Kaoru Ishikawa 7 Quality Control Tools[11]
Genichi Taguchi Quality Loss Function, QFD[12]
Shigeo Shingo SMED, Poka-Yoke[12]
Philip Crosby Zero Defect[13]
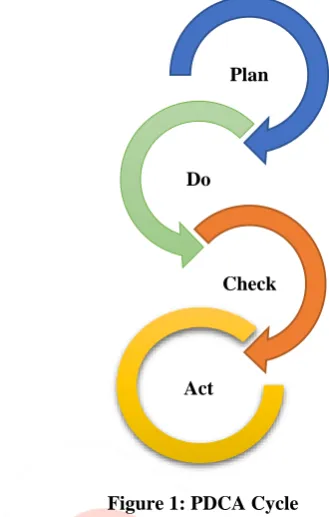
D. PDCA Cycle
IJEDR1504097
International Journal of Engineering Development and Research (www.ijedr.org)583
Figure 1: PDCA CycleFor use of 7 Quality control tools is stepwise procedure with staring of product development to final product delivery to the customer. So it is very useful in every stage of production and service.
E. Seven Quality Control Tools
There are 7 basic quality control tools as following: Check sheet
Histogram Pareto chart
Cause and effect diagram Control chart
Flow chart
Scatter / Dot diagram
Check sheet: It is one of the starting tool for implementation of these quality tools. It is data collection type tools which will collect all data related to number of rejection or number of defects etc.
Histogram: It is second stage after collecting data by check sheet. It is graphical representation of collected data so it is data presentation type tool.
Pareto chart: After defining data in graphical form it is easy to focus on particular defect which is occurred with high frequency. So as per Pareto chart it will provide major problem which will reduce 80% of quality related problem so it is called as data analysis type tool.
Cause and effect diagram: After detecting major problem finding main causes which will create this major problem by considering factors like man, machine, material, environment and process etc. it is also known as Ishikawa diagram or fish bone diagram and it is data interpretation type tool.
Control chart: After finding root causes of that problem or defect particular solution is taken. After providing solution if rejection rate is controlled or not is measured by control charts. So this tools is used for controlling data for any process or rejection of any product.
Flow chart: It is data presentation type tool for providing graphical presentation of overall structure of any process or organization hierarchy.
Scatter / Dot diagram: To find relation between two variable, this tools is very useful as to find positive or negative relation.
II. OBJECTIVE OF STUDY
To increase productivity and profitability in an organization. To reduce rejection rate of product.
To reduce rework and scrap of product.
To increase moral of internal customer of an organization. To provide better solution for process improvement. To get standardization for product using 7 QC tools.
To increase number of customer as getting high level of satisfaction of them including features like good design, value or price of product etc.
Plan
Do
Check
IJEDR1504097
International Journal of Engineering Development and Research (www.ijedr.org)584
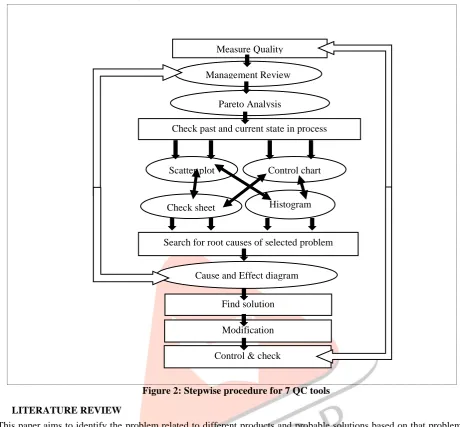
III. IMPLEMENTATION OF 7 QC TOOLS
Figure 2: Stepwise procedure for 7 QC tools
IV. LITERATURE REVIEW
This paper aims to identify the problem related to different products and probable solutions based on that problem. Total 9 Research papers are taken from different reputed international journals after reviewing that papers with probable solutions and benefits which are mentioned below.
Table III:Referred research papers
Sr. No. Title Journal, Year Manufacturing Firm
1
Quality control and statistical techniques used to Improve productivity and to reduce rejections due to Casting defects: a review
International journal of research in advent technology
Vol.3, no 4
Rear-Cross-Over brake disc.(Patil & Sutar, 2015)
2
Application of quality control tools in taper shank drills manufacturing industry: a case study
Int. Journal of engineering research and applications Vol. 4, issue 2
Taper Shank Drills.(Patel, Shah,et.al, 2014)
3
Reduction of rejected components in an automobile assembly line using Quality tools
European journal of applied engineering and
Scientific research
Canopy in automobile.(Jha, Tyagi, & Gupta, 2013)
4
A case study of the effectiveness of rolling process to Manufacture the strip of leaf spring
International journal of materials, mechanics and manufacturing
Vol. 1, no. 1
Strip of Leaf Spring.(P. S. Chauhan & Agrawal, 2013)
5 Minimization of defects in the sewing section of apparel industry
Research journal of management sciences
Vol. 2(8), 10-15, august
Apparel products.(Islam, Khan,et.al,2013)
6
Analysis of the sand drop defect to reduce the rejection level of cylinder block Casting-a case study
International journal of engineering research & technology Vol. 2 issue 9, september – 2013
Cylinder Block in automobile. (Nerle & Shinde, 2013) Measure Quality
Management Review
Pareto Analysis
Check past and current state in process
Check sheet Histogram
Control chart Scatter plot
Search for root causes of selected problem
Cause and Effect diagram
IJEDR1504097
International Journal of Engineering Development and Research (www.ijedr.org)585
7Optimization of cost by using 7 qc tools
International journal of engineering studies
Volume 1, number 3 (2009)
Cylinder Valve
Head.(Engineering, n.d.)
8
Investigation and analysis of cold shut casting Defect and defect reduction by using 7 quality Control tools
International journal of advanced engineering research and studies
Cylinder Block in automobile. (Mandavgade & Jaju, 2009)
9
Improvement of productivity by
application of basic seven quality control tools in manufacturing industry
International journal of advance research in engineering, science & technology
Tapper roller Bearing(C. S. Chauhan, Shah,et.al.
Table IV: Comparison of Tools and Techniques in paper
Tools and Techniques Referred Research Papers
1 2 3 4 5 6 7 8 9
Check sheet √ √ √ √ √ √
Histogram √ √ √ √ √ √ √
Pareto chart √ √ √ √ √ √
Cause and effect diagram √ √ √ √ √ √ √ √
Flow chart √ √ √ √
Control chart √ √ √ √ √
Plot diagram √ √ √
Brainstorming √ √ √ √
PDCA √ √
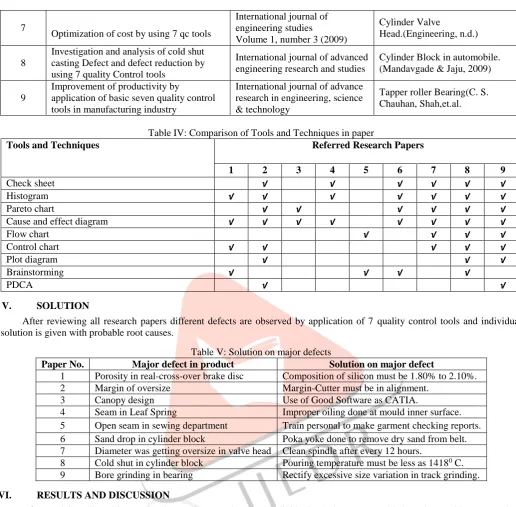
V. SOLUTION
After reviewing all research papers different defects are observed by application of 7 quality control tools and individual solution is given with probable root causes.
Table V: Solution on major defects
Paper No. Major defect in product Solution on major defect
1 Porosity in real-cross-over brake disc Composition of silicon must be 1.80% to 2.10%.
2 Margin of oversize Margin-Cutter must be in alignment.
3 Canopy design Use of Good Software as CATIA.
4 Seam in Leaf Spring Improper oiling done at mould inner surface. 5 Open seam in sewing department Train personal to make garment checking reports. 6 Sand drop in cylinder block Poka yoke done to remove dry sand from belt. 7 Diameter was getting oversize in valve head Clean spindle after every 12 hours.
8 Cold shut in cylinder block Pouring temperature must be less as 14180 C. 9 Bore grinding in bearing Rectify excessive size variation in track grinding.
VI. RESULTS AND DISCUSSION
After studying all problems related to each research papers individual solutions are provided as above table-V. Based on solution on that problem effect on production is changed as increase in productivity or reduction of rejection rates which is provided as below table.
TABLE VI: Results with referred research papers Paper
No. Conclusion of the paper
1 The pouring time should be maintained at 4-6 seconds to reduce defects.
2 Rejection of drill is 5.036% which is reduced by concentration on margin over size and grinding defects. 3 Estimated savings will 520200/year by reducing rejection of canopy.
4 Major defect in strip of leaf spring is seam with around 20% with main cause of improper surface finishing. 5 In finishing, stitching came down to approximately 8% from 16% as earlier, uncut thread came down to
approximately 10% from 22% as earlier.
6 Rejection percentage of cyl. Block due to sand drop and rejection level from 37.17% to 16.3% is reduced. 7 Saving is done around Rs 12,677.57/ year after solving the problem related to cylinder head diameter oversized. 8 The major Cold shut defect was reduced by up to 50%. The cold shut was reduced to 6.6% from 12.3%.
IJEDR1504097
International Journal of Engineering Development and Research (www.ijedr.org)586
VII. CONCLUSION
From the review of above mentioned research articles, following conclusions are derived.
7 Quality control tools are very simple and easy to use for all majority industries.
Quality improvement can be made by reducing rework and rejection rate using 7 Quality control tools.
Reduction in rejection is indirectly improving productivity and profitability of the organization.
7 Quality control tools have shown better results in quality improvement as referred many case studies. REFERENCES[01] Chauhan, C. S., Shah, S. C., & Bhatagalikar, S. P. (2014). Improvement of Productivity by application of Basic seven Quality control Tools in Machine Wise Rejaction - July ’ 2013, 15–19.
[02] Chauhan, P. S., & Agrawal, C. M. (2013). A Case Study of the Effectiveness of Rolling Process to Manufacture the Strip of Leaf Spring. International Journal of Materials, Mechanics and Manufacturing, 1(1), 71–75. http://doi.org/10.7763/IJMMM.2013.V1.15
[03] Engineering, M. (n.d.). Investigation and Analysis of Cold Shut Casting Defect and Defect Reduction By Using 7 Quality, 7–9.
[04] Islam, M., Khan, A. M., & Khan, M. R. (2013). Minimization of Defects in the Sewing Section of Apparel Industry, 2(8), 10–15.
[05] Jha, M., Tyagi, R. K., & Gupta, G. (2013). Reduction of rejected components in an automobile assembly line using quality tools, 2(3), 13–17.
[06] Mandavgade, N. K., & Jaju, S. B. (2009). Optimization of Cost by Using 7 QC Tools, 1(3), 149–160.
[07] Nerle, V., & Shinde, S. (2013). Analysis of the Sand Drop Defect to Reduce the Rejection Level of Cylinder Block Casting-A Case Study, 2(9), 2183–2188.
[08] Patel, P. J., Shah, S. C., & Makwana, S. (2014). Application of Quality Control Tools in Taper Shank Drills Manufacturing Industry : A Case Study, 4(2), 129–134.
[09] Patil, V., & Sutar, M. (2015). Quality control and Statistical Techniques used to improve Productivity and to reduce Rejections due to Casting Defects : A Review, 3(4), 71–78.
[10] http://www.businessballs.com/dtiresources/quality_management_history.pdf
[11] http://webarchive.nationalarchives.gov.uk/20050302214821/http:/www3.dti.gov.uk/quality/pdfs/sections/Gurus.pdf [12] http://asq.org/qualitypress/display/item/?item=P1397&utm_source=blog&utm_medium=link&utm_campaign=communi
cations_blog_1397
![Table I: History of Quality Quality management practices developed rapidly in Japanese plants [10]](https://thumb-us.123doks.com/thumbv2/123dok_us/8340498.1381522/1.595.36.533.342.605/history-quality-quality-management-practices-developed-rapidly-japanese.webp)