Customer Satisfaction
in the Metropolitan
Ambulance Service
by
Scott Ian Stewart,
BSc, GradDipEd, AssocDipHealthSci
Victoria Graduate School of Business, Faculty of Business and Law
August 2001
This thesis is submitted in fulfilment of the requirements for the Degree of Master of Business,
Declaration
I certify that this thesis contains no material that has been submitted for the award of
any other degree or diploma in any institute, college or university, and that, to the best
of my knowledge and belief, it contains no material previously published or written by
another person, except where due reference is made in the text.
Permission to Copy
I hereby give permission to the staff of the University Library and to the staff and
students of Victoria University of Technology to copy this thesis in whole or part,
subject to normal conditions of acknowledgment.
Acknowledgments
I wish to acknowledge the support of the following people who without their assistance
this research would not be possible. Dr. George Wittingslow and Dr. Nick Billington
for their guidance and support, Sanjib Roy for making the customer database available
and giving the support of Metropolitan Ambulance Service and Kerrie Stewart for her
List of Tables
Table 1 Comparison of issues measured by Australian ambulance satisfaction studies 37
Table 2 Research study groupings...66
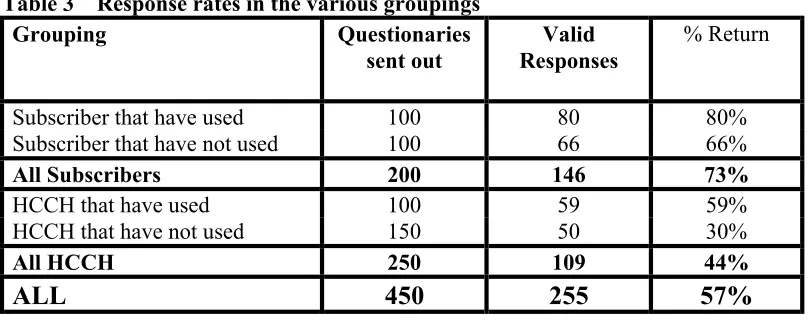
Table 3 Response rates in the various groupings ... 74
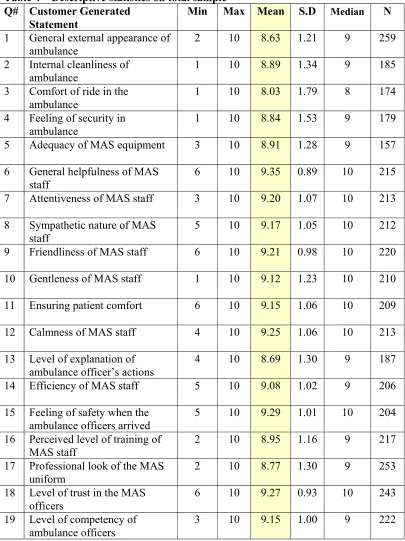
Table 4 Descriptive statistics on total sample ... 79
Table 5 Subscribers compared to health care card holders (HCCH)... 86
Table 6 Subscribers that have used the MAS compared with those that have not used the MAS... 88
Table 7 Health care card holders (HCCH) that have used the MAS compared to those that have not used the MAS... 89
Table 8 Respondents that have never used MAS compared to those that have used once or twice and those that have more than twice... 90
Table 9 t-tests on outcome variables ... 92
Table 10 ANOVA’s on satisfaction and outcome variables ... 94
List of Figures
Figure 1 Complaints to MAS for the 12-month period April 1999- March 2000 ...40
Figure 2 General Structure of PLSM Model...62
Figure 3 Management’s theoretical model of customer satisfaction in the MAS...69
Figure 4 Preliminary model of customer satisfaction as seen by the customers of the MAS ...72
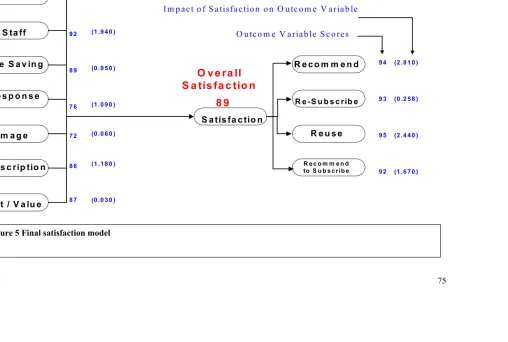
Figure 5 Final satisfaction model...76
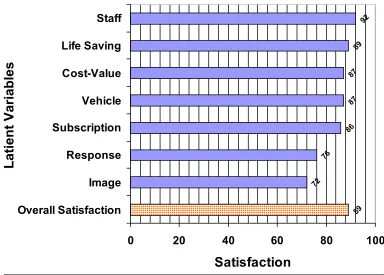
Figure 6 Customer satisfaction with latent variables and overall satisfaction...84
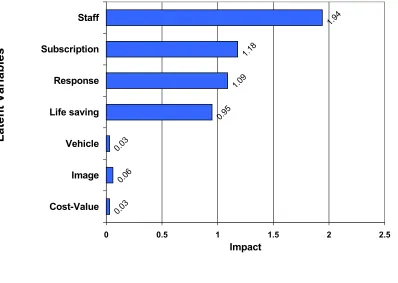
Figure 7 Latent variable impact scores ...85
Figure 8 Satisfaction impact matrix ...87
Abstract
The field of customer satisfaction is complex and lacks clarity. Any technique that can
bring order and predicability to the field is keenly sought. The partial least square
methodology (PLSM) is a new means of modelling and predicting future outcomes.
This research uses the partial least square modelling methodology to investigate and
model the satisfaction of users of the Metropolitan Ambulance Service, Melbourne
(MAS). The theories of Customer Satisfaction were reviewed then a definition of the
concept established. The current state of the MAS was briefly discussed and the PLSM
methodology was defined. Data collected from the MAS customer population was
analysed by the PLSM method and by traditional statistical methods for comparative
purposes.
The results of the research demonstrated that the PLS methodology can be successfully
applied to the field of satisfaction measurement of the ambulance service customer.
Whilst uniquely modelling the determinants of customer satisfaction, it agreed with
work by earlier researchers that particular aspects of staff behaviour were very
important for high levels of customer satisfaction in the service industries.
The model predicted that changes in the satisfaction rating of the staff variable would
have a significant effect on overall satisfaction and critical consequential outcomes such
as reuse and re-subscription. It also predicted that the overall model of customer
An unexpected finding was that perceived medical ability was strongly linked to the
paramedic’s professional appearance.
Implications of the finding are that MAS should pay close attention in the design and
maintenance of the paramedic uniform. The relationship between a paramedic’s
professional appearance and their medical ability as perceived by a patient should be
emphasised during training and professional development days. The very high
importance of staff issues such as competence, friendliness, calmness and
trustworthiness in regard to customer satisfaction reaffirms MAS attention and
awareness of the matter.
The research needs to been repeated within MAS to give a trend over time and a
measure of the effectiveness of changes. To show that the methodology is widely
Table of Contents
DECLARATION I
PERMISSION TO COPY II
ACKNOWLEDGMENTS III
LIST OF TABLES IV
LIST OF FIGURES V
ABSTRACT VI
TABLE OF CONTENTS VIII
1. INTRODUCTION 1
1.1 Aims 1
1.2 Satisfaction of ambulance service customers 2
1.3 The MAS 5
2. LITERATURE REVIEW: CUSTOMER SATISFACTION 14
2.1 Definition of Customer Satisfaction 14 2.2 The Nature of Customer Satisfaction 19 2.3 Concepts of Satisfaction Performance 22 2.4 Measuring Customer Satisfaction 25 2.5 Medical Care Satisfaction Literature 30 2.6 Ambulance Customer Satisfaction Literature 36
2.7 Conclusion 44
3. MEASURING CUSTOMER SATISFACTION 45
3.1 Introduction 45
3.3 Second Generation Modelling 46 3.4 Conceptual Framework - Defining a Model's Components 58
4. METHODS 62
4.1 Introduction 62
4.2 Parameters used in the study 63 4.3 Data Collection Methods 66
5. RESULTS 74
5.1 Response Rates 74
5.2 Final Model with Values 74 5.3 Descriptive Statistics on Total Sample 79 5.4 Quality Component Scores -Satisfaction and Impact 81 5.5 Satisfaction for Various Subgroups 86 5.6
t
- test Results on Satisfaction and Outcomes 92 5.7 ANOVA’s on Satisfaction and Outcome Variables 946. DISCUSSION 96
6.1 Conventional Statistics Results 96 6.2 Partial Least Square Results 99 6.3 Comparison with other Medical Satisfaction Studies 99 6.4 Latent Variables and Impacts 100 6.5 Differences between Groups 105 6.6 Comparison of the PLSM and other Methods 107 6.7 Acknowledged Weaknesses of the Study. 109 6.8 Proposed MAS use of findings 110
6.9 Conclusion 111
7. BIBLIOGRAPHY 113
1. Introduction
This thesis will test the appropriateness of a methodology to investigate and model the
satisfaction of users of an ambulance service. Firstly, there will be a review of the
theories of customer satisfaction then a definition of the concept will be established to
be used in the thesis. The methodology to be applied will be defined. The organisation,
which is the subject of this study, is the Metropolitan Ambulance Service, Melbourne
(MAS). The current state of the MAS will be briefly discussed. Data collected from
the MAS customer population will then be analysed by the selected method and by
traditional statistical methods for comparative purposes.
In this chapter, the issues to be studied will be outlined to give a basis for the research
and discussions in later chapters.
1.1 Aims
This thesis aims to:
• Identify the drivers of satisfaction with an ambulance service,
• Measure the relative satisfaction with and importance of those drivers,
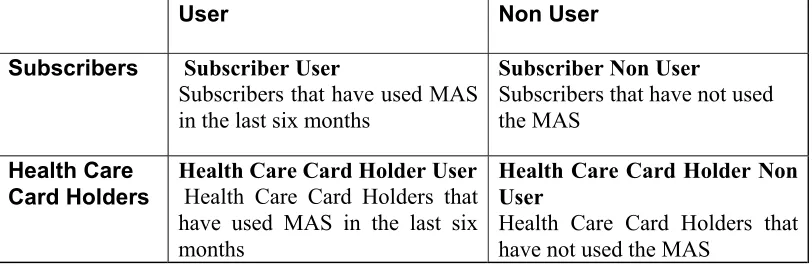
• Determine whether the Subscribers and the Health Care Card Holders have differing satisfaction models and values,
• Determine which areas for improvement within MAS offer the greatest potential return on investment,
• Benchmark the MAS’s level of customer satisfaction against other organisations.
1.2 Satisfaction of ambulance service customers
There is a sizeable body of research on the medical aspects of pre-hospital care and on
the area of customer satisfaction but few studies have been reported on customer
satisfaction of users of an ambulance service. A review of the available literature found
only one published study (Fultz, Coyle and Reynolds, 1998) examining satisfaction of customers of an ambulance service. Fultz, Coyle and Reynolds (1998) investigated the
satisfaction of patients transported by an Air Ambulance Service. A further three
unpublished studies, were uncovered including one which measured the customer
satisfaction with the call taking process that initiates the MAS emergency response
(Patterson, 1996; NWR–ASV, 1999; Dale, 2000). None of these studies, however,
considered the service delivery and subscription aspects of an ambulance service.
The above studies did not model the satisfaction of ambulance users or attempt to make
predictions regarding effects of changes.
It is proposed in this thesis that a suitable methodology for measuring the satisfaction of
customers of an ambulance service would:
• Identify the drivers of satisfaction and rate them in terms of performance and importance,
The methodology should also be able to establish if the various segments of the
customer base have varied expectations of the ambulance service,
• Finally the methodology should be able to link the nebulous concept of satisfaction with tangible, measurable acts such as use, recommendation and repurchase,
• The ability to validly benchmark the results against other organisations would be an additional benefit.
1.2.1 Satisfying patients enhances service quality
Providing the service that the customer wants is the best course of action for
organisations, according to the World Quality Movement(1997), the world peak quality
body. MAS’s Ambulance Paramedics receive three years medical training at university
and in the field, before they are qualified. The elite mobile intensive care ambulance
paramedics undergo a further twelve months training. Their medical care and skills
levels are thought to be of world standard by MAS and the Victorian State Government.
But as Fitch (1989, p. 9) states, “Patients can receive excellent clinical care and at the same time be mistreated”. Paramedics should care for people, not just medical problems. If an Ambulance Service is committed to excellence then they would need to
ask, “what can we do for our patients above and beyond excellent medical treatment?” The non-medical aspects of the interaction can be very important to a patient and their
family. It can be argued that what really matters to the patient are the things that MAS
should be doing. In this sense, a quality service as defined by the customer, is one that
Lately quality has been defined as customer satisfaction. Companies such as General
Electric and Motorola have been moving away from the ISO 9000 series measures to
one using customer satisfaction. The Australian Wider Quality Movement in their
report, Quality, Productivity and Competitiveness (1997) stated, “Quality is what the customer believes it is”. On 5th May 1997, the World Quality Movement defined customer satisfaction as quality (1997). Fornell (1995) has shown that customer
satisfaction guided changes to an organisation have shown a competitive advantage
demonstrated by increased market share and profit margin.
Internationally quality management schemes seem not to have brought the results first
promised by their supporters. In a survey of more than 200 British firms, only 20%
reported they had found any significant impact as a result of Total Quality Management,
(TQM), (Ittner and Larcker, 1996). Of 500 US companies, almost two-thirds found no
competitive gain in their quality programs (Ittner and Larcker, 1996). TQM had the
effect of focusing employee’s attention on internal processes rather than on external
results (Harari, 1993), effort had been directed toward jumping through internal
bureaucratic hoops and not necessarily adding value to the end user.
1.2.2 Benchmarking
An important part of many quality programs is benchmarking an organisation with other
comparable businesses. MAS is seeking to benchmark its performance against eight
other ambulance services throughout the world (Baragwanath, 1997a). Because of the
between the services, meaningful comparisons may be hard to make for often quoted
benchmarks, such as response times or successful resuscitation from cardiac arrest.
If there were a robust model of customer satisfaction, meaningful comparison could be
made with other ambulance services that do not exactly match MAS in demographics.
Customer satisfaction can be used as an externally rated, inter-industry benchmark; it
can also be used cross sectionally and over time (Fornell et al., 1996). A deficiency of satisfaction scores from other ambulance services would not inhibit a comparison being
made. By using a customer satisfaction methodology, MAS could validly benchmark
its self against other non-ambulance organisations that achieve high levels of
satisfaction.
1.3 The MAS
The Ambulance Service Victoria - Metropolitan Region, trading, as Metropolitan
Ambulance Service, Melbourne, is the subject of this study. MAS is the sole provider
of professional pre-hospital emergency health care for the 3.4 million people living in
Greater Melbourne and the surrounding area. The service is a state government backed
enterprise and its role is enshrined in the Ambulance Services Act, 1986.
Some may argue that the role of an organisation such as MAS is to deliver paramedic
services, not necessarily to make stakeholders happy. However, it is important that
any organisation to survive, even a government-backed monopoly, it must satisfy its
market. To achieve this goal the market must perceive that its needs have been met.
Few would argue that the quality of medical care provided by an ambulance service is
not of paramount importance. The patients, the customers of that service, usually have
little ability or experience to judge the quality of the paramedical medical service
provided. MAS’s data suggests that that the average person only uses the service
between one and two times in their lifetime. The patients therefore tend to judge the
quality of the service as a whole on other non-medical factors (Swan, 1989). Swan
(1989) stated these included, the paramedics conducting themselves in a calm and
reassuring manner, clean ambulances and how well the service performs compared with
preconceptions formed from television and movies. He claimed that it is these
judgments that influence how the customers perceive the organisation.
MAS has a number of stakeholders, including the state government, subscribers and
public. The satisfaction or dissatisfaction of MAS customers can have direct and
indirect effects. For example, a dissatisfied subscriber may chose to not resubscribe.
Levels of satisfaction or dissatisfaction can also place pressure on the state government
who have ultimate control over the MAS.
1.3.1 Paramedical service quality
MAS have in place a Total Quality Assurance Program (Csupor, 1997) consistent with
ISO 9002. MAS’s performance, measured by these criteria, is now tied to funding
accredited to ISO 9002 (Olszac, 1997). MAS has now achieved certification under
AS/NZS ISO 9001:2000 (MAS, 2001). As one of its quality activities under AS/NZS
ISO 9001:2000, MAS is obliged to monitor information on the level of customer
satisfaction and/or dissatisfaction.
In MAS’s Quality Assurance Plan, Csupor (1997, p. 8) alludes to customer satisfaction
by the statement “It is the community, in the broader definition, who will determine whether they have received “Quality Service”. She argued that quality is usually perceived as having three interrelated domains: “Service”, “Care” and “Organisational”.
Csupor (1997, p. 7) stated that Quality Service is “achieving community satisfaction by the service provided”. Unfortunately, how this is measured was not outlined. Quality Care is defined as providing care to acceptable and established standards. Quality Organisation is achieved by fostering a working culture of getting it right first time and a commitment to doing better by participation in a coordinated continuous clinical
quality improvement process (Csupor, 1997).
Whilst adhering to ISO 9002 and AS/NZS ISO 9001:2000 may or may not improve
medical care for the patients, it could be argued that it would not necessarily
1.3.2 Stake holders and public perception
Many groups, the government, subscribers, the media, patients, the public and staff,
evaluate MAS’s performance. The State Government of Victoria, through the
Department of Human Services, provides the bulk of the funds to MAS. They appoint
the Board Of Management and Chief Executive Officer. The MAS is directly
accountable the Department of Human Services and is required to meet performance
targets. The media provides information and helps form opinions for all the above
groups. The members of the fourth estate wield considerable power over public
opinion, particularly those members of the public whose only source of information of
MAS is through the media. Patients are the most obvious of the groups served by
MAS. In some ways, this group is easy to satisfy, if they receive an ambulance in time
and are given the care they expect. The strong emotions however, generally involved in
ambulance work, can colour the perception of the service provided. The patients and
their relatives are usually in a highly emotional state and any deficiency in the care
provided, real or perceived may result in a formal complaint to management, the media,
or the government. This may in turn affect the perception of others. Improved
customer satisfaction would impact in all of these areas and result in improved
community perception of ambulance care (Daly, 1992).
There has been a move toward smaller government expenditure and greater public
accountability by the bodies receiving the funding. The publishing of customer
satisfaction measurement scores would assist in justifying the monies used by MAS.
MAS has a Subscription Scheme. This is analogous to insurance where for an annual
fee the subscriber is entitled to free emergency ambulance treatment and transport. The
MAS Chief Executive Officer stated in the 1996 annual report that the financial
viability of MAS is linked to the well-being of its Subscription Scheme (Olszac, 1996).
The scheme is a major source of income to MAS. Any profit the scheme makes helps to
defray the loss incurred by MAS due to lack of full cost recovery from patient transport
fees (Baragwanath,1997a).
The revenue from subscribers for 1995/96 was almost $28 million representing 34.7%
of its total revenue of $80.6 million (MAS, 1996). This result was profitable as the
members only accounted for 14.8% of the patients transported. The profitability wasn’t
lost on health insurers such as Medibank Private who have provided competition to the
subscription scheme. Over the period, 1994/5 to 1995/6, MAS subscriptions dropped
from 530,385 to 512,028 (MAS, 1996). Almost certainly some of this was due to
defection of members to the health insurers, although recession and negative publicity
during this period may also have had an effect.
MAS needs to focus on keeping existing customers rather than just recruiting new ones.
It costs five times more to acquire a new customer than to keep an existing one
(Djupvik and Eilertsen, 1995). It makes sound commercial sense for MAS to keep
subscribers satisfied. There is a close relationship between customer satisfaction and
customer loyalty (Djupvik and Eilertsen 1995). Satisfied customers buy more, more
often, and are more price tolerant (Marr and Crosby, 1993). A more satisfied customer
base increases their likelihood of resubscribing and hence improves the long-term
A dissatisfied customer may cost MAS more than just one subscription. Research on
bank customers suggests that the average unhappy user will tell sixteen other people of
his experience. By comparison, a happy bank customer will tell an average of eight of
his delight (Goodman et al., 1995).
The average subscriber does not use the MAS in any given year, yet most continue to
pay the annual fee. The reasons behind this need to be explored. The appropriate
customer satisfaction methodology would enable predictions to be made where
improvements in the quality would increase the satisfaction and hence the value of the
MAS subscriber base.
New subscribers must be recruited even if the subscriber base were to be totally
satisfied with MAS. For example, once a person is entitled to income support, the
Federal government issues a Health Care Card, which among other things entitles the
holder to free ambulance transport. Only the most supportive subscribers continue to be
members in these circumstances. To grow the size of the subscriber base still more new
members are needed. The decision to join the subscription scheme also needs to be
1.3.4 Competition from other insurance schemes
During the 1996-97 financial year, 76,800 new members were recruited to the scheme
while 49,500 members left. Some of the loss was due to former subscribers becoming
eligible for free transport, but MAS estimated that around 30 per cent of members who
failed to renew their subscription become members to cheaper insurance schemes.
(Baragwanath, 1997a)
To compete with the other Schemes MAS has to either drop its prices, or increase the
satisfaction of its subscribers and exploit their increased price tolerance.
The accurate measurement of customer satisfaction would enable MAS to better
manage its subscription scheme by better understanding its customers and being able to
predict their propensity to resubscribe.
1.3.5 Preparation for a deregulated emergency ambulance market place
Currently under the Ambulance Services Act 1986, MAS has a legislated monopoly on pre-hospital emergency assessment treatment and transport in the Greater Melbourne
area. Since 1994, sub-contractors to the MAS have handled the bulk of non-emergency
transport between hospitals.
This situation may change. The last conservative state government of Victoria had
water industries have been privatised. Even the Metropolitan Fire Brigade has been
suggested as a potential candidate.
It is possible in the future that the emergency ambulance industry could be subject to
privatisation. A high level of public satisfaction may enable MAS to avoid this
outcome. This could be compared with the Victorian Public Transport Corporation
where poor public perception made it easer for the then government, and more palatable
to the public, to privatise.
If a government did privatise the MAS, and / or other companies competed in the
pre-hospital emergency care market, the MAS would need to all the tools available to it to
compete more effectively. One of most powerful tools is an accurate measurement of
customer satisfaction.
MAS in a possible, future, deregulated market may be compared to Norwegian Telecom
(NT). NT is a former monopoly being steadily opened up to an increasing number of
competitors. This situation called for a market and customer-oriented organisation with
a clear strategy not to lose too many customers. NT in the early 1990’s had little
experience with competition and its success depended on how fast the organisation
became more market orientated (Djupvik and Eilertsen, 1995). NT used customer
satisfaction research to meet the challenge of competition.
If the aims outlined in section 1.1 are to be achieved, a definition of the term and a
chapter the field of customer satisfaction will be discussed, defined, and the appropriate
2. Literature Review: Customer Satisfaction
The field of Customer Satisfaction is large and traverses many academic disciplines. In
this chapter, a review of the published literature upon which this study rests will be
presented. The search for a workable definition of customer satisfaction will be
explored. The concepts regarding the theoretical nature of customer satisfaction will be
investigated and some of the major techniques used to measure it will be discussed.
Lastly, the literature concerning the driving factors for satisfaction regarding medical
care and in particular, ambulance services will be considered.
2.1 Definition of Customer Satisfaction
An analysis of the literature concerned with customer satisfaction in 1992 revealed a
large and ever growing body of research with some 15,000 trade and academic articles,
which had been written on the topic over the previous two decades (Peterson and
Wilson, 1992).
Despite the many studies on customer satisfaction, there appeared to be no overall
agreement over important issues such as concepts, constructs, definitions,
measurements, methodologies and various interrelationships (Yi, 1990; Brooks, 1995).
Currently the constructs of customer satisfaction are built upon concepts such as
individual wants, needs and expectations. These concepts emerged from theories about
Issues such as prices, convenience, appeal and quality were seen as moderating the
choices.
The concept of satisfaction itself needs to be defined. The Shorter Oxford English
Dictionary (1944, p. 1792) defined satisfaction as ‘[1] being satisfied, [2] thing that satisfies desire or gratifies feeling’. It describes satisfy as ‘ [1] meeting wishes of content, [2] be accepted as adequate [3] to fulfil, [4] comply with, [5] come up to
expectations.’ Customer is defied as ‘a person who buys a product or uses a service.’ Hence using these definitions, customer satisfaction can be thought of as a user or purchaser having their needs and expectations fulfilled.
The concept of customer satisfaction has been defined in various ways. Zeithaml, Berry and Parasuraman (1993) suggested that customer satisfaction is a function of the
customer’s assessment of service quality, product quality and price. Oliva, Oliver and
Bearden (1995) suggested that satisfaction is a function of product performance relative
to consumer expectations. Bachelet (1995) considered satisfaction to be an emotional
reaction by the consumer in response to an experience with a product or service. He
believed that this definition included the last contact with a product or service, the
satisfaction experience since the time of purchase as well as the general satisfaction
experienced by regular users. Hill (1996) defined customer satisfaction as the
customers’ perceptions that a supplier has met or exceeded their expectations. Jones
and Sasser (1995) defined customer satisfaction by identifying four factors they
postulated affected it. The factors were: (1) essential elements of the product or service
that customers expected all rivals to deliver, (2) basic support services such as customer
(4) “customisation” which were factors that met customers’ personal preferences,
values, or needs. Ostrom and Iacobucci (1995) examined a number of definitions from
other researchers and distinguished between the concept of consumer value and
customer satisfaction. They stated that customer satisfaction was best judged after
purchase, was experiential and took into account the qualities and benefits as well as the
costs and efforts associated with a purchase. Gerson (1996) suggested that a customer
was satisfied whenever his or her needs, real or perceived were met or exceeded. He
put it succinctly as “Customer Satisfaction is simply whatever the customer says it is”(p. 24).
A new paradigm of customer satisfaction has evolved from this multifarious body of
knowledge. Johnson and Fornell, (1991) proposed an econometric model where
satisfaction was viewed as “a cumulative abstract construct that describes customers’ total consumption experience with a product or service”(p. 271). They stated this was not a transient perception of how happy a customer was with the product at any given point in time. It was the overall experience with the purchase and use of a product or service to that point in time. This concept is consistent with the economic notion where
satisfaction embraces post-purchase consumption utility as well as expected utility
(Meeks, 1984). Johnson and Fornell’s (1991) view also conformed to the economic
psychological theory where satisfaction was compared with the notion of subjective
wellbeing (Wärneryd, 1988). The Johnson and Fornell (1991) model evolved into the
American Customer Satisfaction Index (ACSI). The ACSI model rests on the
relationships between the customers evaluated characteristics such as perceived quality,
perceived value, price tolerance, willingness to repurchase and recommendation of the
10), “Customer satisfaction is when your customers come back and your products don’t”.
2.1.1 Importance of customer satisfaction
The significance of customer satisfaction to the business world is the concept that a
satisfied customer will be a positive asset for the company through reuse of the service,
repurchase of the product or positive word of mouth, which should lead to increased
profit. The converse of this is that a dissatisfied customer will tell more people of their
dissatisfaction, possibly complain to the company and if sufficiently disenfranchised,
change to another company for their product or service, or totally withdraw from the
market (Anderson and Sullivan, 1993; Fornell, Ittner and Larcker, 1995; Oliva, Oliver
and Bearden, 1995).
2.1.2 Perception of customer satisfaction
Customer satisfaction studies tend follow two different models. These models have
been dubbed the “customer concerns” and the “organisational concerns” approach.
There are also an infinite number of shades of grey in-between the two extremes
(Wittingslow and Markham, 1999).
The model of customer satisfaction chosen in a study reflects the culture of the
organisation conducting the study. The type of model chosen has consequences for
customer satisfaction as what the customer should want, against these organisational
and marketing needs (Yi, 1990; Dutka, 1994). If however the organisation has a culture
where the customer is seen as being an independent entity who has his/her own motives
beliefs and needs, then customer satisfaction will be defined as being based upon
customer thinking (Wittingslow and Markham, 1999).
Wittingslow and Markham, (1999) suggest that we perceive the world around us in an
egocentric and selective way. Because we can’t take in all the images, sensation and
feelings that are experiencing continually, we select those that are the most important.
A result of this filtering process is we can not evaluate, with any accuracy, a thing we
have either consciously or unconsciously selected out. The sequela of this, for customer
satisfaction research, is that asking questions on an issue that the respondent has
selected out or not experienced produces problems for the data set produced. Either the
respondent chooses an answer at random (inducing noise into the data set) (Andrews,
1984) or replies with a “Don’t Know / Not applicable” (resulting in missing data). To
minimise this problem, the respondent must be asked question that draw from their
experience and are in language that they understand (Wittingslow and Markham, 1999).
2.2 The Nature of Customer Satisfaction
Before customer satisfaction can be measured, the nature of satisfaction itself must be
determined. As Johnson, Anderson and Fornell, (1995) stated, “The modelling of customer satisfaction depends critically on how satisfaction is conceptualised.” This aspect however is controversial. Some of the disputed characteristics of customer
satisfaction are, the nature of satisfaction, whether satisfaction is cumulative, or
transaction specific, and the merits of measurement at the individual compared to the
market level.
2.2.1 Social Sciences theories of the nature of satisfaction
There have been many approaches in defining the consumer satisfaction/ dissatisfaction
construct and how the various customer factors such as cost or product performance
impact on satisfaction.
1. Equity Theory. - According to equity theory, satisfaction occurs when a given party feels that the ratio of their outcomes of a process is in some way in balance
with their inputs such as cost, time and effort (Brooks, 1995).
2. Attribution Theory - in this theory the outcome of a purchase is thought of in terms of success or failure. The cause of the satisfaction is either attributed to factors that
are internal such as the buyers’ perceived buying abilities or external such as
3. Performance Theory - customer satisfaction is directly related to the product or services’ perceived performance characteristics (Brooks, 1995). Performance is
defined as the customers’ perceived level of product quality relative to the price
they pay. That is satisfaction is equated with value, where value equals perceived
quality divided by the price paid (Johnson, Anderson and Fornell, 1995).
4. Expectancy Disconfirmation Theory - Brooks (1995) stated that Expectancy Disconfirmation Theory, at the time of the publication of his research, was the most
popular of all the social science theories. In this theory, customers form expectations
of product performance characteristics prior to purchase. When the product is
bought and used, the expectations are compared with actual performance using a
better-than, worse-than heuristic. Positive disconfirmation results if the product is
better than expected while worse than expected performance results in negative
disconfirmation. Simple confirmation results when a product or service performs as
expected. Satisfaction is expected to increase as positive disconfirmation increases
(Liljander and Strandvik, 1995).
2.2.2 Statistical History of customer satisfaction
The first work in the area that would become mathematically based customer
satisfaction was carried out in the 1920’s by sociologists studying mass behaviour using
primarily percentage analysis. By the 1940’s, scaling and ratings were at the cutting
edge of consumer science. The jump from correlation to equations was the major
1960’s. These methods however were limited in their ability to bring together theory
and data. They also were restricted in processing behavioural data by their failure to
incorporate auxiliary measurement theories, i.e. the theoretical assumptions made
during measurement, that, if excluded from the empirical model, would bias estimates
and confound results (Blalock 1982, Fornell, 1988).
The increasing availability of computer technology in the late 1960’s and early 1970’s
enabled the widespread use of multivariate analysis in marketing (Sheth, 1971). The
new methods of simultaneous analysis of multiple variables displaced the older
techniques of univariate and bivariate analysis. The new processes included multiple
regression, multiple discriminant analysis, factor analysis, principal components,
multi-dimensional scaling and cluster analysis. The multivariate revolution of the early
1970’s became established within academia by 1980 and became commonly used in
commercial marketing research by 1982 (Bateson and Greyser, 1982).
Around 1982 a new multivariate technique appeared which was claimed brought
together the areas of psychometrics, econometrics, quantitative sociology, statistics,
biometrics, education, philosophy of science, numerical analysis and computer science
(Fornell, 1988). This technique was dubbed the Swedish Satisfaction Barometer
(Fornell, 1988). Claimed advantages of this methodology were that it corrected for
measurement imprecision, isolated effects, modelled a system of relationships and
provided a basis for cause-and-effects interpretation. By the 1990’s the method had
developed by researchers such as Fornell, Anderson, Johnson, Cha and Bryant at the
Index (ACSI), an aggregate, prospective, predictive customer satisfaction measure. The
ACSI will be discussed further in section 2.4.4 (p. 28).
2.3 Concepts of Satisfaction Performance
2.3.1 Gap theory
Parasuraman, Zeithaml and Berry (1988) suggested that expectations in the satisfaction
literature have been used as predictions of service performance, while expectations in
the service quality literature were viewed in terms of what the service provider should
offer. Later Zeithaml, Berry and Parasuraman (1993) modified this distinction,
introducing two different levels of expectations and proposing the existence of a zone of
tolerance between these levels. They argued that satisfaction is the function of the
difference or gap between predicted service and perceived service, while perceived
service quality is the function of the comparison of adequate or desired service with
perceived service performance.
2.3.2 Catastrophe theory / fuzzy logic
Most models of customer satisfaction assume a linear relationship between the effect of
various causes such as expectancy disconfirmation on the consumer’s reaction to a
product or service. Oliva, Oliver and Bearden (1995) put forward the concept of
involvement with a product or service. They suggested that at a low level of
involvement the relationship becomes “sticky”. That is, the consumers do not shift
preferences over a range of reported performance. Instead, the perceived performance
level declined until it reaches a cusp where the consumer suddenly abandoned the
product in favour of a competitor. Later when the perceived performance of a product
improves, the consumer will not re-purchase until there is large advantage in doing so.
2.3.3 Transaction-specific satisfaction and cumulative satisfaction
Johnson, Anderson and Fornell (1995) suggested there were two concepts of customer
satisfaction in the literature: transaction-specific satisfaction and cumulative
satisfaction. Transaction specific customer satisfaction focuses on individual consumer
responses to individual products and services while the cumulative one describes the
total consumption experience of a customer with a product or service (Anderson and
Fornell, 1993; Boulding et al., 1993).
Some disagreement exists in transaction-specific satisfaction. Parasuraman, Zeithaml
and Berry (1988) suggested that perceived service quality was an antecedent to
transaction-specific satisfaction while Bitner (1990) and Bolton and Drew (1991)
believed that transaction-specific satisfaction is an antecedent to perceived service
quality.
Johnson, Anderson and Fornell (1995) argued that while enterprises had a practical
need to conduct transaction specific research on customer satisfaction, this action did
not contribute to the generation of empirically generalised theories and models on
satisfaction was more likely to overcome problems in reconciling the variation of
findings at the individual level.
2.3.4 Individual (disaggregate) satisfaction
A large amount of customer satisfaction literature is based on the model of disaggregate
(individual level) satisfaction with services or goods (Yi 1991). These disaggregate
studies show the scope of human behaviour. However, Yi (1991) and Anderson and
Sullivan (1993) have reported problems with the empirical “generalizability” of these
studies. Johnson, Anderson and Fornell (1995) argued that the attitudes and behaviour
of individuals might be so unique that reliable generalisations cannot be determined
from individual level studies. As a solution to this problem, they suggested the
aggregation of individuals to produce a market level satisfaction.
2.3.5 Market level (aggregate) satisfaction
Little work has been done on aggregate or market level customer satisfaction. Market
level satisfaction is the aggregate satisfaction of all those who purchase and consume a
particular product. Johnson, Anderson and Fornell (1995) reported that the aggregation
of individual responses served to improve the power of the measurement by reducing
the error in measurement of satisfaction variables and increasing the verification of
coherent relationships with other variables. They suggested that the aggregation might
also increase the sensitivity to relationships between consumer attitudes and subsequent
Market level satisfaction has been found to be reasonably stable over time (Johnson,
Anderson and Fornell 1995). Market performance expectations have a large rational
component yet remain adaptive to changing market conditions.
Johnson, Anderson and Fornell (1995) identified three antecedents of their market
model: performance (perceived product quality relative to price), expectation (attitudes
or beliefs about the degree of performance) and disconfirmation (the degree to which
perceived performance confirms performance expectations). They suggested that
disconfirmation has an important role in developing transactional models of satisfaction
although it is a problematic concept.
2.4 Measuring Customer Satisfaction
Various methods have been used to measure customer satisfaction. Many customer
satisfaction measures however are created without consideration of to their final use. In
particular, they are not designed for easy interpretation by managers looking to best
implement change in their organisation (Fornell, Ittner and Larcker, 1995). Those that
have been used include:
2.4.1 The Top box method
The very common “Top-box” surveys where the respondent ticks one of a small number
of boxes suffer from a number of limitations. The small number of scale points results
in a significant measurement error in the indices. This makes small changes in
out a survey form, respondents will rarely use extremes. So if boxes numbered 1 to 5
are presented to an individual, the responses 1 and 5 are rarely used. This effectively
reduces the scale to one of three points with the mean average normally in the range 3
to 4. There is a tendency for researchers, when analysing data from Top-box surveys, to
add together the top two boxes, generally an “excellent” and “good” rating and then to
use the resulting percentage value as the number that are satisfied (Patterson, 1996;
Quint and Fergusson, 1997). As well as oversimplifying the concept of customer
satisfaction, this reduces the sensitivity of the measure to changes such as customers
going from a good to an excellent rating.
2.4.2 The SERVQUAL method
SERVQUAL was developed by Parasuraman, Zeithaml and Berry (1988) and is based
on the service quality “gap model”. The gap model defines service as a function of the
gap between customers’ expectations of a service and their perceptions of the actual
service delivery by an organisation. Although widely used (Hemmansi, Strong and
Taylor, 1994), SERVQUAL has had a number of criticisms including multicollinearity
(Chen, Gupta and Rom, 1994) and psychometric problems (Brown, Churchill and Peter,
1993). Smith (1995) considered it of questionable value for either practitioners or
academics.
The above two techniques are the main systems utilised by researchers. However, they
are affected by several problems. The most important of these is that they fail to
provide insight into the determinants of customer satisfaction that have the greatest
influence on purchase, repurchase and price tolerance that lead to the highest economic
2.4.3 National Centre For Quality Research (NCQR) method
The basic model for estimating the NCQR consists of a system of equations describing
relations among six constructs, perceived quality, customer expectations, perceived
value, customer satisfaction, customer retention and customer complaints. Each
construct is measured using multiple questionnaire items to increase the precision of
measurement. Each of the questions is measured on a ten-point scale to enhance
reliability and reduce error in the indices. This also increases the ability to track small
changes that may be lost using a more coarse scale.
The data is analysed using a proprietary version of partial least squares modelling
(PLSM) to produce a customer satisfaction index (Fornell, Ittner and Larcker, 1995). It
is claimed that the index has a high correlation with customer repurchase intention and
price tolerance and hence economic performance because of the weighting of individual
items such as overall satisfaction, confirmation to expectation and comparison to ideal
(Fornell, Ittner and Larcker, 1995). The index was developed to overcome
shortcomings in ability to directly link quality improvements with changes in financial
performance.
The NCQR methodology can be used at both the macro and micro level. Examples of
the macro level applications are the Swedish Customer Satisfaction Barometer and the
American Customer Satisfaction Index. Used this way it is a national measure of how
well companies and industries satisfy their customers (Fornell, 1992). It measures
compared with a productivity index, which also measures economic performance but
refers to quantity.
The micro level application of the NCQR methodology focuses on a single business. It
assists in the managing of the overall business strategy by concentrating on the retention
of customers rather than the more common emphasis on recruiting new clientele. The
methodology considers the customer base to be an asset. It aims to measure what
variables affect customer satisfaction and retention and it is claimed that the
methodology can predict what will be the impact of changes to the variables upon reuse,
recommendation, repurchase and price tolerance (Fornell et al., 1996).
2.4.4 Macro applications of the NCQR method
The National Centre for Quality Research methodology was used first by the Swedish
Customer Satisfaction Barometer (SCSB) in 1989 (Fornell, 1992). Although many
individual companies and some industries had measured customer satisfaction, this was
the first time a nation had done so (Fornell, 1992).
A further evolution of the cumulative and aggregate market approach is the American
Customer Satisfaction Index (ACSI) that was first developed in 1982, tested, further
modified and implemented by Fornell, Johnson, Anderson, Cha and Everitt-Bryant in
1995 (Fornell et al., 1996). The ACSI is the macro face of the NCQR methodology;
instead of dealing with an individual company, it is a national economic indicator of
customer evaluations of the quality of goods and services of the major corporations in
the particular economy. The development of the ASCI model is based on aggregated
quality, perceived value, customization, reliability, customer expectations and price
tolerance (Fornell et al., 1996).
The World Quality Council (WQC), the international peak quality body, has been
deliberating on methods by which quality could be measured across, dissimilar
products, services and nations. In 1997, the Secretary General of the WQC
recommended that the member countries develop their own Customer Satisfaction
measures based on the NCQR from the Business School of the University of Michigan
(WQC, 1997).
2.4.5 Micro applications of the NCQR method
The NCQR methodology that is used for the SCSB and the ACSI can be customised for
application at the micro or individual company level. This is done by conducting initial
qualitative research by non directive interviews with customers and staff to determine
the drivers of customer satisfaction and the economic consequences of the satisfaction
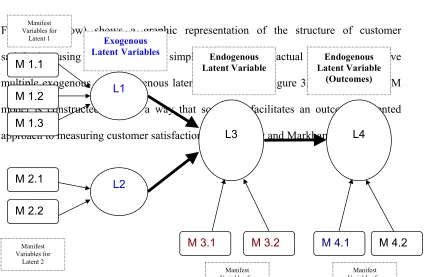
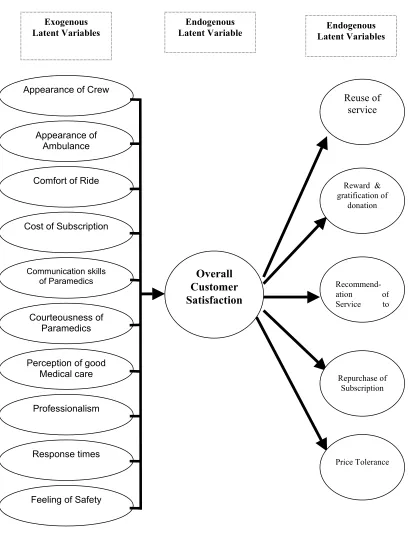
that are unique to that company. From this a preliminary model of the customer
satisfaction, customer generated drivers of satisfaction are constructed and grouped into
latent variables. These latent variables impact to various degrees onto the overall
satisfaction. Changes in the overall satisfaction affect the economic consequences or
outcomes of price tolerance and loyalty in terms of re-purchase and recommendation to
From the survey results, it is possible to estimate the financial consequences of changes
in the satisfaction drivers through factors such as quality initiatives. See section 3.3.4.2
(p. 56) for a detailed discussion on the methodology.
2.5 Medical Care Satisfaction Literature
2.5.1 The importance of satisfied patients
The generalised ramifications of satisfaction that apply to other customers were also
found in medical patients. Patients that were satisfied were more likely to return to a
particular doctor or hospital, less likely to leave private health insurance, and less likely
to sue of negligence (Ware and Hays, 1988; Stelber and Krowinski, 1990; Weiss and
Senf, 1990; Aharony and Strasser, 1993; Levinson et al., 1997). Satisfied patients were
also more compliant with their medical therapy and as a result had better clinical
outcomes (Greenfield, 1985; Rubin, 1989; Kaplan, Greenfield and Ware, 1989; Hauck,
1990; DiMatteo et al., 1993).
Welch et al. (1999) argued that patient perception of health care quality reflected
underlying satisfaction with care. They suggested that patient satisfaction was as
important as any other outcome of medical care, particularly in the elderly population.
Thomas (1998) asserted that patient satisfaction was a critical variable in any
medicine was the technical side while the art of medicine was the patient satisfaction side.
2.5.2 Determinants of patient satisfaction
Many factors have been reported as influencing patient satisfaction with medical care.
They include:
Age - Older patients tended to be more satisfied with their medical care (DiMatteo and Hays, 1980). The researchers suggested that this may have been due to the patients’
longer than average relationship time with their care providers.
Gender - Lieberman (1989) found that women had higher satisfaction levels than men. This contrasted with the earlier work of Gray (1980) and Greenley and Schoenherr
(1981) that found no gender bias in satisfaction.
Income - Many studies found that wealthy patients are more satisfied than poor patients (Chaska, 1980; Patrick, Scrivens and Charlton, 1983; Calnan, 1988). They suggested
reasons such as poorer patients received less continuity of doctors, less salubrious
hospitals and paid a proportionately more for medical prescriptions.
Cost - Sing (1990) found using factor analysis that satisfaction with a medical insurance provider tended to be very independent dimension from satisfaction with medical care
providers. That is, the patients could rate the medical care highly while having low
Race – Murray-Garcia et al. (2000) found significant differences in the level of satisfaction different racial and ethnic groups reported with medical care providers.
They found that Blacks reported the highest satisfaction, followed by Whites while
Asians tend to report lower levels. However, the group was unsure if this reflected
higher expectations or differences in quality of care.
Staff - Many studies on medical services reported factors relating to staff as having the most impact both on overall satisfaction and on tendency to recommend the service to
others (Quint and Fergusson, 1997; Garney, 1998; Press and Garney, 1998; Weinsing et
al.; 1998, Brown et al., 1999). The exact description of what aspects of the
interpersonal interface were the most important varied greatly depending on the study.
Quint and Fergusson (1997) in their study of patients of Victorian public hospitals
found that the key drivers of very high patient satisfaction were communication aspects,
compassion, reassuring attitude, courtesy and availability of staff. Press and Garney
(1998) reported that staff sensitivity to the problems of the patient was the most
important influence in recommendation of that hospital to others. The lesser important
interpersonal factors found were, staff concern about patient privacy, nurse's attitude
toward being summoned and friendliness of nurses. Weinsing et al. (1998) found that “informativeness” and “humaneness” were among the factors most often cited as
important to patients. Garney (1999) found that the issues most influencing the
likelihood of a patient recommending a hospital were, staff sensitivity to the
inconvenience that health problems can cause, staff concern for patient privacy, amount
of attention paid to patients special needs, degree to which nurses took patients health
nurses. Dale and Howanitz (1996) found meeting an outstanding employee was
correlated with higher satisfaction rates.
Some authors believed that the patient’s evaluation of the communication skills of their
treating clinician was a critical determinant of patient satisfaction (Rowland-Morin and
Carroll, 1990; Hall et al., 1994; Frederickson, 1995; Roter et al., 1997). Brown et al.
(1999) found that patient satisfaction did not increase after a short training session on
communication skills for general practitioners. They suggested that such skills training
programs might need to be longer and teach a broader range of skills to have an effect
on patient satisfaction.
Response - Promptness of response to call button was found by Press and Garney (1998) to be of importance to hospital patients. Garney (1999) found this also
influenced the likelihood of a patient recommending a hospital. Time waiting for admission was found to be a factor by Quint and Fergusson (1997). Dale and Howanitz (1996) also found that shorter waiting times were correlated with higher satisfaction
rates in patients.
Clinical Skill - Patients find it difficult to evaluate the clinical skill of medical providers (Berry, 1995). Quint and Fergusson (1997) stated that the technical skills of
medical staff are assumed to be high and it was the “personality” aspects of a hospital,
which appeared to play a greater roll in patient satisfaction. Other studies found clinical
skill to be important. Baker (1991) established that quality of medical care was one
determinate of patient satisfaction with their general practitioner. Dale and Howanitz
with higher satisfaction rates. Weinsing et al. (1998) reported that patients often cited
competence and accuracy as important in their satisfaction with a general practitioner. Garney (1999) found that the technical skill of nurses influenced the likelihood of a
patient recommending a hospital.
Other Determinates – Other factors that patients found influenced their satisfaction with their general practitioner were accessibility, continuity, availability, premises
where patients were involved in decisions, time for care, accessibility and availability
(Baker, 1991; Baker and Streatfield, 1995; Weinsing et al., 1998).
In regard to hospitals involvement of the patient in decisions, adequate information
about treatment, less injections, quality of meals, overall cheerfulness of the Hospital
were found to influence satisfaction and the likelihood of a patient recommending a
hospital (Dale and Howanitz, 1996; Quint and Fergusson, 1997; Garney, 1999).
Overall Satisfaction
The patient's overall satisfaction with care is influenced by their medical outcome
(O’Connor et al., 1999). As discussed above interpersonal factors play a important role.
Lumley, Brown and Small (1993) suggested that there was a tendency for patients to be
uncritical of health care workers, particularly immediately after the event. This perhaps
would lead to high satisfaction scores if customers were surveyed immediately after
their experience.
The high satisfaction usually found when measuring patient’s evaluation of medical
Fergusson’s (1997) survey of Victorian Hospital recorded high levels of satisfaction.
Quint and Fergusson found that in regard to overall satisfaction, 76% of patients were
“very satisfied” and 20% “fairly satisfied”. A high 96% of patients said they would
recommend the hospital to friends and family. In terms of perception of the quality of
2.6 Ambulance Customer Satisfaction Literature
2.6.1 Australian ambulance satisfaction studies
The literature shows high satisfaction with Australian ambulance services. However,
none of the publicly reported Australia ambulance satisfaction surveys are directly
comparable to the proposed ACSI methods.
Patterson's (1996) survey of the patients transported by the Queensland Ambulance
Service (QAS) used the top-box method. She reported that of the 903 responses, 80%
rated QAS as excellent and 17% as good.
North West Region – Ambulance Service Victoria’s (NWR–ASV) (1998) survey
reported a 99% affirmative response to the yes / no question “was the patient satisfied with the overall service provided?” The author then felt the need to point out that the single “no” vote was received from a patient being transferred between psychiatric institutions. Both surveys reported good response to questionaries via mail, Patterson
(1996), reported a 45.2% return rate among a cohort of transported patients that
included 95% subscribers. NWR–ASV (1998) had a 37% return rate after sampling
every tenth case it responded to in October 1998. This high response rate is echoed in
the USA where Fultz, Coyle and Reynolds (1998) reported a 61% response rate to a
The NWR–ASV (1998) survey questionnaire was generated from unspecified research
on patient surveys that other ambulance services had used along with input from the
ambulance service’s management team. Patterson (1996) did not state how the
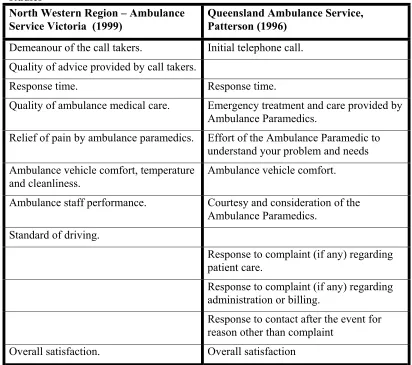
questions for her survey were chosen. Table 1 (below) displays a comparison of the
issues measured by the two surveys. It can be seen that the two surveys examined
similar issues apart from Patterson's focus on complaint handling. The survey
instrument used in this thesis can be found in Appendix I.
Table 1 Comparison of issues measured by Australian ambulance satisfaction studies
North Western Region – Ambulance Service Victoria (1999)
Queensland Ambulance Service, Patterson (1996)
Demeanour of the call takers. Initial telephone call. Quality of advice provided by call takers.
Response time. Response time.
Quality of ambulance medical care. Emergency treatment and care provided by Ambulance Paramedics.
Relief of pain by ambulance paramedics. Effort of the Ambulance Paramedic to understand your problem and needs Ambulance vehicle comfort, temperature
and cleanliness. Ambulance vehicle comfort.
Ambulance staff performance. Courtesy and consideration of the Ambulance Paramedics.
Standard of driving.
Response to complaint (if any) regarding patient care.
Response to complaint (if any) regarding administration or billing.
Response to contact after the event for reason other than complaint
2.6.2 Australian ambulance emergency call takers
Dale (2000) studied the level of satisfaction of 423 telephone callers requesting
emergency ambulances from Intergraph Public Safety™ (IPS). Whilst IPS takes the
initial calls for service and dispatches the Metropolitan Ambulance Service crews, it is a
separate organisation. Dale’s (2000) study used non-directive telephone interviewing to
develop a customer-based questionnaire; then used simple descriptive statistics to
analyse the resulting data. The mail questionnaire achieved a 53% response rate. He
found that the main drivers of satisfaction with the call taking process were:
attentiveness, efficiency, professionalism, ability and perceived level of training of the
call takers. Dale (2000) reported a mean satisfaction with the call taking process of
8.62 on a scale of 1 to 10. Health professionals were less satisfied with the call taking
process with an average overall satisfaction on 7.9 on the same scale. Dale (2000) did
not explore the reasons for the differences or determine whether they were statistically
significant.
2.6.3 USA studies of ambulance services
Fultz, Coyle and Reynolds (1998) studied air ambulance patients in the USA, using a
4-point Likert scale; the respondents discussed similar issues to the Australian studies.
They found that the issues, which were important to the patients and needed
2.6.4 Customer perceptions and expectations of MAS
Baragwanath (1997a) in his Auditor General’s report into the MAS stated “The public’s expectation of its ambulance service is that it will respond quickly to emergency calls and provide quality clinical care to patients”(p.5). No one would argue that the quality of medical care provided by an organisation, such as MAS is, not paramount in
importance, but the general public has little medical knowledge from which to judge
their pre-hospital care. Because of their technical nature, or other reasons, it is not
always possible for customers to know if a service was performed properly. Services
that are difficult for customers to judge even after they have been performed are known
as “black box services” (Berry, 1995). In effect, the service remains hidden or
semi-hidden as if in a black box. This is true of the MAS service, as the customer/patient has
little idea of the correct medical procedure. As a result, they are likely to form their
opinion of the service from other factors (Swan, 1989). Bachelet (1995) found that a
product’s perceived performance will tend to reflect its image when the customer is
unable to compare the service provided with other products. Swan (1989) suggested
that personal grooming, neat uniform, clean, well maintained vehicles, safe driving and
calm professional conduct of the ambulance officers were important factors for the
public in judging the performance of an ambulance service. He also suggested that
community first aid and CPR programs help positively affected the public’s perception
of an ambulance service. Ryan (1994) stated that customers, who are patients, needed a
high level of reliability for the provision of equal access to definitive care. Yet, it seems
that the staff interpersonal issues, not medical technical quality, were the main causes of
satisfaction and complaint (Lescun, 2000). In the wider literature, a study of customer
friendliness, was the most important followed by staff competence and cost. MAS’s
data on complaints (Lescun, 2000) demonstrated the importance of good interpersonal
skill and attitude for staff.
Figure 1 (above) shows total complaints received by MAS for the period 1st April 1999
– 31st March 2000 inclusive. Commendations for the same period numbered 389 but
were not broken into categories (Lescun, 2000). The commendations were
approximately double in number compared to complaints and this was seen as
suggestive, by senior management, of high customer satisfaction. That Paramedic Attitude is the largest category concurs with the black box concept of clients forming an opinion of the service on factors other than medical quality, as suggested by Swan
Complaints to MAS
April 1999 - March 2000
(n = 205)Delay 18% Paramedic Attitude 33% Destination 5% Subscriptions 1% Operational 5% Paramedic Driving 1% Other 3% "000" 1% Clinical Quality 19% IPS 2% Accounts 12%
(1989). Some 19% of the complaints were categorised as relating to Clinical Quality, so medical quality was perceived to be a factor by customers. Delay related to time until the ambulance arrived. Accounts related to the billing of customers that were not otherwise coved by subscription or a Health Care Card; Destination related to the choice of Hospital by the ambulance crew. Operational was concerned with system problems. IPS was Intergraph Public Safety™, the private company that dispatched the Ambulances (as was discussed section 2.6.2, page 38). 000 is the Australia wide emergency phone number, comparable to “911” in the USA or “999” in the UK. This
service was staffed by Telstra™ employees, not MAS. Paramedic Driving and Subscriptions are self-evident.
2.6.5 MAS and quality
In 1997, all MAS’s non-emergency stretcher contractors were accredited to ISO 9002
(MAS, 1997). MAS as a whole achieved ISO 9001-2000 in 2001 (MAS, 2001). MAS
have not published a document that deals directly with customer satisfaction. It does
however have a Total Quality Assurance Program with a stated goal of continuing improvement in the quality of care delivered by the MAS. It acknowledges that the
MAS’s core business is that of patient care (Csupor, 1997)
MAS currently measures the quality of its service by clinical indicators. Csupor (1997)
stated that the crew members first complete an informal clinical audit at the time of
service delivery, in the form of self or peer appraisal. A more formal clinical In-field
audit is performed by a Clinical Support Officer (CSO). The CSO observes the
individual ambulance paramedic’s clinical performance, patient care at the scene and