Developing Attitude Scale on Economy
Education towardTeacher Candidates of Social
Studies: A Study of Validity and Reliability
Bulent ALAGOZ
PhD, Assitant Professor, Faculty of Nizip Education, Gaziantep University, TURKEY [email protected]
Abstract
Economics is a factor causing people to make decisions which result in their biggest happiness or sadness. We take economical decisions. While taking decisions, we solve problems, think creatively and sometimes adapt a critical manner and criticise several individuals and associations in different ways and methods. Claiming rights, calling someone to account, reacting against injustices and voting which is one of the most important duties of citizens, are the basic criteria of a functioning democracy. Social studiesisa discipline that is shaped in order to redound such abilities to individuals. The aim of this study is to develop a measurement tool in order to determine teacher candidates of social studies towards economy. Study was carried out through a sample consisting of 436 teacher candidates of social sciences. Validity and reliability analyses indicate that this measurement tool is adequate in measuring attitudes of teacher candidates of social studies towards economy education.
Keywords:Economics, social studies, attitude, exploratory factor analysis, confirmatory factor analysis.
INTRODUCTION
profits decrease? These are the problems that we
encounter every day. We have to solve these because economy affects the whole society; including consumers, labourers, officials, businessmen, producers and citizens. We are all consumers, officials, labourers, officials, businessmen, producers but at the same time all of us are citizens. Therefore, we confront the above-mentioned economic problems all the time. We should make decisions on daily basis while solving these problems. Therefore, economics sometimes necessitateto makedecisions on a very complicated level. In this point, while making decisions, we solve problems, think creatively and sometimes adapt a critical manner and criticise several individuals and associations in different ways and methods. Therefore, we fulfil our duties as citizens. Claiming rights, calling someone to account, reacting against injustices and voting which is one of the most important duties of citizens, are the basic criteria of a functioning democracy. According to National Council for Social Studies (1994) social studies is a discipline that is shaped in order to redound such abilities to individuals; it is a combination of social sciences and humanities. The main aim of this field is to help young people become good citizens who make reasonable decisions with awareness of independent world, democratic society and cultural differences (NCSS, 1994).
How effective do economy classes in Social Studies programs in terms of making students to understand problems/issues of real world? The answer of this question is not wondered in undergraduate program of Social Studies Education which is part of higher education in Turkey for social studies teacher candidates. Although economics is a discipline of social sciences, it is generally neglected by social scientists. It is observed that economics in social studies research (thesis, articles, books, proceedings, projects) is not studied much. Courses in undergraduate programs are mostly given by instructors who studies economics-management.
thinking. Weisbrod pointed out this issue in 1979
and asked this questions: “Why do economists have to investigate all problems? Why don’t we leave the issue to the psychologists and education experts?” Relatedly, Gleason &Scyoc (1995) underlined that education is a significant factor in explaining economic knowledge and confirmed that economics education and social studies education research share same methodological and schematic problems
(Becker, 1983a-b-c; Fraenkel, 1987;
Wallen&Fraenkel, 1988; Becker et. al., 1990). In Turkey, the strong relationship between economics education and social studies education has not been investigated enough and this is a serious gap. In order to fill this gap, the aim of this study is to develop a measurement tool, particularly for the use of social studies experts and students.
Relevant Literature
Economics education has been studied approximately for 60 years world-wide, particularly in United States of America. Several publications were made in this topic. Social studies educators also do research and make publications. For social studies experts, the definition of economics is the balance to be established between unlimited needs of human beings and limited natural resources. Parker (2001) defined economics as work for production, distribution, exchange and consumption of goods and services that people need under scarcity conditions. Singer (2003) stated that 21th
century movements such as progressivism, bureaucratism, technocracy, fascism or socialism have increased the significance of social sciences, underlined that English economist John Maynard Keynes contributed to expanding role of social sciences in terms of managing the capitalist economic system, measuring the effects of government subsidised social programs and economic development and drew attention to the increasing importance of social sciences. According to Singer (2003), economics study how people, humans and nations produce and distributes the goods that they need to survive. Martorellaet. al. (2005) also associated the discipline of economics with production, consumption and exchange.
&Gilliard examined these choices with the concept
of sacrifice. Sacrifice includes to choose or accept the less in order to acquire the more. Each sacrifice has consequences. Individuals prefer one good or service to another or prefer the more to the less and make self-sacrifice. These sacrifices might have positive incomes and they may positively affect the individual. An employer may increase his or her profit by neglecting measures of labour safety or he or she can take this measure and decrease his or her profit. In the latter, although the profit seems to diminish, the value of human life increases. If the employer thinks only profit, it may cause injuries or deaths of workers. Societies also make sacrifice; for example concerning the energy they need and the environment that they desire to protect. The assessment of sacrifices, when done systematically and carefully, include comparison of each alternative’s pros and con. When it is done the opposite, in other words through making unplanned and unconscious sacrifices in order to increase profit, the consequences can be more destructive. In Easter Island, which is located on the Pacific Ocean, the rich and diverse natural life collapsed after a 400 year-old process of sculpture competition (14th- 18th centuries). The choice of making bigger sculpture resulted in a big environmental catastrophe (Diamond, 2006).
Publications on economics education seems to include a large variety of topics. Researchers
positive and significant relation between student’s
college grades and high school grades of economics courses (Breeden and Lephardt, 2005; Durden & Ellis, 1995). Hingsmith (1974) indicated that one of the aims of in-service training for teacher candidates is to increase literacy of economics. Salemi et al. (2001) focused on literacy of economics and the importance of economics education for specialisation of students. Consequently the findings underline that having right perceptions and attitudes towards economics courses is crucial for students in order to be successful in economics courses. (Ballard & Johnson, 2004; Bachan& Reilly 2003).
Karstensson&Vedder(1974),
Soper&Walstad (1983) and O’Brien &Ingels (1987) conducted studies to measure students’ attitudes towards economics. Hodgin (1984) stated that attitudes towards economics at the same time are affected by messages which include information about economic performance. Van Wyk (2012) also claimed that the more economic concepts students know, the more they like the topic; finally they pay more attention to economics topics and they become more knowledgeable.
On the other hand, it has been suggested that attitudes towards economics education are negative when there is a misbalance between the educator’s teaching style and the student’s learning style. (Karstensson&Vedder, 1974; Wetzel et al., 1982;
Charkins et al., 1985; Benedict & Hoag, 2002). Torrent (2011) gave useful information to overcome the above-mentioned situation. According to Torrent (2011), students learn in two ways: active learning based on cooperation and passive learning. In active learning, students construct knowledge through using his or her experiences whereas in passive learning, students wait to be filled with information, as an empty pot or glass waits on to filled. Many studies confirmed the benefits of active learning; however passive learning maintained its dominant position in economics education (Torrent, 2011).Jaworski, et. al. (2010) also supported this situation and asserted modern economics is basically taught through stable balance models. Nevertheless, there is a general opinion that economic education is developed through methods of learn by living such as active/student oriented learning which have many qualified properties. Learn by living, in comparison to traditional teaching, creates advantages such as high level of student motivation, better recalling of knowledge, increasing individuals’ level of learning and encouragement of students’ learning desires. The important thing is to make sure that students as active learners have experiences and reshape this experiences on their own (Egbert &Mertins, 2010).
discussed. For instance, Bach and Saunders (1965)
found out that teachers, who took one or two-hour economic courses, were not successful. 16 years later, Yankelovich, et. al. (1981) claimed that economics is a crucially needed course in schools. Lynch (1990) suggested that social studies students at least take four hours economics course in order to influence students’ learning. Allgood&Walstad (1999) continued this discussion after 24 years of Bach and Saunders indicated that high school students on undergraduate level should take at least six hours of economics courses because students’ understanding of economics depend on that. Finally Miller &VanFossen (2008) stated that current research on teachers’ knowledge on economics demonstrates that teachers do not take enough economics courses. This statement also show that in 40 years since 1965, this question has not yet been answered: How many hours of economics courses that teachers should take? Even this question is answered, another question arises: Should economics course be a separate course? Walstad and Watts (1985) identified many weaknesses in terms of combining economics courses with other courses: teachers’ lack of self-confidence for teaching economics, superficial education, inadequatepresentation of ideas of economics in curriculum materials, insufficient time for economics courses in curriculum. The result of this is to confront young people, who generally
social studies teacher candidate should be
encouraged to spare more time for studying or reading economics. Kauper (2012) also is one of the educators that a new approach is needed for economics. Kauper urged that economics courses taught to student are not enough for students in terms of making connections with the real world in a meaningful way. According to Kauper, students reject the economics we teach, because it is not enough to explain the world they know. They are more concerned with technological developments in the world they now than a factory. We can explain this world with recent theory of economics; not a theory dates from 1956 (Kauper, 2012).
Social approach to economics might be beneficial. Many students still avoid to make an effort to understand world of economics. They know that they want to get high grades but they are doubtful whether knowledge of economics that they are presented is really useful or not in their next lives. They think the time spared for practices, which are not associated with the real word, is a loss. They consider it confusing when teachers teach off the book. However, it might be necessary to go off the book, to make learned information permanent, life-long and useful(Kauper, 2012). Students should be encouraged to deal with real life problems (Mearman et. al., 2011; Kneppers, et. al.,
2012). Because economic problems are
indispensible parts of daily life; they exist as
problems in each individual’s life. According to Schug&Waldstad (1991), economic decisions in order to solve these problems are made on daily basis. Because no connection is made between the teachings in schools and the ones in real life, students are not able to transfer their economic knowledge to their daily lives. They learn it only for a short while to pass the exams and then forget it. Therefore, students cannot see the life from the perspective of an economist. For this reason, student’s life outside of the school must be considered. If students cannot do it, then students in economics courses should confront problems of real life. This should be achieved in a cooperative class environment. Similarly, as Contreras et. al. (2012) stated, a student’s class performance has effects on success of his or her class mates. These are part of their daily lives and problems to be solved. Meaningful learning happens only through this way. In other words, it occurs only in such an environment where students construct and apply their mental models actively. Knowledge transfer is a significant goal in economics education. For example, Kennedy (2012) suggested that university students in the field of health should configure what they learn and use them in solving real life problems.
its aspects, should be included in the course as
much as possible. However, there are serious obstacles against leading students to solve real problems. The world that creates real problems is complicated. Therefore, students feel that they need to learn multiple theories most of which are falsifiable. If a theory partially brings a phenomenon into the light, it is useful to learn it. Learning a theory also means better understanding of another theory. Both theories may present political suggestions and they might be closely connected. They encourage debates and discussions and through them other disciplines can be connected. Even in open and complicated environments, multiple methods and techniques are needed at the same time: multiplism equips students with different methodological approaches towards problems and different tools to solve these. Moreover, learning by discussion, students learn to confer their own methods through tough topics where multiple points of views exist. In short, they learn how to judge. Therefore, students become more creative, more problem solving. With multiple point of views based on different methodological and even different moral basis, they learn to confer hard situations in a better way (Mearman et. al., 2011). Similarly, education methods construct solid bridges between students’ knowledge and the goals of the course. Inadequate education practices supports an abstract understanding of science which
does not deal with modern world (Geerling, 2012). The solution offers to this problem are to make students watch lectures recorder on internet over and over again (Chen & Lin, 2012) or to simplify the complexity of economics and use simulation model of the NetLogo software which aims to improve students’ understanding of economics (Kochanski, 2012).
be educated about complexity (Mearman et. al.,
2011) and therefore this might increase the adaptation of students to the world in a more successful way. However, in order to achieve this, economics educators should read more in fields associated with economics but academics do not
tend to read non-economic topics
(Hadsell&MacDermott, 2012). Nevertheless, it is necessary for academics to study and do research in other fields and improve them.
The Aim of the Study
Economics is the major factor, primarily affecting and even shaping human life. We all work to live our lives better. We get tired and exhausted but we have a rest then go back to the competition. We make numerous economic decisions in our daily lives. Some of these decisions make us happy, some make us sad. The important thing for all individuals is to maintain a better life and make accurate choices while making decisions. People in Turkey are no exceptions. The people in this country also make countless economic decisions in their daily lives; some of which make them happy, some make them sad. When the economic dimension is considered and higher education is focused, it is observed that social studies educators remain distant to the topic of economics. Thus, there are scarcely any studies on economics on the high education level in the literature. It is an
important shortcoming for the country that teacher candidates, who will educate posterity on a topic which affects and even shapes the lives of individuals, are not familiar. The aim of this study is to make a step in filling this gap in the field of social studies education.
METHOD
Sample
The data concerning the scale were acquired from 436 students, who study at the University of Aksaray, Faculty of Education and the University of Niğde Faculty of Education, Department of Social Studies Education on 2013-2014 academic year. The participants are second, third and fourth grade students. The students of University of Gaziantep, Nizip Faculty of Education, Department of Social Studies Education, where test-retest application was done, were not included in the sample.
PROCESS Scale Development Phase
1. Article Formation Phase:Economics is
taught in the undergraduate program of social studies education under the titles “Economics”,
“General Geography of Economics and
Humanities” and “Geography of Economics and Humanities in Turkey”. Courses like “Current World Issues” or elective courses like “Environmental Science”, though not directly as the other courses, include economics oriented titles. In the literature review, there is no developed or adapted tool for measurement concerning economics, which has a dominant position in the undergraduate program of social studies education. Therefore in the article formation process, first of all foreign sources, then national sources were scanned (Armento, B. J., Rushing, F. W. & Cook, W. A., 1996; Bayhan, P., Yükselen, A. &Kaysılı, K. B., 2007; Miller, S. L. &VanFossen, P. J., 2008; Schug, M. C. &Walstad, W. B., 1991; Van Wyk, M. M., 2012) and article pool consisting of 63 items. Three of them were negative. Prepared items were applied to 25 students who study at the University of Aksaray, Faculty of Education, Department of Social Studies Education in terms of face validity. Students gave feedbacks through interviews concerning clarity of items and application duration. In line with the proposed amendments, eight items were removed from the scale.
2. The Phase of Asking Expert Opinion:
Four experts on educational sciences were consulted about 55-article scale form in order to be sure whether the survey includes enough questions which also represent the phenomenon to be measured and content validity. These four experts in the field evaluated whether scale items are compatible with the discipline of social studies or not; three linguistic experts assessed items in terms of language and clarity. Experts also examine whether the scale measures student attitudes towards economics course and grammar clarity. In accordance with the suggestions, items were modified and five items were removed from the scale. Finally the scale, used for validity and reliability in the next phases, consisted of 50 items. The duration for answering questions is approximately 25 minutes.
3. The Phase of Preliminary Test: In total
and lowest points from economics education
attitude scale were respectively 250 and 50.
Draft scale was applied to 41 teacher candidates of University of Gaziantep, Nizip Faculty of Education, Department of Social Studies Education with two weeks intervals in spring semester of 2013-2014 academic year. In the same period, the pilot application of draft scale was applied to a total number of 436 teacher candidates studying social studies education at the universities of Aksaray, Adıyaman and Niğde. The acquired data were statistically calculated.
Tool for Data Collection
In this study, tool for data collection was only Attitude Scale on Economy Education Towards Teacher Candidates of Social Studies because no developed or adapted scale on economy education towards teacher candidates was found in the national literature.
RESEARCH FINDINGS
Data Analysis
In evaluating findings of the study, Lisrel 9,1 and SPSS 24 statistical software were used for statistical analysis. The study used descriptive statistics in assessing data. In order to demonstrate construct validity, Exploratory Factor Analysis was used. The dimensions obtain in Exploratory Factor Analysis were reassessed through Confirmatory Factor Analysis. For general reliability and reliability of sub-dimensions, Cronbach‟s Alpha
was used. Cronbach‟s Alpha coefficient was calculated for general reliability and reliability of sub-dimensions. Reliability of a measurement also shows its consistencies. The most common method for examination of reliability is Cronbach‟s Alpha coefficient. This coefficient is the measurement of the internal consistency (homogeneity) of the scale’s items. It is considered that the higher the Alpha coefficient indicates “the high consistency of the scale’s items; the scale’s items demonstrate similar properties or all items work together in line with the highness of the coefficient” (Alpar, 2006). The assessment criterion for Cronbach‟s Alpha coefficient is the following:
If 0,00 ≤α < 0,40, then the scale is not reliable. If 0,40 ≤α < 0,60 then the scale has low reliability. If 0,60 ≤α < 0,80 then the scale is very reliable. If 0,80 ≤ α < 1,00 then the scale is highly reliable (Alpar, 2006; Özdamar, 2013).
data. This method analyse mutual relations within
several variable and explains these variables in terms of their common determinant properties (factors).
Factor analysis included KMO and Bartlett tests. KMO, was used to determine whether sample size is enough to do factor analysis or not and Bartlett test was applied to determine whether multivariate normality assumption occurred or not. After the tests, it is expected that KMO value is close to 1 and level of significance for Bartlett test is p<0,05 (Altunışık, R., Coşkun, R., Bayraktaroğlu, S., &Yıldırım, E., 2012). After this step, factor analysis is done in order to determine sub-dimensions of the scale. Next, factors are subject to reliability test one by one. In addition, variance declaration ratios of the factors are examined. The results were evaluated 95% reliability interval, p<0,05 level of significance and p<0,01 p<0,001 high level of significance.
Reliability Analysis
Reliability analysis of Attitude Scale on Economy Education Towards Teacher Candidates of Social Studies was done through test-retest and item analysis methods (Table 1).
Significant difference was observed between the point averages of preliminary and final tests of items7 “Economic class will be very beneficial in my teaching career” 21 “I have a solid
knowledge of mathematics” and 33 “The instructor of the class knew what to expect from me”.
Item Analysis
After the first reliability analysis of 50 items, Cronbach's Alpha reliability coefficient was found .938. The first reliability analysis revealed that the items 9, 11, 18, 20, 21, 26, 27, 29, 30, 34, 35, 38, 39, 40, 45, 46, 47, 48 and 50 have no contribution to the scale. Therefore these items were removed from study. Consequently 15 more items were removed and 35 items remained in the scale. This time, second reliability coefficient test value rose to .939. In this phase, the items 35, 38, 45 and 48 which were believed not to contribute the scale, were removed and 31 itemsremained. The third test revealed that reliability coefficient value rose to .944. As there is no need for removal of another questions, from now on analysis were made concerning 31 items.
Exploratory Factor Analysis
In order to calculate reliability of 31 items on the Economics Education Attitude Scale, internal consistencies coefficient of “Cronbach Alpha” was calculated. General reliability of the scale was found very high (alpha=0.944). Exploratory Factor Analysis was employed in order to demonstrate construct validity of the scale. The Bartlett test (p=0.000<0.05) revealed a relationship between
(KMO=0.936>0,60) identified that sample size was
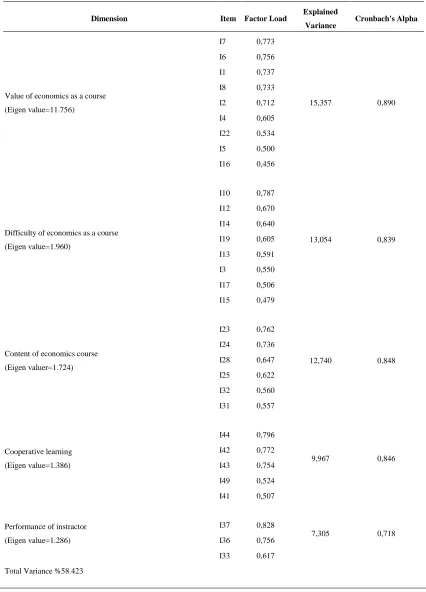
enough for factor analysis. During factor analysis, the varimax method was chosen and therefore the structure of the relationship between factors remained same. Aftermath factor analysis, the variables explained 58.423 % of the total variance. They were classified under 5 factors. According to alpha values concerning reliability and variance value, it was understood that Economics Education Attitude Scale is a valid and reliable tool. Factor structure of the scale is shown Table 2.
In assesing factor analysis of Economics Education Attitude Scale, handling factors whose self-value is more than one, high factor loads which show significance of variables within the factors and difference of factor loads for the same variable were paid attention. The highness of reliability coefficients and explained variance ratios showed that the scale has a strong factor structure (DeVillis, 2011; Tavşancıl, 2014). The first factor’s items were examined. For the reliability of 9 factors, which constitute value of economics as a course, alpha was found 0.890 and explained variance value was identified 15.357 %. The second factor’s items were examined. For the reliability of 8 factors, which constitute difficulty of economics as a course, alpha was found 0.839 and explained variance value was identified 13.054 %. The third factor’s items were examined. For the reliability of 6 factors, which constitute content of economics
course, alpha was found 0.848 and explained variance value was identified 12.740 %. The fourth factor’s items were examined. For the reliability of 5 factors, which constitute the factor based upon learning by cooperation, alpha was found 0.846 and explained variance value was identified 9.967 %. The fifth factor’s items were examined. For the reliability of 3 factors, which constitute the performance of the instructor, alpha was found 0.718 and explained variance value was identified 7.305 %.
Confirmatory Factor Analysis
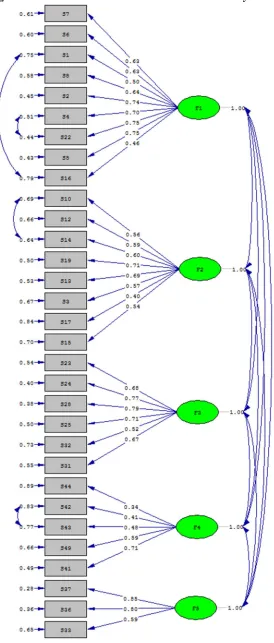
According to the exploratory factor analysis results of Economics Education Attitude Scale, the theoretically constructed 5 factor model consisting of 31 items was tested through confirmatory factor analysis (CFA). CFA, which was applied 31 items, all items were acquired positive factor loads. Therefore, CFA tested the model consisting of 31 items and five potential variables. As a result, acquired goodness of fit indexes GFI (Goodness of Fit Index), AGFI (Adjusted Goodness of Fit Index), CFI (Comparative Fit Index), NFI (Normed Fit Index),
RMSEA (Root-Mean-Square Error of
GFI=0,96; CFI=0,95; AGFI=0,94; NFI=0,94;
NNFI=0,95; SRMR=0,061
The Chi-square test tests the hypothesis “there is no difference between covariance matrix and factor covariance matrix” (Özdamar, 2013). Chi-square statistics were considered as shortcoming of goodness of fit(Stapleton, 1997). Relatedly small statistical values indicate that model is compatible with the observational structure whereas big statistical values indicate that the model is incompatible with the observational structure; in other words it does not adequately explain the structure observed. However, Chi-square statistics is an accumulated statistics; as the number of variables increases, the value is higher. Therefore Chi-square degree of freedom is used. If this value is lower than 5, then the model has goodness of fit; if it is lower than 3, he model has very goodness of fit (Diamantopoulos, Siguaw, &Siguaw, 2000; Seçer, 2013; Byrne, 2014). In this study, Chi-square degree of freedom values were found lower than 5; so we can say that the model is compatible with the observed structure (χ2/df=2,52).
Goodness of fit indexes is generally measurements of the sum of variances and covariences which are explained by the model. Coefficient of determination is calculated in multiple regressions R². It can be said that the more goodness of fit values get close to 1, the more they
are compatible. For goodness of fit values, values between 0,90 and 0,95 are acceptable; if they are over 0, 95 then they are highly fit (Dickey, 1996; Stapleton, 1997; Byrne, 2014).On the other hand, if model’s error indexes vary between 0,08 and 0,05, then model is acceptable. If they are lower than 0,05, then the model is good. If RMSEA index (Root-Mean-Square Error of Approximation) is close to 0,00, then there goodness of fitness is high. If RMSEA is lower than 0,05, then the model’s fitness is perfect(Browne &Cudeck, 1993; Berberoğlu&Uygun, 2012). Uygun, Şahin&Okur (2010) also accepted SRMS values lower than 0.08 as indicators of fitness. In the light of this information, the suggested model’s general fitness is good. In CFA, saturated model was obtained through using Modification Indexes. The errors of items S42-S43; S1-S16; S4-S22 and S10-S14 were correlated in the structure of model. Therefore these match-ups indicated that these question pairs are theoretically close to each other. Confirmatory Factor Analysis Standardized Solution value vary between 0,38 and 0,98 and it was observed that their t-tests were significant (Figure 1-2)
CONCLUSION AND SUGGESTIONS
time these decisions determine their fate of lives.
The aforesaid decision directly influences the societies that individuals live in. It can be said that the probability of serious social and economic problems is high in societies where individuals making wrong economic decisions. Therefore, right decisions on economics are crucial.
Although economics is important in daily life, as a scientific field little is known about it. The complexity of economic events and the discipline of economics in our country and world make economics hard to be understood by everyone. However this does not mean that people are not interested in economics. Thus, in today’s world individuals with different identities act in economics itself. Having the identities of citizen, labourer, official, shopkeeper or businessman, each individual makes economic decisions. Therefore it is likely to make mistakes when economics is only considered about spending or saving money. Instead, it would be better to treat economics as a social science investigating human behaviours. The necessity of treating economics as a social science also reveals its position as a course in the discipline of social studies. Thus, each individual has his or her own economic world and this world begins to form at very early ages. When individual reaches to school age and become a student, this world continues to develop and take form. Teacher, voluntarily or involuntarily, play a decisive role in
this process. They seek ways to transfer more knowledge to students. Thereby, they contribute to development of their attitudes towards economics. They do not implant an idea through teaching the basics of economics and apply these to discussions concerning economic issues and institutions but they provide basic information to students to make decisions on vital subjects. Therefore the more students get knowledgeable about economic concepts, the more they like the topic and consequently acquire more information. Students having no opportunities of economic education and increase their understanding of economics will probably pay no attention to the subject and their own economic worlds. As one of the aims of the discipline of social studies is to improve student skills for solving daily life problems, it is necessary to take measurements to prevent students from doing research on economics and consequently from being indifferent to their daily life problems.
Test- retest applications were made in two weeks
intervals and after reliability analysis, Cronbach’s Alpha value was calculated .944. In the light of the findings of the second reliability analysis, exploratory factor analysis, (KMO=0.936>0,60), it was identified that sample size was enough for factor analysis. Then a 5 factor structure consisting of 31 items was obtained. Exploratory factor analysis result of the measurement tool was tested by confirmatory factor analysis and Chi-square values were found significant. Goodness indexes were found as follows: RMSEA=0,059; GFI=0,96; CFI=0,95; AGFI=0,94; NFI=0,94; NNFI=0,95; SRMR=0,061. Statistical results confirmed that Economics Education Attitude Scale toward Social Sciences Teacher Candidates is a highly valid and reliable measurement tool. Therefore this measurement tool can be used in social sciences educators’ and particularly social studies teacher candidates’ studies on economics. In this context, it is suggested that the scientific value of this measurement tool should be increased by different researches through validity and reliability studies in different samples.
REFERENCES
Allgood, S.,&Walstad, W. B. (1999). The longitudinaleffects of economiceducation on
teachersandtheirstudents. Journal of
EconomicEducation,30(2), 99-111.
Alpar, R. (2006). Uygulamalı Çok Değişkenli İstatistiksel Yöntemlere Giriş 1. Ankara:
Nobel Yayın Dağıtım.
Altunışık, R., Coşkun, R., Bayraktaroğlu, S. ve Yıldırım, E. (2012). Sosyal Bilimlerde Araştırma Yöntemleri. SPSS Uygulamalı. Sakarya: Sakarya
Yayıncılık.
Anderson, G., Benjamin, D., &Fuss, M. A. (1994). The determinants of success in universityintroductoryeconomicscourses. Journal of
EconomicEducation, 25(2), 99-119.
Armento, B. J. (1983). A Study of the Basic
EconomicConceptsPresented in DEEP
CurriculumGuides, Grades 7-12. Journal of
EconomicEducation, 14(3), 22-27.
Armento, B. J.,Rushing, F. W. &Cook, W.
A. (1996). An
ApproachtoIssues-OrientedEconomicEducation. 211-219. in Handbook on TeachingSocialIssues. Edit. By R. W. Evans, D. W. Saxe. NCSS Bulletin 93. NationalCouncilfortheSocialStudies, Washington, D. C.
Bachan, R.,&Reilly, B. (2003). A comparison of academicperformance in A-leveleconomicsbetweentwoyears. International
Review of EconomicsEducation, 2(1), 8-24.
Bach, G. L.,&Saunders, P. (1965). EconomicEducation:
Aspirationsandachievements. The
Ballard, C. L.,& Johnson, M. F. (2004).
Basic mathskillsandperformance in an
introductoryeconomicsclass. Journal of
EconomicEducation, 35(1), 3-23.
Bayhan, P., Yükselen, A. &Kaysılı K. B. (2007). Çocukların Ekonomiyle İlgili Kavramlara Yönelik Algılarının Yaşlara Göre İncelenmesi.
Eğitim ve Bilim. 32(143). 3-11.
BeckerJr, W. E. (1983a).
Economiceducationresearch: Part I,
issuesandquestions. Journal of EconomicEducation, 14(1), 10-17.
BeckerJr, W. E. (1983b).
EconomicEducationResearch: Part II, New Directions in Theoretical Model Building. Journal
of EconomicEducation, 14(2), 4-10.
BeckerJr, W. E. (1983c).
Economiceducationresearch: Part III,
statisticalestimationmethods. Journal of EconomicEducation, 14(3), 4-15.
Becker, W.,Greene, W., &Rosen, S. (1990).
Research on
highschooleconomiceducation. Journal of
EconomicEducation, 21(3), 231-245.
Benedict, M.E. &Hoag, J. (2002).
Who’safraid of theirEconomicsclasses?
WhyarestudentsapprehensiveaboutIntroductoryEco nomics Courses? An empiricalinvestigation. The
American Economist, 46(2), 31-44.
Berberoğlu, E. O. & Uygun, S. (2012). Çevre Farkındalığı-Çevre Tutumu Arasındaki
İlişkinin Yapısal Eşitlik Modeli ile sınanması.
Uludağ Üniversitesi Eğitim Fakültesi Dergisi,
25(2), 459-473.
Berti, A.E.,Bombi, A. S. & Beni, R. D. (1986). AcquiringEconomicNotions: Profit.
International Journal of Behavioral Development,
9(1), 15-29.
Bonesrønning, H. &Opstad, L. (2012). How
Much is Students’
CollegePerformanceAffectedbyQuantity of Study?
International Review of Economics Education,
11(2), 46-58.
Borden, L. M., Lee, S. A., Serido, J., &Collins, D. (2008). Changingcollegestudents’
financialknowledge, attitudes,
andbehaviorthroughseminarparticipation. Journal
of FamilyandEconomicIssues, 29(1), 23-40.
Bozdoğan, A. M. ve Öztürk, Ç. (2008). Coğrafya ile İlişkili Fen Konularının Öğretimine Yönelik Oz-Yeterlilik İnanç Ölçeğinin Geliştirilmesi. Necatibey Eğitim Fakültesi Elektronik Fen ve Matematik Eğitimi Dergisi, 2(2),
66-81.
Breeden, C.,&Lephardt, N. (2005). Changes
in studentattitudestowardthe market
systemandtheintroductorymicroeconomicscourse. J
Browne, M. W.,&Cudeck, R. (1993).
Alternativeways of assessing model fit. In K. A. Bollen& J. S.
Long (Eds.), Testingstructuralequationmodels(pp. 136-162). Newbury Park, CA: Sage
Byrne, B. M.
(2014). Structuralequationmodelingwith LISREL, PRELIS, and SIMPLIS: Basic concepts, applications, andprogramming. PsychologyPress.
Charkins, R. J.,O'Toole, D. M., &Wetzel, J.
N. (1985).
Linkingteacherandstudentlearningstyleswithstudent
achievementandattitudes. Journal of
EconomicEducation, 16(2), 111-120.
Chen, J. & Lin, T. F. (2012). Do Supplemental Online RecordedLectures Help StudentsLearnMicroeconomics? International Review of Economics Education, 11(1), 6-14.
Contreras, S.,Badua, F. &Adrian, M. (2012). Peer Effects on Undergraduate Business StudentPerformance. International Review of EconomicsEducation, 11(1), 57-65.
Culbertson, J. M. (1987). A Realistic
International Economics. Journal of
EconomicEducation, 18(2). 161-175.
Dalziel, P. (2011). Schumpeter’s ‘Vision’ andtheTeaching of Principles of Economicsto Resource Students. International Review of
Economics Education, 10(2), 63-71.
Demir, S. B. ve Akengin, H. (2010). Sosyal Bilgiler Dersine Yönelik Bir Tutum Ölçeğinin Geliştirilmesi: Geçerlik ve Güvenirlik Çalışması.
E-International Journal of EducationalResearch,
1(1), 26-40.
Deveci, H. (2002). Sosyal Bilgiler Dersinde
Probleme Dayalı Öğrenmenin Öğrencilerin Derse
İlişkin Tutumlarına, Akademik Başarılarına ve Hatırlama Düzeylerine Etkisi. Yayınlanmamış
Doktora Tezi, Anadolu Üniversitesi Eğitim Bilimleri Enstitüsü, Eskişehir.
DeVillis, R. F. (2011). Scale Development:
Theoryand Applications. SAGE Publications Inc.
Diamantopoulos, A.,Siguaw, J. A., &Siguaw, J. A. (2000). Introducing LISREL: A
guidefortheuninitiated. Sage.
Diamond, J. (2006). Çöküş. Medeniyetler Nasıl Ayakta Kalır ya da Yıkılır? Timaş Yayınları.
Dickey, D. (1996).Testing The Fit of
OurModels of Psychological Dynamics Using ConfirmatoryMethods: An IntroductoryPrimer.
(Advances in SocialScienceMethodology, 4 içinde. Editör: Bruce Thompson). London: JAI press Ltd.
Durden, G. C.,&Ellis, L. V. (1995). The effects of attendance on studentlearning in
principles of economics. The
AmericanEconomicReview, 85(2), 343-346.
Durmuş, B.,Yurtkoru, E. S., & Çinko, M. (2012). Sosyal Bilimlerde SPSS'le Veri Analizi.
Egbert, H. &Mertins, V. (2010). Experiential
Learning withExperiments. International Review of
Economics Education, 9(2).59-65.
Fraenkel, J. R. (1987).
Towardimprovingresearch in
socialstudieseducation.Theory&Research in SocialEducation, 15(3), 203-222.
Geerling, W. (2012). Bringingthe ‘DismalScience’ to Life: TeachingEconomics Through Media. International Review of Economics
Education, 11(2), 81-86.
Gleason, J.,& Van Scyoc, L. J. (1995). A report on theeconomicliteracy of adults. Journal of
EconomicEducation, 26(3), 203-210.
Güven, B. (2003). İlköğretim 5. Sınıf Sosyal Bilgiler Dersinde Alan Bağımlılık-Alan Bağımsızlık Bilişsel Stil Boyutlarına Uygun Olarak Hazırlanan Öğretim Etkinliklerinin Akademik Başarı ve Tutumlar Üzerindeki Etkisi. Yayınlanmamış
Doktora Tezi, Anadolu Üniversitesi Eğitim Bilimleri Enstitüsü, Eskişehir.
Hadsell, L. &MacDermott, R. (2012). FacultyPerceptions of Grades: Resultsfrom a NationalSurvey of EconomicsFaculty. International
Review of EconomicsEducation, 11(1), 16-27.
Highsmith, R. (1974). A
studytomeasuretheimpact of in-service institutes on thestudents of teacherswhohaveparticipated.
Journal of EconomicEducation, 5(2), 77-81.
Hodgin, R. F. (1984). Information
theoryandattitudeformation in
economiceducation. Journal of
EconomicEducation, 15(3), 191-196.
Jaworski, T.,Vernon, L. S. & Wilson, B. J.
(2010). DiscoveringEconomics in
theClassroomwithExperimentalEconomicsandtheSc ottishEnlightenment. International Review of Economics Education, 9(2).10-30.
Karadeniz, C. (2005). “Sosyal Bilgiler Öğretmen Adaylarının Coğrafya Alanına İlişkin Öz Yeterlik İnancı” Ölçeğinin Geliştirilmesi: Geçerlik ve Güvenirlik Çalışması. Ondokuz Mayıs Üniversitesi Eğitim Fakültesi Dergisi, 20, 63-69.
Karstensson, L.,&Vedder, R. K. (1974). A
note on attitude as a factor in
learningeconomics. Journal of EconomicEducation, 5(2), 109-111.
Kauper, D. (2012). Teaching Profit Seeking as the Source of Growth. International Review of
Economics Education, 11(2), 64-77.
Kennedy, M. H. (2012). Using Online Courseware to Play a Simulation Illustrating the
Concept of Moral Hazard in Health
Care.International Review of Economics Education, 11(1), 67-76.
Kneppers, L.,Boxtel, C. V. &Wolters, B. V.
H. (2012). The Road to Transfer:
Economics in Secondary School. International
Review of EconomicsEducation, 11(1), 36-49.
Kochanski, T. (2012).
TowardTeachingMarkets as ComplexSystems: A Web BasedSimulationAssignmentImplemented in Netlogo. International Review of Economics
Education, 11(2), 102-112.
Lopus, J. S. (1997). Effects of thehighschooleconomicscurriculum on learning in
thecollegeprinciplesclass. Journal of
EconomicEducation, 28(2), 143-153.
Lynch, G. J. (1990). The effect of
teachercoursework on studentlearning:
Evidencefromthe TEL. Journal of
EconomicEducation, 21(3), 287-296.
Martorella, P. H.,Beal, C. M. &Bolick, C.
M. (2005). TeachingSocialStudies in
MiddleandSecondary Schools. Pearson Merrill
PrenticeHall.
Mearman, A.,Wakeley, T., Shoib, G. & Don,
W. (2011). DoesPluralism in
EconomicsEducationMakeBetterEducated,
HappierStudents? A Qualitative Analysis.
International Review of Economics Education,
10(2), 50-59.
Miller, S. L.,&VanFossen, P. J. (2008). 16 Recentresearch on theteachingandlearning of pre-collegiateeconomics. (Ed. Levstik&Tyson)
Handbook of research in socialstudieseducation,
284-300.Routledge.
Myatt, A.,&Waddell, C. (1990). An
approachtotestingtheeffectiveness of
theteachingandlearning of economics in highschool. Journal of EconomicEducation, 21(3), 355-363.
NationalCouncilfortheSocialStudies (1994).
CurriculumStandardsforSocialStudies. Washington,
DC.
O'Brien, M. U.,&Ingels, S. J. (1987). The
economicsvaluesinventory. Journal of
economiceducation, 18(1), 7-17.
Orlov, A.,&Roufagalas, J. (2012). Performance Determinants in Undergraduate Economics Classes: The Effet of Cognitive Reflection. International Review of Economics
Education, 11(2).28-44.
Özdamar, K. (2013). Paket Programlar ile İstatistiksel Veri Analizi. Cilt 1. Eskişehir: Nisan Kitabevi.
Öztürk, Ç. (2008). Coğrafya Öğretiminde Gezi-Gözlem Tekniğini Kullanabilme Öz-Yeterlilik
İnanç Ölçeğinin Geliştirilmesi. Ondokuz Mayıs
Üniversitesi Eğitim Fakültesi Dergisi, 25, 13-23.
Parker, W. C. (2001). SocialStudies in
ElementaryEducation. Merrill PrenticeHall.
Salemi, M. K.,Siegfried, J. J., Sosin, K., Walstad, W. B., &Watts, M. (2001). Research in economiceducation:
Saunders, P. (1980). The lastingeffects of
introductoryeconomicscourses.Journal of
EconomicEducation, 12(1), 1-14.
Saunders, P.,&Gilliard J. V. (1995).A
Framework for Teaching Basic Economic Concepts with Scope and Sequence Guidelines, K-12.National Council on Economic Education
Report. 177p.
Schug, M.,&Walstad, W. (1991). Teachingandlearningeconomics. InHandbook of research on socialstudiesteachingandlearning,
(411-419). Ed. Shaver, J. P. New York: Macmillan. Seçer, İ. (2013). SPSS ve LİSREL ile pratik veri analizi.Ankara: Anı Yayıncılık.
Singer, A. J. (2003).
SocialStudiesforSecondary Schools.
LawranceErlbaumAssociates, Publishers.
Soper, J. C.,&Walstad, W. B. (1983). On
measuringeconomicattitudes.Journal of
EconomicEducation, 14(4), 4-17.
Stapleton, C. D. (1997). Basic
conceptsandprocedures of confirmatoryfactoranalysis.
EducationalResearchAssociation, Reports-Evaluative (142), Speeches / Meeting Papers (150). Tavşancıl, E. (2014). Tutumların Ölçülmesi
ve SPSS ile Veri Analizi. Ankara: Nobel Yayınları.
Torrent, R. R.-I. (2011). Using Problem‐based Learning forIntroducing Producer Theoryand Market Structure in Intermediate
Microeconomics1. International Review of Economics Education, 10(1), 14-25.
Uygun, S. ,Şahin Ç., &Okur E. (2010). “Development Study of Sensitivity Scale Intended to
Teaching Job”, Second International Symposium
on Sustainable Development, June 8-9, 2010, Sarajevo.
vanWyk, M. M. (2012). MeasuringStudents’ AttitudestoEconomicsEducation: A Factorial Analysis Approach. Journal of SocialSciences, 31(1), 27-42.
Wallen, N. E.,&Fraenkel, J. R. (1988). An analysis of socialstudiesresearchover an
eightyearperiod. Theory&Research in
SocialEducation, 16(1), 1-22.
Walstad, W. B.,&Soper, J. C. (1982). A Model of Economics Learning in the High Schools.
Journal of EconomicEducation, 13(1), 40-54.
Walstad, W. B.,&Soper, J. C. (1988). A Report Card on theEconomicLiteracy of U.S. High School Students. The AmericanEconomicReview, 78(2), 251-256.
Walstad, W.,&Watts, M. (1985). Teachingeconomics in theschools: A review of surveyfindings. Journal of EconomicEducation, 16(2), 135-146.
Wan, C. D.,&Cheo, R. (2012). Determinants of Malaysian and Singaporean Economics
Performance.International Review of Economics
Education, 11(2).7-20.
Weisbrod, B. A. (1979). Research on EconomicEducation: Is ItAskingthe Right Questions?. The AmericanEconomicReview, 69(2), 14-21.
Wetzel, J. N., Potter, W. J., &O'Toole, D. M. (1982). The influence of learningandteachingstyles
on studentattitudesandachievement in
theintroductoryeconomicscourse: A
casestudy. Journal of EconomicEducation, 13(1), 33-39.
Yankelovich, Skelly, & White, inc. (1981). NationalSurvey of EconomicEducation, 1981: GradesSix Through Twelve.
Table 1. Test-Retest Findings on the Basis of Items(n=41)
Test Retest
Z p
Mean Sd Mean Sd
1.I will use what I learnt from economics class throughout my entire life. 3,320 1,171 3,220 1,215 0,942 0,352 2. The graphics I learnt from economics class helps me to understand real
world issues better. 3,200 1,054 3,200 1,123 0,000 -
3. I like economics because it’s easy. 2,370 0,968 2,270 1,073 0,598 0,553 4. Gathering knowledge I gathered from economics class provide me
better job opportunities in the future. 3,030 1,102 2,920 1,075 0,561 0,578 5. Economics is suitable for me as a lesson. 2,800 1,018 2,750 1,056 0,321 0,750 6. I will make use of what I learnt from the economics class in my
teaching life. 3,800 0,901 3,660 0,911 1,000 0,323
7.Economic class will be very beneficial in my teaching career. 3,640 0,932 3,330 0,927 2,508 0,017
8. I will make use of a lot what I learnt from economics class in my
teaching life. 3,330 1,095 3,250 1,080 0,552 0,584
9. I had basic knowledge about economicsclass before taking it. 3,000 1,095 2,680 1,128 1,394 0,171 10. Economics isn’t hard as a class. 2,830 1,200 2,710 1,226 0,702 0,487 11. There isn’t much knowledge to learn from graphics that are presented
in the economics class. 2,340 1,196 2,460 1,027 -0,636 0,529
12. Understanding the notions and theories of economy are easy. 2,930 1,058 2,590 1,024 1,861 0,070 13. I can understand economics formulas and apply them in real life. 2,970 1,135 3,180 1,211 -1,213 0,232 14. Lots of students will find economics easy as a class. 2,610 0,919 2,320 1,059 1,636 0,110 15. I don’t like economics as a lesson because it challenges my mental
abilities. 2,610 1,046 2,490 1,186 0,646 0,522
16. Economics enable me to think about current controversial issues 3,380 1,042 3,080 1,285 1,638 0,110 17. My economics knowledge level ishigh enough to apply this knowledge
to my teaching technique. 2,540 1,043 2,460 0,989 0,453 0,654
18. My calculating level is high enough to arrange and analyze data. 3,410 1,048 3,200 1,327 1,198 0,238 19. I have capacity to understand economics class. 3,880 0,966 4,100 0,744 -1,548 0,130 20. I hate economics because I hardly pass the lesson. 2,330 1,309 2,520 1,240 -0,781 0,440 21. I have a solid knowledge of mathematics. 2,550 1,280 2,170 1,107 2,152 0,038
22. The economics knowledge that is gathered from different sources helps
me to understand lesson. 3,460 1,051 3,290 1,123 0,980 0,333
23. I like to read articles written about economics. 2,510 1,003 2,540 1,051 -0,138 0,891 24. I find economics topics very interesting and amusing. 2,410 0,865 2,290 0,901 0,696 0,491 25. Learning economics subjects relaxes me. 2,760 1,179 2,490 1,003 1,426 0,162 26. I didn’t feel nervous or be frustrated during the economics exams. 2,510 1,143 2,760 1,044 -1,056 0,298 27. There aren’t many topics in this lesson to be learnt. 2,800 1,159 2,520 0,847 1,478 0,147 28. Studying economics satisfies to me a lot. 2,270 0,905 2,350 0,921 -0,595 0,555 29. I usually did preparetions before coming to class. 2,540 1,120 2,390 1,115 0,746 0,460 30. I usually read some articles and writings about economics before the
class. 2,120 0,939 1,820 0,675 1,864 0,070
31. I did some regulations to learn some topics completely. 2,740 1,163 2,490 1,233 1,326 0,193 32. I really like theoretical content of economics. 2,710 1,123 2,410 1,048 1,702 0,096 33. The instructor of the class knew what to expect from me. 2,770 0,974 2,350 1,099 2,102 0,042
34. The instructor of the class was really good at explaining topics (he
gave us comprehensible instructions). 2,460 1,098 2,270 1,184 1,091 0,282 35. The instructor of the class dominated the lesson completely (he/she
specified the framework or extent very well). 2,590 1,245 2,370 1,113 1,120 0,269 36. The instructor of the class chose the hard way to make the lesson
interesting (he/she adopted constructive teaching method). 2,020 1,107 1,980 1,107 0,247 0,806 37. The instructor of the class gave me instructive and constructive
feedbacks. 2,150 1,195 2,170 1,116 -0,136 0,893
38. Lecturers from school of business administration should not teach
economics. 3,100 1,497 3,070 1,367 0,094 0,926
39. I care what students have to say about the lesson especially
cooperation. 3,980 1,060 4,000 1,025 -0,117 0,907
43. The economics class developed my analyzing ability. 2,730 1,154 2,830 1,196 -0,520 0,606 44. I developed my research ability with economics class. 2,730 1,096 2,760 1,200 -0,119 0,906 45. Economy is an important part of daily life and economics class has to
be taught in this context. 3,830 0,946 3,710 1,101 0,696 0,491
46. An economics education starting from childhood is a necessity due to
consumption frenzy in Turkey. 4,120 0,939 4,120 1,114 0,000 -
47. Societies confront with conflicts between limitless demands and limited sources and these confrontations constitute economics’ core content.
4,150 0,691 4,170 0,972 -0,151 0,881
48. A good economics education will help me to take accurate economy
decisions in my profession and private life. 3,900 0,871 3,880 0,992 0,124 0,902 49. I learnt to discuss economy concepts. 3,050 0,887 2,770 1,202 1,380 0,176 50. The purpose of economics education should be to train the students on
Table 2. Factor Structure of Economics Education Attitude Scale
Dimension Item Factor Load Explained
Variance Cronbach's Alpha
Value of economics as a course
(Eigen value=11.756)
I7 0,773
15,357 0,890
I6 0,756
I1 0,737
I8 0,733
I2 0,712
I4 0,605
I22 0,534
I5 0,500
I16 0,456
Difficulty of economics as a course
(Eigen value=1.960)
I10 0,787
13,054 0,839
I12 0,670
I14 0,640
I19 0,605
I13 0,591
I3 0,550
I17 0,506
I15 0,479
Content of economics course
(Eigen valuer=1.724)
I23 0,762
12,740 0,848
I24 0,736
I28 0,647
I25 0,622
I32 0,560
I31 0,557
Cooperative learning
(Eigen value=1.386)
I44 0,796
9,967 0,846
I42 0,772
I43 0,754
I49 0,524
I41 0,507
Performance of instractor
(Eigen value=1.286)
I37 0,828
7,305 0,718
I36 0,756
I33 0,617