To Study the Data Mining Applications in Higher educational
System
AUTHOR NAME: -
Jatinder Kaur
GUIDE NAME: -Dr. Dinesh Kumar
University College of Computer Applications
EMAIL ID: - [email protected]
ABSTRACT
Data analysis plays an important role for decision support irrespective of type of industry like any manufacturing unit and educations system. There are many domains in which data mining techniques plays an important role. This paper proposes the use of data mining techniques to improve the efficiency of higher education institution. If data mining techniques such as clustering, decision tree and association are applied to higher education processes, it would help to improve students' performance, their life cycle management, selection of courses, to measure their retention rate and the grant fund management of an institution. This is an approach to examine the effect of using data mining techniques in higher education.
Keywords: ERP; Decision Support; Data Warehousing; OLAP; Data Mining; Applications in Higher education.
INTRODUCTION
1. INTRODUCTION
Higher education institutions are interested in predicting the paths of students and alumni, thus identifying which students will join particular course programs and which students will require a large number of debates. Today, one of the biggest challenges that educational institutions face is the explosive growth of educational data and to use this data to improve the quality of managerial decisions. Data mining techniques are analytical tools that can be used to extract meaningful knowledge from these large data sets. To face these challenges different systems are used such as ERP, DWH etc.
1.1 Enterprise Resource Planning (ERP) Enterprise resource planning (ERP) integrates internal and external management information of an entire organization like finance/accounting information, manufacturing, sales, service
of institutes for student admission and corporate student’s for placements, managing internal operations like smooth conducting of classes or recruitment and motivation of human resources like faculty and staff, financial and cash flow planning, co ordination with regulatory and statutory authorities. In addition to that, institutes are also subjected to the vagaries of market forces due to stiff competition and demanding customers (students and corporate). Educational institutes need modern management practices and state of the art technology to manage their internal and external operations. Realizing such demands, software industry started developing automated solutions for educational administration.
1.2 OLTP and OLAP ERP’s
OLTP (On-Line Transaction Processing) [6] has been developed as complete ERP solution for academic institution especially targeted to engineering colleges. The primary objective of the OLTP is to facilitate students and faculty to get a robust and advanced atmosphere of learning. OLTP's academic IT Infrastructure helps us to manage thousands of students from a single integrated management control. It enables students to take up tests on various subjects and get to know their results very fast. The faculty at the same time could easily build their tests and publish them. Student’s interactions with online learning environments enable them to access online exercise work, to know their mistakes and to get teacher’s comments etc. This real-time
infrastructure monitoring and data protection solution comes with various functionalities and modules like SMS integration, e-mail communication, biometric support, payment gateway integration, shared mail folders, XML gateway integration, LDAP address book, e-mail group address and mobile mail access. These modules can be customized to the specific requirement of the institute. Its main benefits include
Scalable solution,
fully integrated with messaging, web proxy, Security and network monitoring solution
Controlled accessibility to file server and web Access
Lower cost of ownership
Table 1: Differences between OLTP and OLAP
OLTP OLAP
Application Operational: ERP, CRM, legacy apps,
Management Information System, Decision Support System
Typical Users Staff Managers, Executives
Horizon Weeks, Months Years
Refresh Immediate Periodic
Data Model Entity-Relationship Multi-Dimensional
Schema Normalized Star
Emphasis Update Retrieval
1.3 Data Warehousing
Data Warehousing is an information delivery system. It [7] is another solution specifically designed for query and analysis of information related to any educational institute. It is relational database approach rather than traditional transaction processing. Data warehouse is categorized based on its data storage. The main source of the data is cleaned, transformed, catalogued and made available for use by managers and other business professionals for data mining, online analytical processing, market research and decision support. However, the means to retrieve and analyze data, to extract, transform and load data, and to manage the data dictionary are also considered essential components of a data warehousing system. In an educational institute it plays a very important role. Its main benefits in an educational institute are listed as follows.
It provides an integrated and total view of an institute.
It makes the institute’s current and historical information easily available for the decision making.
It provides the facility to students to get their different subject notes from a web enabled database.
It provides the information about student’s attendance.
Students can get their results easily and very quickly.
It helps to provides information about faculty like how many members are there in all the different departments etc.
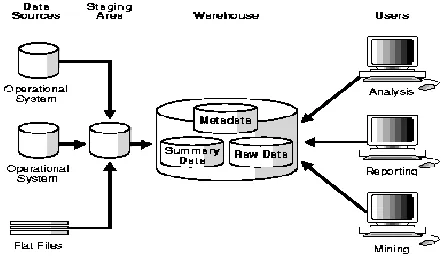
Fig. 1. Data Warehouse architecture
Fig 1 illustrates data warehouse architecture [7], which divided mainly into four parts as follows
Data sources Staging area Data storage
Information delivery
Data sources: The data in the data warehouse is derived from the operational systems that support the basic business processes of the organization. Source data coming into the data warehouse may be grouped into four broad categories like production data, internal data, external data and archived data.
Data staging: In this layer operational data is cleansed and transformed into a form suitable for placement in the warehouse for easy retrieval. Three major functions performed in data staging are data extraction, data transformation and preparing it for loading.
Data storage: In this stage data is stored in the data warehouse. The operational system of an enterprise supports only the current data but in data warehouse historical data is also kept.
Information delivery: In this stage useful
information is provided to the wide community of data warehouse users through various systems like online, intranet, internet and e-mail etc.
1.4 Data Mining
Data Mining [9] is an interdisciplinary field of astronomy, business, computer science, economics and others to discover new patterns from large data sets. The actual data mining task is to analyze large quantities of data in order to extract previously unknown patterns such as groups of data records (cluster analysis), unusual records (anomaly detection) and dependencies (association rule mining).
These patterns can then be seen as a kind of summary of the input data, and used in further analysis. Data mining tasks can be classified as
Anomaly detection (Outlier/change/deviation detection): The identification of unusual data records, that might be interesting or data errors which require further investigation.
Association rule learning (Dependency
modeling): Searches for relationships between variables. For example a supermarket might gather data on customer purchasing habits. Using association rule learning, the supermarket can determine which products are frequently bought together and use this information for marketing purposes.
Clustering: It is a task of discovering groups and structures in the data that are in some way or another "similar", without using known structures in the data.
Classification: It is the task of generalizing known structure to apply for new data. For example, an email program might attempt to classify an email as legitimate or spam.
Regression: It attempts to find a function which models the data with the least error.
2. DATA MINING TECHNIQUES
In this section, the main data mining techniques [9] used to analyze data are elaborated.
2.1 Cluster Analysis
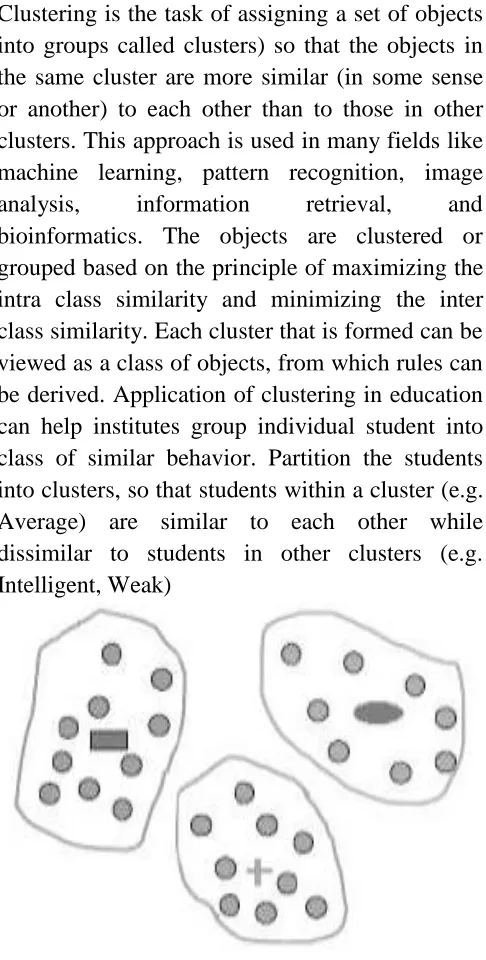
Clustering is the task of assigning a set of objects into groups called clusters) so that the objects in the same cluster are more similar (in some sense or another) to each other than to those in other clusters. This approach is used in many fields like machine learning, pattern recognition, image analysis, information retrieval, and bioinformatics. The objects are clustered or grouped based on the principle of maximizing the intra class similarity and minimizing the inter class similarity. Each cluster that is formed can be viewed as a class of objects, from which rules can be derived. Application of clustering in education can help institutes group individual student into class of similar behavior. Partition the students into clusters, so that students within a cluster (e.g. Average) are similar to each other while dissimilar to students in other clusters (e.g. Intelligent, Weak)
Fig. 2 Picture showing the partition of students in clusters
There are many clustering algorithms reported in the literature. One has to take many decisions
while choosing the appropriate algorithm for a particular problem. Some of them are
Connectivity models: These are based on
distance connectivity.
Centroid models: This algorithm represents each cluster by a single mean vector.
Distribution models: Clusters are modeled using statistic distributions, such as multivariate normal distributions used by the Expectation-maximization algorithm.
Density models: It defines clusters as connected dense regions in the data space.
Subspace models: Clusters are modeled based upon both cluster members and relevant attributes. 2.2 Decision Tree
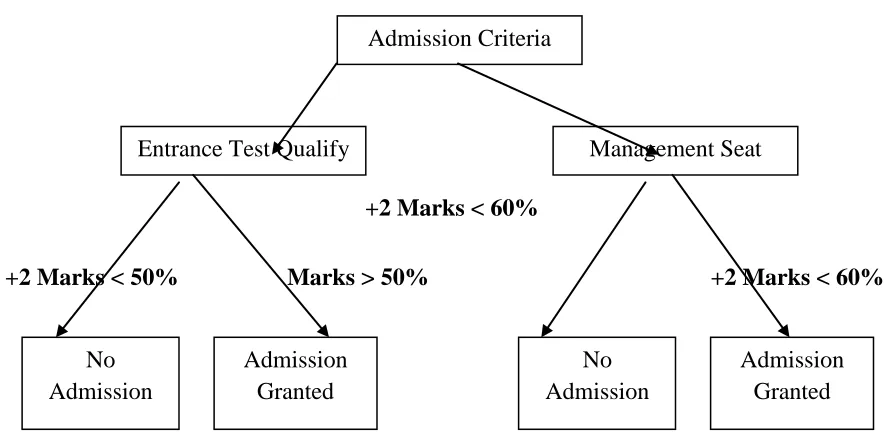
Decision tree is a decision support tool that uses a tree-like graph or model of decisions and their possible consequences, including chance event outcomes, resource costs, and utility. It is one way to display an algorithm. Decision trees are commonly used in operations research, specifically in decision analysis, to help identify a strategy most likely to reach a goal. Another use of decision trees is as a descriptive means for calculating conditional probabilities. Decision trees can be used to analyze the admission criteria of an institute as shown in fig.3. Decision trees are simple to understand and interpret and moreover they give good results even with small data. This approach may not be suitable for data including categorical variables with different number of levels.
2.3 Factor Analysis
+2 Marks < 60%
+2 Marks < 50% Marks > 50% +2 Marks < 60%
Fig. 3 Decision tree based upon admission criteria
In other words, it is possible, for e.g. variations in three or four observed variables mainly reflect the variations in fewer such unobserved variables. Factor analysis searches for such joint variations in response to unobserved latent variables. The observed variables are modeled as linear combinations of the potential factors, plus "error" terms. The information gained about the interdependencies between observed variables can be used later to reduce the set of variables in a dataset. Factor analysis originated in psychometrics and used in behavioral sciences, social sciences, marketing, product management, operations research, and other applied sciences that deal with large quantities of data. It can be of two types, exploratory factor analysis (EFA) and Confirmatory factor analysis (CFA)
Exploratory factor analysis (EFA): is used to uncover the underlying structure of a relatively large set of variables. The researcher's a priori assumption is that any indicator may be associated with any factor. This is the most common form of factor analysis.
Confirmatory factor analysis (CFA): seeks to determine if the number of factors and the loadings of measured (indicator) variables on them conform to what is expected on the basis of pre-established theory. Indicator variables are selected on the basis of prior theory and factor analysis is used to see if they load as predicted on the expected number of factors.
2.4 Regression Analysis:
In statistics, regression analysis includes techniques for modeling and analyzing several variables, when the focus is on the relationship between a dependent variable and one or more independent variables. More specifically, regression analysis helps us to understand how the typical value of the dependent variable changes when any one of the independent variables is varied, while the other independent variables are held fixed. Most commonly, regression analysis estimates the conditional expectation of the dependent variable with respect to independent variables. In such cases, the estimation target is a function of the independent variables called the Admission Criteria
Entrance Test Qualify Management Seat
No Admission
Admission Granted
No Admission
regression function. In regression analysis, it is also of interest to characterize the variation of the dependent variable around the regression function, which can be described by a probability distribution. Regression analysis is widely used for prediction and forecasting, It is used to explore relationship between independent variables and dependent variable, Regression methods mainly used are linear regression and ordinary least squares regression.
3. APPLICATIONS OF DATA
MINING IN HIGHER EDUCATION
There are many application areas of data mining like customer analytics, Agriculture, banking, Security Applications, Educational data mining, Mass surveillance, Privacy preserving etc. The main concerned area is about data mining applications in educational systems. Educational Data Mining (EDM) is an emerging discipline, concerned with developing methods for exploring the unique types of data that come from educational settings, and using those methods to better understand students, and the settings which they learn in.[A key area of EDM is mining student’s performance. Another key area is mining enrollment data. Key uses of EDM [10] include predicting student performance and studying learning in order to recommend improvements to current educational practice. EDM can be considered one of the learning sciences, as well as an area of data mining.
The main applications of EDM are listed as follows
3.1 Analysis and Visualization of Data
It is used to highlight useful information and support decision making. In the educational environment, for example, it can help educators and course administrators to analyze the students’ course activities and usage information to get a general view of a student’s learning. Statistics and
visualization information are the two main techniques that have been most widely used for this task. Statistics is a mathematical science concerning the collection, analysis, interpretation or explanation, and presentation of data. It is relatively easy to get basic descriptive statistics from statistical software, such as SPSS. Statistical analysis of educational data (logs files/databases) can tell us things such as where students enter and exit, the most popular pages students browse, number of downloads of e-learning resources, number of different pages browsed and total time for browsing different pages. It also provides knowledge about usage summaries and reports on weekly and monthly user trends, amount of material students might go through and the order in which students study topics, patterns of studying activity, timing and sequencing of events, and the content analysis of students notes and summaries. Statistical analysis is also very useful to obtain reports assessing how many minutes student worked, number of problems he resolved and his correct percentage along with our prediction about his score and performance level. Visualization uses graphic techniques to help people to understand and analyze data. There are several studies oriented toward visualizing different educational data such as patterns of annual, seasonal, daily and hourly user behavior on online forums. Some of such investigations are statistical graphs to analyze assignments complement, questions admitted, exam score, student tracking data to analyze student’s attendance, results on assignments and quizzes, weekly information regarding students and group’s activities.
3.2 Predicting Student Performance
performance, their knowledge, score, or marks. This value can be numerical/continuous (regression task) or categorical/discrete (classification task). Regression analysis is used to find relation between a dependent variable and one or more independent variables. Classification is used to group individual items based upon quantitative characteristics inherent in the items or on training set of previously labeled items. Prediction of a student’s performance is the most popular applications of DM in education. Different techniques and models are applied like neural networks, Bayesian networks, rule based systems, regression, and correlation analysis to analyze educational data. This analysis helps us to predict student’s performance i.e. to predict about his success in a course and to predict about his final grade based on features extracted from logged data. Different types of rule-based systems have been applied to predict student’s performance (mark prediction) in an elearning environment (using fuzzy-association rules). Several regression techniques are used to predict student’s marks like linear regression for predicting student’s academic performance, stepwise linear regression for predicting time to be spent on a learning page, multiple linear regression for identifying variables that could predict success in colleges courses and for predicting exam results in distance education courses.
3.3 Outlier Analysis:
According to Grubbs [11] Outlier can be defined as ―An outlying observation, or outlier, is one that appears to deviate markedly from other members of the sample in which it occurs‖. Outlier detection has been used to detect and, where appropriate, remove anomalous observations from data. Outlier detection can identify system faults and fraud before they escalate with potentially
catastrophic consequences. There are three fundamental approaches for outlier detection.
Type 1 - Determine the outliers with no prior knowledge of the data. This is essentially a learning approach analogous to unsupervised clustering. The approach processes the data as a static distribution, pinpoints the most remote points, and flags them as potential outliers.
Type 2 - Model both normality and abnormality. This approach is analogous to supervised classification and requires pre-labeled data, tagged as normal or abnormal.
Type 3 - Model only normality (or in a few cases model abnormality), this is analogous to a semi supervised recognition or detection task. It may be considered semi-supervised as the normal class is taught but the algorithm learns to recognize abnormality.
3.4 Grouping Students
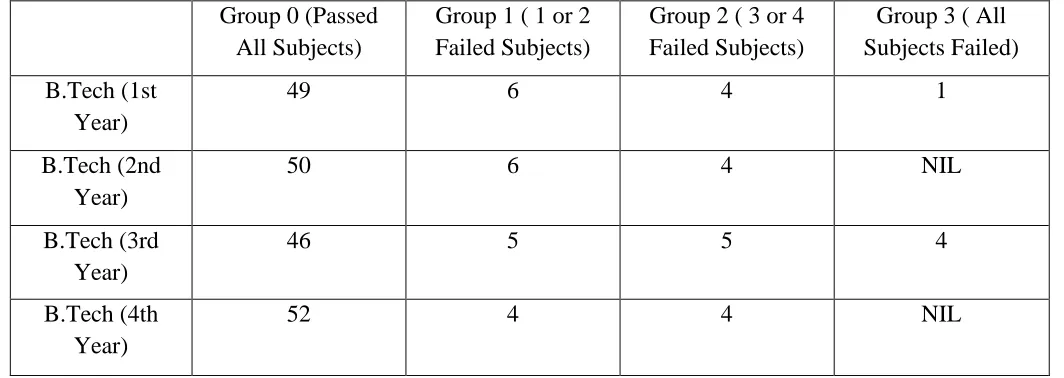
Table II: Groping of students based upon their result
Group 0 (Passed All Subjects)
Group 1 ( 1 or 2 Failed Subjects)
Group 2 ( 3 or 4 Failed Subjects)
Group 3 ( All Subjects Failed)
B.Tech (1st Year)
49 6 4 1
B.Tech (2nd Year)
50 6 4 NIL
B.Tech (3rd Year)
46 5 5 4
B.Tech (4th Year)
52 4 4 NIL
3.5 Planning and Scheduling
Planning and scheduling is used to enhance the traditional educational process by planning future courses, course scheduling, planning resource allocation which helps in the admission and counseling processes, developing curriculum, etc. Different DM techniques used for this task are classification, categorization, estimation, and visualization. The main objective of using above techniques is academic planning, predicting alumni pledges and creating meaningful learning outcome typologies. Decision trees, link analysis and decision forests have been used in course planning to analyze enrollee’s course preferences and course completion rates in extension education courses. Classification, prediction, association-rule analysis, clustering, etc have been compared to discover new explicit knowledge that could be useful in the decision-making process in higher learning institutions. Educational training courses have been planned through the use of cluster analysis, decision trees, and back-propagation neural networks in order to find the correlation between the course classifications of educational training. Decision trees and Bayesian
models have been proposed to help management institutes to explore the probable effects of changes in recruitments, admissions and courses. 3.6 Enrollment Management
coordination of efforts of multiple offices such as admissions, financial aid, registration, and other student services. Often these offices are part of an enrollment management division. Some of the typical aims of enrollment management include
Improving yields at inquiry, application, and enrollment stages.
Increasing net revenue, usually by improving the proportion of entering students capable of paying most or all of unsubsidized tuition
Increasing demographic diversity Improving retention rates
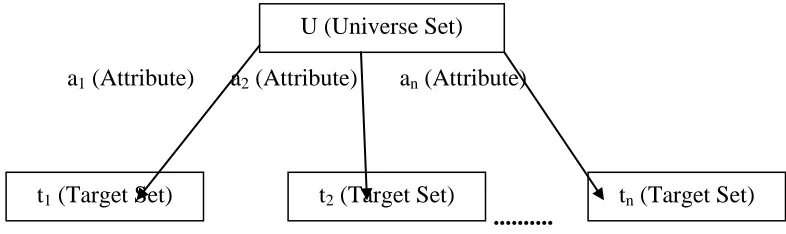
Increasing applicant pools 3.7 Target Marketing
Consider a sample universe u, which represents a sample candidate set. The DM algorithm generates T called target set. It is used by marketing agent to organize promotion and marketing campaigns. The universe u consists of a
database of various students’ attributes like name, academic profile, region etc. By using various attributes, u is successively portioned to get t1, t2 etc. which are target sets based in the corresponding partition algorithms. Fig 4 shows flow of above mentioned algorithm. An optimal portioned can also be generated in this process based upon some condition.
3.8 Management and Generation of Strategic Information
Information technology (IT) has brought a revolution in business practices and serves as a significant element in business strategies. Information systems, enabled by sophisticated technology, among subsidiaries and branches or even inter-companies, can help enterprises adapt swiftly to the ever-changing business environment, providing new forms of design, manufacture, distribution and customer services.
a1 (Attribute) a2 (Attribute) an (Attribute)
...
Fig. 4 Target marketing based upon various students attributes
In the process of application of the IT, enterprises need an efficient and mature strategic information system (SIS). SIS [13, 14] also plays an important role in educational institutions. It can be applied to facilitate academic and administrative activities in educational institutions. These systems should integrate all information into a single platform to ensure that academic and administrative activities are managed systematically. In the context of
teaching and research, SIS can facilitate the process of creating, sharing and diffusing information. Administrators in higher education face complex demands. Apart from administration of staff, student, revenues and all other resources that are applied to higher education, they also need to provide accurate and up to date information in all these areas. Thus, this can be possible only with the aid of U (Universe Set)
computer based systems. SIS information for educational group has the following subfields
Profitability analysis
High yielding program of study Low yielding program of study
Competitive intelligence on key parameters like enrollment etc
Target marketing for campaign management Data driven planning for growth of university
Student System which include their registration, study records, lecture time table, exam time table etc
Finance system which include cashier, purchase ordering, accounts payback
4. CONCLUSION AND FUTURE
SCOPE
In this paper, some important issues related to business community and education system are discussed along with their solutions. Data analysis plays an important role for any type of decision support irrespective of type of industry. Data warehousing and data mining methods for data analysis are explained in detail. Main core of this paper is to review role of data mining techniques in education system. Educational Data Mining has been introduced as an upcoming research area, Thus number of specific tools specially developed for applying DM algorithms in educational data/environments are emerging day by day.DM techniques in educational organizationshelp us to learn student performance, student behavior, carefully designing course curriculum, to motivate students and to group student depending upon various parameters. It is observed that current DM tools are too complex for educators to use and their features go well beyond the scope of what an educator may want to do. One possible solution is the development of tools that use a
default algorithm for each task and parameter-free DM algorithms to simplify the configuration and execution for non-expert users. Secondly, the DM tool has to be integrated into the e-learning environment so that results obtained with DM techniques could be easily and directly applied. Moreover, current tools for mining data pertaining to a specific course/framework may be useful to their developers only. There are no general tools or reusing tools that can be applied to any educational system. Therefore, a standardization of input data and output model are needed. Data mining techniques are useful in student marketing, selection revenue analysis, predicting student performance, planning of courses and result analysis. So, it has a wide array of applications for the higher education sector.
REFERENCES
[1] Bidgoli, and Hossein, the Internet Encyclopedia: John Wiley and Sons, 2004.
[2] Khosrow–Puor, and Mehdi, Emerging Trends and Challenges in Information Technology Management: Idea Group, 2006.
[3] Sheilds and G. Mureell, E-Business and ERP: Rapid Implementation and Project Planning: John Wiley and Sons, 2001.
[4] V.K Ramaswamy, "Data Migration
Strategy in ERP,"
http://research.ittoolbox.com/whiteapers/backoffi ce/erp/data-migration-strategies-in-erp-4620/, Retrieved 2008-04-08, 2007-09-27
[5] Walsh, and Katherine, "The ERP Security Challenge,"
RP_Security_Challenge, Retrieved 2008-01-17, Jan. 2008.www.tpc.org
[6] Paulraj and Ponniah, Data Warehousing Fundamentals: a comprehensive guide to IT professionals: John Wiley & Sons, 2001.
[7] Paul Lane, ―Oracle9i Data Warehousing Guide,‖ Release 2 (9.2), Oracle Corporation, 2001.
[8] Jiawei Han and Micheline Kamber, Data Mining- Concepts and Techniques: Elsevier Publishers, 2006.
[9] Crist´obal Romero and Sebasti´an Ventura, ―Educational Data Mining: A Review of the State of the Art,‖ IEEE Transactions on Systems, Man, and Cybernetics—Part c: Applications and Reviews, vol. 40, no. 6, 2010, pp. 601-618.
[10] F. E Grubbs, ―Procedures for detecting outlying observations in samples,‖ pp.1–21, Technometrics 11.
[11] James Black, ―Strategic Enrollment Management Revolution, ―American Association of Collegiate Registrars and Admission Officers.
[12] Richard Neill and Thabo Mokoena, ―Strategic planning, Information systems and organizational development,‖ UNESCO, International Institute for Educational Planning, pp. 1 85, 1999
[13] Zhe Lv, ―Case study: strategic information systems planning in Shanghai key universities in Yangpu district,‖ in International