Image Compression Based on Histogram
Based Thresholding
D.Gowri Sankar Reddy1, V.C.Veera Reddy2
Ph.D Student, Dept. of ECE, S.V University College of Engineering, Tirupati, India1
Professor (Retd), Dept. of EEE, S.V University College of Engineering, Tirupati, India2
ABSTRACT: Satellite image compression is vital in terms of storage capacity and transmission bandwidth. In this paper, a lossy image compression method based on histogram and adaptive thresholding is proposed to compress the LANDSAT - 8 satellite images.In the proposed method the number of thresholds are fixed in accordance with the histogram and the Peak Signal to Noise Ratio(PSNR) is improved by retaining the indices of thresholds at the decoding stage. Some images of Landsat-8 Band 3,4,5 are used for performing the compression and the performance metric PSNR is measured for three Bands. The proposed method gives descent PSNR and the method is computationally compatible with all one byte data type compilers.
KEYWORDS: PSNR, bpp,DN(digital numbers) ,Threshold.
I.INTRODUCTION
Satellite image compression involves many factors should be taken in to consideration, like Compression ratio (bpp), PSNR, memory requirements and computational time. In [1] G.K.Wallace explained JPEG compression standard which was very ubiquitous for compression standards.JPEG standard is based on DCT (Discrete Cosine Transform) and is having advantages of real transform, low memory requirement. The JPEG methods have limitations like blocking artifact at low bitrates, Huffman table requirement for low bitrates. The method JPEG 2000[2] is based on wavelet, this method offers better PSNR at low bit rates, this method has limitations like ringing effect and low resolution. In [3] Khaled sahnoun performed the satellite image compression based on the FFT, the method is computationally complex and less significant in energy compaction. In [4] it was explained that the histogram influences threshold selection and the better thresholds based on Otsu method will reduce intra and inter class variances. In [5] sujoys approach of image compression based on multilevel thresholding and the entropy was maximized using differential evolution,this method is appealing interms of entropy improvement at the same time with a limitation of computational time. In [6] J N kapur worked on gray-level picture thresholding using the entropy of the histogram. In [7] and [8] it was explored various quantization techniques for compression and signal processing. Land sat images [9] are of sizes 7811 x 7641,16bit length with the intensity variation of 0-65535. The Landsat 8 has 11 bands of data for each location and the amount of storage required will be in the order of 2GB.So memory requirements are thirsty for satellite images.
In our method we propose a method to compress 16 bit Land sat images [9 ] to size of 8 bit sizes, the proposed method uses the histogram for thresholding and the coefficients are retained in an array . The indices of thresholds are used for decoding at the decompression stage. The images are compressed from 16 bpp (Bits per pixel) to 8bpp.The merits and demerits of the proposed method are clearly explained .
II.METHOD-1
The Thresholding technique basically makes an approximation of the image histogram by properly choosing the set of thresholds, when the image is thresholded into n+1 levels only log2(n+1) bits is required to represent the image. In our work we used Three bands 5,4,3 which are the band combinations for vegetation index are used for compression .
In Fig.1 the typical histogram of the image band 5 is shown in Fig.1 and Digital Numbers (pixel values) frequency is plotted.
Fig.1
The simple method of quantization is uniform midtread with step ,Quantization characteristics as shown in Fig.2
The mid point reconstruction value output = ( index * )
Fig.2 mid tread quantizer
In this method three images of Bands 5,4,3 are uniform quantized with 256 levels and the layers stack is performed on the three layers.The images are of “uint8” datatype.
III.METHOD-2
The typical histogram of band-5 is shown in the Figure2.the figure reveals the pixel variation is from p=5744 to r =55417 the non zero pixel range is encoded with 255 levels and zero is encoded separately with the one threshold.
used for finding the vegetation index , the red indicates the healthy vegetation.The approach of retaining of thresholds resulted in significant improvement in the PSNR.The method 1 and method two allows irreversible coarse quantization, which is overcome in the proposed method by retaining the Thresholded coefficients
V. RESULTS AND DISCUSSION
The algorithm is implemented in Matlab 2013a ,intel®core(TMi5-4460) . It is seen from the table1. That the method 1 uniform quantizer is having high distortion because of uniform scaling for the entire range of pixel variation ( 0 - 65535). The PSNR is calculated from the equation 1. The reconstructed image is shown in the Fig 4.
Table.1
Image name Wave length (µm)
Colour composite
PSNR in db
Band 5 0.85 – 0.88 RED 47.9 Band 4 0.64 - 0.67 GREEN 47.8 Band 3 0.53 – 0.59 BLUE 47.9
PSNR = 10log10(R^2/MSE) (1)
Where MSE is mean square error, R=65535 for 16bit images.
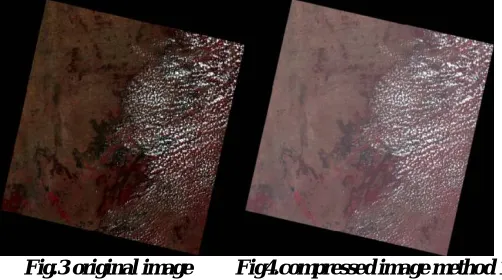
Fig.3 original image Fig4.compressed image method 1
It is observed from the table 2 that an improvement of nearly 10db is obtained from the method 2.The reconstructed image from the method 2 is shown in the Fig 5.
Table. 2
Image name Wave length (µm)
Colour composite
PSNR in db
Fig5.compressed image method -2
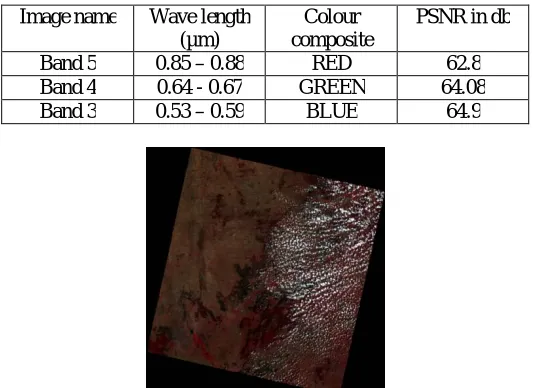
It is observed from table 3. A significant increase in the PSNR is obtained.The method 1 and method 2 allows irreversible coarse quantization, which is overcome in the proposed method by retaining the Thresholded coefficients. The average encoding time is in the order of 350 s ,This decoding process requires decoding time in the order of 5sec which is a limitation for the proposed method.we can reduce the computational time with using a skipfacator at the cost of PSNR.The reconstructed image is shown in the Fig 5.
Table .3
Image name Wave length (µm)
Colour composite
PSNR in db
Band 5 0.85 – 0.88 RED 62.8 Band 4 0.64 - 0.67 GREEN 64.08 Band 3 0.53 – 0.59 BLUE 64.9
Fig.5 Reconstructed image proposed method.
VI.CONCLUSIONS
The effects of quantization is observed and a method is proposed which can compress satellite images with compression ratio of 50 percent with descent less distortion in the reconstructed images.The method is noteworthy interms of Computational complexity, memory requirements,8 bit compatibility and PSNR.The method suffers with decoding time of 5s which is a limitation to the method.Future scope can be entropy maximization without much change in the compression time.
[4]. N.Otsu Ä threshold selection method from gray level histograms" IEEE Transactions on system,Man and cybernetics,vol9 pp62-66,1979. [5]. Sujoy Paul,BItan Bandyopadhyay "A Novel approach for Image compression Based on Multi-level image Thresholding using shannon Entropy
and Differential evolution " Proceeding of the 2014 IEE students Technology Symposium TS14IVC03 237 pp56-61
[6]. 8. J. N. Kapur, P. K. Sahoo, and A. K. C. Wong, “A new method for gray-level picture thresholding using the entropy of the histogram,” Computer Vision Graphics Image Processing, Vol. 29, 1985, pp. 273-285
[7]. S. Lloyd, "Least Squares Quantization in PCM", IEEE Trans. Information Theory, vol. 28, no. 2, pp. 129-137, 1982 [8]. R. M. Gray, "Vector quantization," IEEE ASSP Magazine, vol. 1, no. 2, pp. 4-29, Apr. 1984