The Research Progress of Parallel Visualization based on
ParaView and its application
Jie Xiong; Hao Cheng; Chenyun Zhang
(School of Electronics and Information, Yangtze University, Jingzhou 434023)
Abstract:
In the scientific computing and engineering applications, 3D visualization of massive data require high performance of computer. Parallel visualization based on PavaView is an effective solution. In this paper the research progress, the techniques of compilation and software development of ParaView are reviewed in detail, and the application progress of ParaView is introduced as well as the direction of parallel visualization of massive data based on ParaView is indicated.
Keywords
ParaView; parallel visualization; massive data; research progress
CLC number:
TP391.7
1. Introduction
3D visualization is a technique that uses computer graphics and image processing technology to convert the data in the scientific calculation process and the data of the calculation result into images, displayed on the screen and interacts with each other. In recent years, three-dimensional visualization in medical education and medical, oil exploration, meteorology, fluid mechanics, molecular biology and other fields have been widely used [1]. With the development of science and technology, the scale of computer computing has been increasing and the complexity has been improved continuously. At the same time, the numerical data generated by various scientific fields has increased dramatically, but the efficiency of the existing drawing algorithm and the level of computer hardware are completely unable to meet People demand the massive data to draw, so parallel visualization came into being[2]. Common parallel visualization solutions currently include WireGL, Chromium, Display wall, AnyGL, ParaView. Among them, WireGL [3] is developed by Stanford University, based on the Sort-first architecture and independent of the hardware platform for the graphics cluster rendering system, Chromium[3]is a workstation cluster processing API command flow
interactive rendering system , Which is a follow-up version of WireGL, WireGL and Chromium's application is not wide enough; Display wall [4] is a Sort-first parallel graphics rendering system based on reserved mode developed by Princeton University, but it is no longer updated; AnyGL[4] is developed by Zhejiang University CAD & CG State Key Laboratory to achieve large-scale mixed distribution parallel graphics rendering pipeline, but its follow-up development is slow. ParaView[5] is the most widely used and constantly updated open source parallel visualization solution, both as a single processing application, but also by distributing the data in multiple processors and parallel processing of massive data. ParaView is based on open source software VTK, is a scalable, cross-platform, open source visual parallel computing environment, can read and write a variety of data formats, support a variety of meta-objects, a variety of filters, support a variety of interactive style, support level Details (LOD). At present, ParaView has been widely used in fluid mechanics, astrophysics, structural analysis, medical research, climate science and other fields
[5,6].
2.
ParaView architecture
ParaView supports a variety of data formats and display methods, including grid rendering, surface rendering, volume rendering and other methods. Visualization consists of three basic steps: data reading, data filtering, and data rendering. First, the data is read into the visual application ParaView; then, a number of filters are selected according to the actual needs to process the data to obtain a sub-dataset feature with a particular form; finally, in the user window interface, the data With an intuitive and image of the graphic image rendering.
2.1. Framework
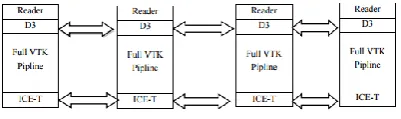
interface and visual function library between the data communication, the fourth layer is the visual core algorithm library VTK, the bottom contains the basic library OpenGL , MPI for parallel computation, IceT for image synthesis [5,6]
.
Figure 1. ParaView frame structure.
2.2. ParaView operating mechansim
ParaView is built on VTK and uses many VTK visualization algorithms and rendering methods. ParaView interface is written by QT. ParaView borrows the VTK pipeline concept, which divides the pipeline into data read, data processing, data mapping, rendering, display and so on.
ParaView uses data parallelism to draw in parallel, in which data is divided and fed into different processors. This data is parallel to the way with good scalability, better load balancing and less communication overhead. ParaView uses spatial division to ensure that the least ghost cells are produced [4].
(1) For structured meshes, ParaView automatically divides the data into uniform data and sends it to each processor. For unstructured grids, ParaView uses D3 for data partitioning. Although the user does not care whether the data is evenly divided, but also need to generate ghost cells D3 to ensure the correctness of the results.
(2) ParaView uses ICET for image synthesis, ICET is placed in the last step of the pipeline, it will perform inter-data communication. ICET is an implementation of sort-last mode. Figure 2 ParaView parallel drawing pipeline:
Figure 2. ParaView parallel diagram.
ParaView has three main logical components: the client, the data server, and the rendering server. When the ParaView starts, the client will connect to the server, in which case all three components will be in one processor. Likewise, the server can be run as a separate program and connected to the client. In this case, the service processor connects data and draws the server. The server can also be started as two separate programs: One as a data server, one as a drawing server, and the server program is parallel to the data, it can run independently on different CPUs. When the server program handles different data at different processors, the processor uses MPI to coordinate their processes. The client is responsible for the application of the user interface. The client controls the server with a serial program through the Service Manager API. The data server is built primarily by VTK's readers, sources, and filters. It is primarily responsible for reading data, generating data, processing data and drawing the geometric model that the server will display. The data server relies on partitioning data to generate ghost cells and run synchronization filters to perform data parallelism. Each data server has an identical pipelined, and each server processes the local data.
The rendering servers can run independently, so they can run the data server in the same cluster, and the rendering server is separated from the cluster with the hardware rendering resources. The number of drawing servers can not be greater than the number of data servers. The visual cluster is usually less than the number of nodes in the simulated cluster, and ParaView re-divides the geometric model on the data server before sending it to the drawing server.
3.
ParaView compilation and use
3.1. Ready to work
This article selected in the Windows operating environment, Visual Studio 2008 compiler working environment to install ParaView, because a lot of ParaView class, so use the CMake software to compile. First download cmake-3.0.0-win32-x86.exe from http://www.cmake.org/ and install it in F: \ CMake3.0 (CMake, VS2008, VTK, ParaView and the software downloaded later Installed in the same directory, so the system is better to find the path to compile); VTK installation can refer to the literature
CMake to vtk_use_parallel election), where no longer tired; Then download two files from
http://www.paraview.org/ ParaViewData-3.98.1.tar.gz and ParaView-3.98.1-source.zip;And then from http://qt-project.org/ download two documents qt-win-opensource-4.8.2-vs2008.exe and qt-vs-addin-1.1.11-opensource.exe installed directly; Then from http://www.mpich.org/ and
https://www.python.org/ Respectively download mpich-3.1.1.tar.gz and python-3.4.1.amd64.msi direct installation; Finally downloaded from
http://www.git-scm.com/ downloads Git-1.9.4-preview20140611.exe directly installed.
3.2.ParaView compilation
Create a new folder F: \ ParaView, extract the ParaView-3.98.1-source.zip to F: \ ParaView, extract the ParaViewData-3.98.1.tar.gz to F: \ ParaView \ ParaViewDATA, and in F: \ ParaView to create a new folder bin, as a compiler stored path. Then need to use CMake compiler ParaView, the source code path F: \ ParaView \ ParaView-3.98.1-source, compile the destination for the F: \ ParaView \ bin (compile, the Advanced election).
Modify the following parameters: BUILD_SHARED_LIBS selected, you can generate lib files and dll files;PARAVIEW_USE_MPI selected, the program can use MPI; Select PARAVIEW_ENABLE_PYTHON to make Python client scripts and Python programmable filters available; Select PARAVIEW_USE_VISITBRIDGE to add VisItBridge to support other file formats (requires Boost).
After modifying the CMake option, press Configure until all options are grayed out and click Generate to generate the VS project file. Use VS2008 to open the bin directory of the ParaView.sln file, right click ALL_BUILD click to generate, wait about 40 minutes to compile successfully.
From the installation process can be seen, ParaView installation path too much, it is easy to go wrong.This article to explain the way step by step, the purpose is to give readers a clear idea and reference.
3.3.Use of ParaView
Here we simply through an example to illustrate the use of the script.
Start by generating a Cone object
>>> cone = Cone()
Check the resolution is set:
>>> cone.Resolution
We can specify a value for the object when it is generated:
>>> cone = Cone(Resolution=32)
We can specify the value of any attribute when using the keyword argument: we can change the center
>>> cone.Center [0.0, 0.0, 0.0]
>>> cone.Center = [1, 2, 3]
This vector attribute sets and retrieves the support of a single element, as well as the slice (the range of elements):
>>> cone.Center[0:2] = [2, 4]
>>> cone.Center [2.0, 4.0, 3.0]
Then apply a telescopic filter for the cone:
>>> shrinkFilter = Shrink(cone)
>>> shrinkFilter.Input
<paraview.servermanager.Cone object at 0xaf701f0>
Here, we can get the information of the telescopic filter by making it updated.
>>>shrinkFilter.UpdatePipeline()
>>>shrinkFilter.GetDataInformation().GetNum berOfCells()
>>>shrinkFilter.GetDataInformation().GetNum berOfPoints()
4.
ParaView Parallel Visualization
Application Progress
4.1. Astrophysics
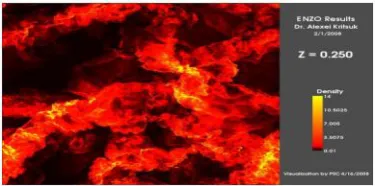
Astrophysics is the study of the physics of the universe, which includes the physical properties of the stars (photometric, density, temperature, chemical composition, etc.) and the interaction between stars and stars. Applied physics theory and methods, astrophysics to explore the structure of stars, stellar evolution, the origin of the solar system and many issues related to cosmology. Alexei Kritsuk of the University of California focuses on the formation of stars [7], which uses the Enzo cosmic simulation code to perform density calculations on a grid of 20,483 points. Each time step contains 32G of
data, the data is saved in 4096 files.
An efficient visualization of the density scheme is simply to cut the data into a time step. Alexei Kritsuk uses the ParaView batch script to cut the 2048 Z-planes and store it in a file. These files are combined into a high quality MPEG-2 video with less than 43MB. Figure 3 shows a frame in the animation.
Figure 3. Molecular cloud density animation in a frame.
Using the 256 process on 128 nodes, Cray XT3 takes three and a half hours to complete the script. In order to test the performance of the system in different parallel scale, we detect the use of different nodes and process combinations under the same script. The performance test results are shown in Table 1.
Table 1. Run the same script under different nodes and processes.
In summary, ParaView can parallel visualization of massive data, with high efficiency, high resolution and other advantages.
4.2. Engineering Applications
In the scientific engineering visualization of practical engineering application problems (concrete dam heat conduction problem analysis), the concrete dam is finished in the concrete building when the concrete is poured and needs to consider the temperature distribution of the cooling process of the concrete [8]. Zhuang Chao used ParaView and Exodus II to simulate the pouring process of concrete dams.
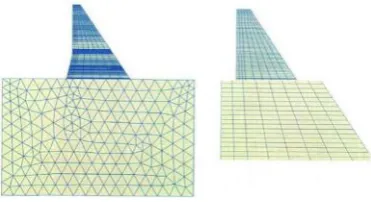
In order to show the geometric model of the concrete dam in a visual environment, ParaView needs to obtain a grid model that characterizes geometries. The mesh model contains connectivity information between nodes and grid cells. As a geometric grid model for visual postprocessing, it can be a discrete grid model of numerical analysis (finite element method and boundary element method) (As shown in Figure 4). In addition, the visualization processing of the data of the boundary element analysis results not only need to obtain the surface data of the analysis object, but also the data of the analysis results in the domain. The Exodus II supports all unit types in numerical analysis, including one-dimensional, two-dimensional and three-dimensional units (including surface elements and body units) that can be used to store and analyze the data of the geometric model representation and analysis results in ParaView visualization.
Figure 4.Discrete grid model for concrete dam analysis.
verify the feasibility and effectiveness of visualization, the boundary layer method is used for the thermal conductivity analysis of the concrete dam.
Figure 5. Schematic diagram of a gravity dam structure.
Exodus II Write the results data file. Among them, the model information is the boundary surface method to analyze the gravity dam's discrete data model information, including 11066 secondary units (including triangular elements and quadrilateral elements) and 44795 nodes. The visualization of the model information in ParaView is shown in Figure 6.
Figure 6.The face grid in the boundary element.
In summary, ParaView in the actual engineering applications can be highly efficient visual work, and then help engineers to simulate practical engineering problems.
5.
In conclusion
In this paper, the scientific data and engineering applications in the parallel data visualization of the problem, the status of ParaView, system structure, operation mechanism, compilation and development
technology, and finally studied several typical application cases. The results show that ParaView has the advantages of open source, cross platform, extensible and parallel support, and can effectively solve the problem of parallel visualization of massive data.
6. Acknowledgements
This work is supported in part by the National Science Foundation of China (No. 61273179, No. 61673006), Science and Technology Research Project of Education Department of Hubei Province of China (No. D20131206, No. B2016034, No. 20141304), and the teaching researching project of Yangtze University (No. JY2014010,JY2014042).
7. References
[1] Tang, Z., 3D data field visualization [M]. Beijing: Tsinghua University Press, 1999.
[2]Zhang,J.,Study on Key Technology of Interdisciplinary Drawing and Its Application [D]. Tianjin: Tianjin University, 2004.
[3] Liu, Z., Shi, J., Peng H., et al.Study on parallel graphics rendering system based on PC cluster [J]. Journal of System Simulation, 2006,18 (1): 70-72.
[4]Hu, J.,CFD Scalar Data Field Rendering Algorithm and Parallel Visualization Method Research and Implementation [D]. Hunan: National University of Defense Technology, 2011.
[5]Williams D,Bremer T,Doutriaux C. The ParaView Guide, Version 4[M]. USA:Kitware Inc., 2012. [6] ZHOU Zhen-huan, XIAO Ru, WU Jian-hua, et al.New Advances in ITK and VTK and Its Application [J] .Application Research of Computers, 2009,26 (6): 2027-2031.
[7]Kenneth Moreland, David Rogers, John Greenfield, et al. Large Scale Visualization on the Cray XT3 Using ParaView[A]. John P. Noe. The Cray User Group 2008 Conference[C]. Helsinki, Finland, 2008. 186-201