www.euacademic.org DRJI Value: 5.9 (B+)
Using Formal Grammars Derived from Proteins Dbs
to Describe Protein Folding
PROF. DR. NABEEL HASHEM KAGHED Ministry of Higher Education and Scientific Research Iraq MOHANNAD M. J. AL-YASIRY College of Information Technology
University of Babylon Iraq
Abstract:
In this work some levels of protein structure (primary, secondary, tertiary) have been adopted. So, it will for each level the basic rules and attributes that be describe how the protein folded from protein's building blocks to tertiary structure form in conformation space were founded, these rules were given in format of formal language grammar in order to increase the ability to understand these levels and facilitate handling it in terms of (addition, deletion, and modification), and attributes obtained from protein's DB by data mining to be a solid basis to any current or future method to deal with folding proteins in dry lab. In addition, it gives signs to indicate the progress in stages series for predicting a target protein structure either meaningful or not.
Key words: Attribute context free grammar, Protein database, energy functions, Protein Folding.
1. Introduction
physical chemistry rules. The meaning of computational methods is reproducing the nature algorithm in a computer program that could predict protein structure from amino acid sequence (Lesk 2008).
The current computational methods of protein tertiary structure prediction use scoring methods as a main tool in conformations search strategies and models selection for the target protein; the conformation/model with the lowest energy score (or highest similarity score) is then assumed to be a candidate of the target protein (L. J. McGuffin 2008).
On the other hand, the scoring methods have many disadvantages: first, it's hard to fully understand how it is derived by bioinformatics researchers from the basic physical chemistry rules, therefore it's a complex process to modify or enhance one by computer science specialist. Second, scoring methods do not help to answer the question of how and why a protein adopts its specific structure or what its role (scoring methods) in describing protein folding is. Thirdly, scoring methods must be applied on all input elements (selection pool and / or conformations space) without considering the time and storage complexity. In addition, there is no indicator about the significance for each element (Mackerell 2004), Pokala & Handel (2001), Jorgensen, & Tirado-Rives (2005).
From all above we can assume the following hypotheses: 1. Since there are three levels of protein structures (primary, secondary, tertiary), we can assume that it is possible to identify a number of key features and rules for each level (low level for protein fragments, middle level for secondary structure, high level for protein type as whole) on the basis of which the attributes are extracted from specific databases of known protein structure such as Brix2, Astral, CATH, SCOP.
2. These features and rules can be mapped into a formal language. Grammars provide us with a significant contribution to facilitate the understanding of the proteins folding process in addition to the possibility of combining these grammar with energy functions to reduce the time and storage complexities, where it will determine any of the elements as being the most significant, depending on the appropriate level of grammars and then examined using an energy function. 3. The best type of grammars that can be used to represent
the features and rules of all folding protein levels are ACF-Grammar (Attribute Context-Free Grammar).
2. The proposed system
running windows vista.
2.1. Level one:
CATH: (Orengo et al. 1997)
The CATH database is a hierarchical domain classification of protein structures in the Protein Data Bank. Protein structures are classified using a combination of automated and manual procedures. There are four major levels in this hierarchy:
o Class - structures are classified according to their secondary structure composition (mostly alpha, mostly beta, mixed alpha/beta or few secondary structures).
to their overall shape as determined by the orientations of the secondary structures in 3D space but ignores the connectivity between them. o Topology (fold family) - structures are grouped
into fold groups at this level depending on both the overall shape and connectivity of the secondary structures.
o Homologous super-family - this level groups together protein domains which are thought to share a common ancestor and can therefore be described as homologous.
This is available online (http://www.cathdb.info) and can be accessed through a user-friendly web-interface or can be downloaded via FTP.
Figure [2]. Schematic representation of the class (C), architecture (A) and topology (T) level in the CATH database. Helices are drawn in blue and strands are drawn as magenta arrows. The barrel, three-layer sandwich and roll architectures (A-level) are shown for the α−β class. Two representatives from fold families in the three-layer sandwich architecture are shown.
It's a database of protein building blocks for structural analysis, modeling and design. It is directed to identifying recurrent protein fragments, which are frequently reused as building blocks to construct proteins that were till now thought to be unrelated.
BriX contains two levels: the class level, and the fragment level. Classes can be sorted and filtered on (1) class size, (2) fragment length (from 4 to 14 residues), (3) clustering threshold describing the compactness of the classes, (4) minimum and maximum percentage of helix, loop, sheet and turn content and (5) regular expressions of the amino acid sequence and secondary structure as determined by DSSP (Dictionary of Protein Secondary Structure).
The BriX database contains fragments from over 7000 non-homologous proteins from the ASTRAL40 (Chandonia et al. 2004) (set of 7290 proteins sharing <40% of sequence homology) and WHAT IF (Vriend 1990) (set of 1259 non-redundant proteins) collection, segmented in lengths from 4 to 14 residues and clustered according to backbone similarity with a hierarchical clustering algorithm, summing up to a content of 2 million fragments per length. It is available online (http://brix.crg.es) and can be accessed through a user-friendly web-interface or can be downloaded in the form of SQL file.
Specify classes :
of SSEs, the topology describes how these elements are connected.
Primary topology finding :
The dictionary definition of ‘topology’ is "the factors which remain unchanged as an object undergoes a continuous deformation." In terms of protein secondary structure, the true topology is simply the sequence of SSEs, i.e. if one imagines being able to hold the N- and C-terminal ends of a protein chain and pull it out straight, the topology does not change whatever the protein fold (providing no knots are formed in similarity the folded protein). Here, we describe this as the ‘primary topology’ while, by analogy with primary and tertiary structure, the protein fold is described as the ‘tertiary topology’. A primary topology string is a sequence of E and H characters representing β-strand and α-helix in DSSP notation R.
Creating primary topology strings calculated from a three-dimensional structure using DSSP (Kabsch and Sander 1983) regions of β-sheet (Kabsch and Sander assignment, E) and of α-helix (Kabsch and Sander assignment, H) are extracted. Only continuous regions of at least a specified number of residues with the same assignment are selected. This produces the primary topology of the protein equivalent to a string of E and H characters where one character represents one complete strand or helix. After that, the primary topology string for each protein was added to the topology table.
Secondary topology finding :
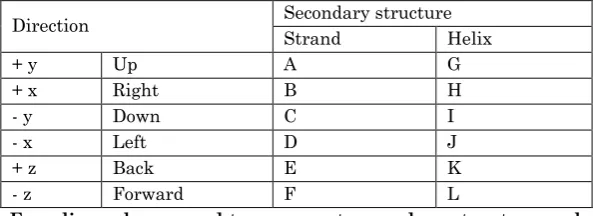
One creates secondary topology strings calculated by using additional information (such as SSE direction, and length of the elements) from a three-dimensional structure. Element length was calculated using the counting of residues in each SSE in the primary topology. In (SSE) direction, the end-points of each SSE in the primary topology are found in three dimensions and the vector between them is calculated. The direction of the vector is grouped into one of six classes depending on the largest component of the vector (i.e. positive or negative x, y or z). This is equivalent to saying the element points up, down, left, right, forward or back. The encoding is summarized in Table 1.
Direction Secondary structure Strand Helix
+ y Up A G
+ x Right B H
- y Down C I
- x Left D J
+ z Back E K
- z Forward F L
Table 1. Encoding scheme used to represent secondary structure and direction information
Finally, the secondary topology string for each protein was added to the topology table.
Filtering SSEs :
For each class in the topology table that contains proteins with a number of SSEs, a candidate must be found to be considered as a central SSE. These candidates founded by matching the amino acid for each SSE with centroid fragments (Building Block) came from the BriX2 database to filtering the SSEs in each protein in the topology table.
Depending on candidates SSEs for each protein in the topology table, pre & post SSEs are fetched. Then we extract specific attributes like type, length, and direction, all that being done by using sub-query statements (it is a nested "select" statement in SQL).
Write a CF-Grammar :
To illustrate how the CF-Grammar can be represented in the SSEs assembly, a definition to the terminals and non-terminals in this CF-Grammar is needed. After that, a general template to represent SSEs assembly by the CF-Grammar is introduced based on a sound scenario.
The SSEs assembly can be classified into levels that most effectively indicate their stages in protein zipping and assembly mechanism. A SSEs can be part of multiple motifs in these levels. Each motif has its name indicating the general category. The set of abbreviations will be denoted in Table [1]. These abbreviations represent the non-terminals in the CF-Grammar whereas the SSE secondary topology represents the terminals of the CF-Grammar.
Classes Abbreviations
Secondary Structure Sec-Stru Next Secondary Structure Nex-Sec-Strus Previous Secondary Structure Pre-Sec-Strus
Table [1]. Abbreviations of some classes stages in protein's fragment assembly
Figure [3]. The basic idea of SSEs assembly
The expected secondary structure can be found by selecting previous and subsequent fragments with same length of center fragment then find how many amino acids are needed in each direction to complete the current secondary structure.
Derive the ACF-Grammar :
To illustrate how the ACF-Grammar can be derived to represent the SSEs assembly, an Attribute context-free grammar ACF-Grammar consists of three elements, a CF-Grammar, a finite set of attributes Att, and a finite set of semantic rules R. The set of attributes Att includes knowledge about grammar symbols which are produced in stage one. A set of terminal and non-terminal symbols in CF-Grammar
the attribute value from Xi to Yj , where Xi, Yj belong to Non-terminal symbols. The check rule checks for some conditions to be satisfied. Finally, the ACF-Grammar that represents the SSEs assembly can be put in a table that has three fields (levels, productions, and semantic rules).
2.2. Level two:
In protein or highest level, the SCOP and CATH databases were used as input dataset to extract class, architecture, Topology, and Homologous super-family for each type of protein (globular, fibers, membranes) and then select one type of energy function to use it as a semantic rule, then add the extracted attributes plus an energy function with these attributes to finalizing ACF-Grammar.
Figure [4]. The block diagram of level two in the proposed system
The goal of SCOP (Structural Classification of Proteins) is to facilitate the understanding of, and access to, the information available for protein structures, this database providing a detailed and comprehensive description of the structural and evolutionary relationships of the proteins of known structure (Murzin et al. 1995).
The method used to construct the protein classification in SCOP is essentially the visual inspection and comparison of structures through various automatic tools.
1. FAMILY. Proteins are clustered together into families on the basis of one of two criteria that imply their having a common evolutionary origin: first, all proteins that have residue identities of 30% and greater; second, proteins with lower sequence identities but whose functions and structures are very similar; for example, globins with sequence identities of 15%.
2. SUPERFAMILY. Families, whose proteins have low sequence identities but whose structures and, in many cases, functional features, suggest that a common evolutionary origin is probable, are placed together in super-families.
3. COMMON FOLD. Super-families and families are defined as having a common fold if their proteins have the same major secondary structures in the same arrangement with the same topological connections.
4. CLASS. For convenience of users, the different folds have been grouped into classes. Most of the folds are assigned to one of the five structural classes on the basis of the secondary structures of which they composed: (1) all alpha, (2) all beta, (3) alpha and beta, (4) alpha plus beta, and (5) multi-domain.
the structure, interactive viewers, sequence data and literature
references. It is available online
(http://scop.berkeley.edu/) and can be downloaded in the form of SQL file.
Query protein type :
In this step protein type was found for all protein entry in SCOP database. All that was done by selecting statement from database tables, then the results were stored in two separate attributes table: one for the globular proteins and the other for the fiber proteins.
Find attributes :
In this step, for each protein type, specific attributes like class, architecture, Topology, and Homologous super-family were queried from the CATH [described in level one of the proposed
system] database tables, then the results were stored in the two
attributes table.
Protein's level scenario :
This is based on the idea that suggests that there were levels to reach full length protein from motif plus left and right SSEs throw modules. That is called highest level (protein) scenario which is used to write a CF-grammar [described in level one of
the proposed system].
Energy function :
Figure [5]. Proteins can be modeled at different levels of detail
3. Empirical results discussion
In this section an illustration for two types of results (attributes tables and ACF-Grammar) to each level in proposed system were discussed.
In this section, three attributes tables were founded. Lowest level table for segment attributes, medial level table for topology of secondary structure attributes, and highest level table for protein type attributes.
Medial level table contains a number of attributes like SSE-ID, SSE-Topology, SSE-type, SSE-length, Nex-SSE-direction, Pre-SSE-type, Pre-SSE-length, Pre-SSE-direction.
Highest level table contains a number of attributes like Protein-ID, Protein-Name, Protein-Class, Protein-Architecture. Since there are 3 different types of protein (globular, fibers, membranes), for globular and fibers protein there is a table hold above attributes. A membranes protein has no table, because there is no information about it in CATH database.
discussed:
Protein modeling using CF-Grammar :
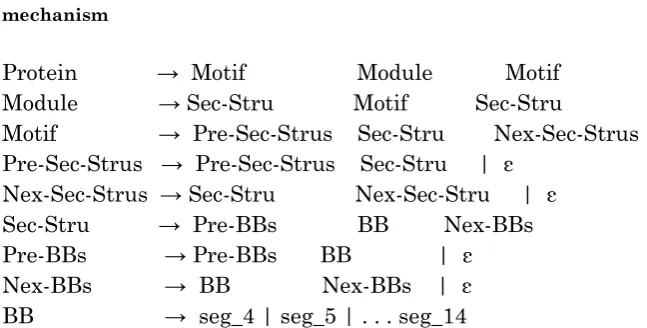
In this paragraph, there is an illustration of how the CF-Grammar can represent the protein folding. In addition, there is a definition to the terminals and non-terminals in this CF-Grammar. After that, a general template to represent protein folding by the CF-Grammar is introduced.
The protein folding can be classified into levels that most effectively indicate their stages in protein zipping and assembly mechanism. A fragment, secondary structure, motif can be part of multiple classes in these levels. Each class has its name indicating the general category; the set of classes will be denoted by Table 2. These classes represent the non-terminals in the CF-Grammar whereas the segments represent the terminals of the CF-Grammar.
Classes Abbreviations
Secondary Structure Sec-Stru Next Building Block Nex-BBs Previous Building Block Pre-BBs Building Block BB
Next Secondary Structure Nex-Sec-Strus Previous Secondary Structure Pre-Sec-Strus
Table 2. Abbreviations of some classes stages in protein folding mechanism
Protein → Motif Module Motif Module → Sec-Stru Motif Sec-Stru
Motif → Pre-Sec-Strus Sec-Stru Nex-Sec-Strus Pre-Sec-Strus → Pre-Sec-Strus Sec-Stru | ε
*Where seg_4: It is a fragment with four amino acid length. And seg_5: It is a fragment with five amino acid length. And so on.
A CF-Grammar describes which of the possible sequences of symbols (strings) in a biological language constitute valid words or statements in that language, but it does not describe their semantics (i.e. what they mean). Therefore, a biological language can be covered by using ACF-Grammar.
Protein modeling using ACF-Grammar :
An Attribute context-free grammar, ACF-Grammar, consists of three elements, a CF-Grammar, a finite set of attributes Att, and a finite set of semantic rules R. The set of attributes Att
includes knowledge about grammar symbols. Thus ACF-Grammar = (CF-ACF-Grammar, Att, R).
A finite set of attributes Att(X) is associated with each symbol X ϵ N. The set Att(X) is partitioned into two disjoint subsets, the inherited attributes and the synthesized attributes (D. E. Knuth 1968). The synthesized attributes move the data flow upwards and the inherited attributes move the data flow downwards in the parse tree during the attribute evaluation process. In our model, we used the two type attributes, the
synthesized attributes in the lowest and middle level and the
inherited attributes in the highest level.
The production p ϵ P, p : Yj X1 . . . Xm (m ≥ 1), has an attribute occurrence Xi.a, if "a" ϵAtt(Xi), 1 ≥ i ≥ m. A finite set of semantic rules is associated with each production p. We have classified these semantic rules, in our implementation, into two types: copy rules and check rules. The copy rule, as its name, copies the attribute value from Xi to Yj , where Xi, Yjϵ N. The check rule checks for some conditions to be satisfied.
Highest Protein → Motif Module Motif
Mini
EnergyFunction(Protein) And [ Module.Class or
Module.architecture or ] IN
Highest Att. Table Medial Module → Sec-Stru
Motif Sec-Stru
Motif → Pre-Sec-Strus Sec-Stru Nex-Sec-Strus
Sec-Stru → Pre-BBs BB Nex-BBs
Module IN Highest Table.topology
And [ Pre-Sec-Stru.Type and Pre-Sec-Stru.length and Pre-Sec-Stru.direction ] IN
Medial Att. Table
And [ Nex-Sec-Stru.Type and Nex-Sec-Stru.length and Nex-Sec-Stru.direction ] IN
Medial Att. Table Lowest Pre-BBs → Pre-BBs BB |
ε
Pre-BBs. SubString(length-3,end) =
BB. SubString(0,3)
And Pre-BBs.secondary structure IN
Lowest Att. Table Nex-BBs → BB
Nex-BBs | ε
Nex-BBs.SubString(0,3) =
BB. SubString(length-3,end) And Nex-BBs.secondary structure IN
Lowest Att. Table BB → seg_4 | seg_5 | . . . seg_14
4. Conclusions:
scenario to formal grammar (CF-Grammar). Finally, by using appropriate attributes, some semantic rules, and CF-Grammar, it will derive convenient ACF-Grammar.
Form the results and discussions above, we can say that the hypotheses are correct and the research objectives are accomplished. Also, someone can say that the ACF-Grammar is a good describing method and can be implemented on complex biological systems like protein folding process. In addition, it opens new trends in structural bioinformatics field to tackle hard problems.
There are several ways in which the above method exposed in this research can be extended in the future; these ways are as follows:
1. Build from scratch a new method to predict protein tertiary structure based on our proposed method as semantic phase.
2. Find the hidden Markov model for each protein exist in data set. After that, find the correlation between them to use it as a property for long distance contact. Finally, the output saved and used with other properties as an additional strong clue to find native our the near native protein structures.
3. Develop a convenient energy function to fulfill the requirement of our proposed concept framework.
BIBLIOGRAPHY:
Chandonia, J.-M., G. Hon, N.S. Walker, L. Lo Conte, P. Koehl, M. Levitt, and S.E. Brenner. 2004. “The ASTRAL Compendium in 2004.” Nucleic Acids Res. 32: D189– D192.
Handbook of Mathematical Psychology. 2: 323–418. Gordon, D. B., S. A. Marshall, and S. L. Mayo. 1999. “Energy
functions for protein design.” Curr. Opin. Struct. Biol. 9: 509-13.
Jorgensen, W. L. and J. Tirado-Rives. 2005. “Potential energy functions for atomic-level simulations of water and organic and biomolecular systems.” Proc. Natl. Acad. Sci. 102: 6665-70.
Kabsch, W. and C. Sander. 1983. "Dictionary of protein secondary structure: pattern recognition of hydrogen-bonded and geometrical features." Biopolymers 22: 2577–2637.
Knuth, D. E. 1968. "Semantics of Context-free Languages. Theory of Computing Systems." Mathematical Systems
Theory 2(2):127–145.
Lesk, Arthur. 2008. Introduction to bioinformatics. Third edition. Oxford University Press.
Mackerell, A. D., Jr. 2004. “Empirical force fields for biological macromolecules: overview and issues.” J. Comput.
Chem. 25: 1584-604.
McGuffin, L. J. 2008. "Computational Structural Biology: Methods and Applications." Chapter 2 Protein Fold Recognition and Threading. World Scientific.
Murzin, Alexey G., Steven E. Brenner, Tim Hubbard and Cyrus Chothia. 1995. “SCOP: A Structural Classification of Proteins Database for the Investigation of Sequences and Structures.” J. Mol. Biol. 247: 536–540.
Orengo, C.A., A.D. Michie, S. Jones, D.T. Jones, M.B. Swindells, and J.M. Thornton. 1997. "CATH — a hierarchic classification of protein domain structures." Structure
5(8): 1093–1109.
Ozkan, S.B., G.H.A. Wu, J.D. Chodera, and K.A. Dill. 2007. "Protein folding by zipping and assembly." Proc Natl
Acad Sci 104:11987–92.
design--where we were, design--where we are, design--where we're going.” J
Struct Biol 134: 269-81.
Vanhee, P., E. Verschueren et al. 2011. "BriX: a database of protein building blocks for structural analysis, modeling and design." NAR Database Issue 2011.
![Figure [2]. Schematic representation of the class (C), architecture (A) and topology (T) level in the CATH database](https://thumb-us.123doks.com/thumbv2/123dok_us/7780021.1284633/5.439.137.300.310.498/figure-schematic-representation-class-architecture-topology-level-database.webp)
![Figure [3]. The basic idea of SSEs assembly](https://thumb-us.123doks.com/thumbv2/123dok_us/7780021.1284633/10.439.68.386.69.292/figure-basic-idea-sses-assembly.webp)
![Figure [4]. The block diagram of level two in the proposed system](https://thumb-us.123doks.com/thumbv2/123dok_us/7780021.1284633/11.439.62.374.318.540/figure-block-diagram-level-proposed.webp)
![Figure [5]. Proteins can be modeled at different levels of detail](https://thumb-us.123doks.com/thumbv2/123dok_us/7780021.1284633/14.439.63.380.73.247/figure-proteins-modeled-different-levels.webp)