Performance Analysis of Machine Learning
Classifiers
Sonia 1 Dr. Neetu Sharma2
M.Tech Scholar, Department of Computer Science and Engineering, MDU University, India1
Head of Department, Department of Computer Science and Engineering, MDU University, India2
ABSTRACT: In this paper, we analyzed the performance of Machine Classifiers using different - different dataset or ARFF files which is called Attribute relation file format . In an experimental basis we have used WEKA software on which we used Decision Table, Naive Bayes, Random Forest and Multilayer Perceptions classifiers as supervised machine classifiers. In this software we gave same dataset to all classifiers and according to the result of all these classifiers we analyzed which algorithm correctly classified that dataset.
KEYWORDS- Artificial Intelligence, Naïve Baise, Machine Learning, Multilayer Perceptron, Random Forest
I. INTRODUCTION
A. MACHINE LEARNING
Machine Learning involves a computer algorithm learning from data. Based on a set of predefined features, algorithms identify patterns in data and can therefore infer predictions. Several works describe the use of machine learning algorithms to the word sense disambiguation task, such as Kulkarni et. al. (2007), as well as Yarowsky (1996).
Machine learning is a type of artificial intelligence (AI) that provides computers with the ability to learn without being explicitly programmed. Machine learning focuses on the development of computer programs that can teach themselves to grow and change when exposed to new data. A core objective of a learner is to generalize from its experience. Generalization in this context is the ability of a learning machine to perform accurately on new, unseen examples/tasks after having experienced a learning data set. The training examples come from some generally unknown probability distribution (considered representative of the space of occurrences) and the learner has to build a general model about this space that enables it to produce sufficiently accurate predictions in new cases.
Fig:1 Machine Learning Classifier
B. SUPERVISED LEARNING
In Supervised Learning training data includes both the input and the desired results. For some examples the correct results (targets) are known and are given in input to the model during the learning process. The construction of a proper training, validation and test set (Bok) is crucial. These methods are usually fast and accurate. It give the correct results when new data are given in input without knowing a priori the target.
Specifically, a supervised learning algorithm takes a known set of input data and known responses to the data (output), and trains a model to generate reasonable predictions for the response to new data.
Fig 2: Supervised Machine Learning
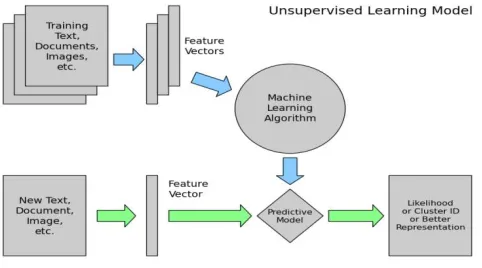
C. UNSUPERVISED LEARNING
The model is not provided with the correct results during the training. It can be used to cluster the input data in classes on the basis of their statistical properties only. The labeling can be carried out even if the labels are only available for a small number of objects representative of the desired classes.
Unsupervised learning is where you you only have input data (X) and no corresponding output variables. The goal for unsupervised learning[2] is to model the underlying structure or distribution in the data in order to learn more about the data. These are called unsupervised learning because unlike supervised learning above there is no correct answers and there is no teacher. Algorithms are left to their own devises to discover and present the interesting structure in the data. Unsupervised learning problems can be further grouped into clustering and association problems.
Clustering: A clustering problem is where you want to discover the inherent groupings in the data, such as grouping
customers by purchasing behavior.
Association: An association rule learning problem is where you want to discover rules that describe large portions of
II. LITERATURE REVIEW
In the field of Machine learning [3] & Data Mining, lot of work had been done to construct new classification techniques/ classifiers and lot of research is going on to construct further new classifiers. Many researchers provided comparative study/ analysis of classification techniques.
Decision tables[4], like decision trees[5] or neural nets, are classification models used for prediction. They are induced by machine learning algorithms. A decision table consists of a hierarchical table in which each entry in a higher level table gets broken down by the values of a pair of additional attributes to form another table. The structure is similar to dimensional stacking. Presented here is a visualization method that allows a model based on many attributes to be understood even by those unfamiliar with machine learning. Various forms of interaction are used to make this visualization more useful than other static designs.
Random Forest[6] is a supervised machine learning algorithm. In Data Mining domain, machine learning algorithms are extensively used to analyze data, and generate predictions based on this data. Being an ensemble algorithm, Random Forest generates multiple decision trees as base classifiers and applies majority voting to combine the outcomes of the base trees. Strength of individual decision trees and correlation among the base trees are key issues which decide generalization error of Random Forest classifiers. Based on accuracy measure, Random Forest classifiers are at par with existing ensemble techniques like bagging and boosting. In a research work an attempt is made to improve performance of Random Forest classifiers in terms of accuracy, and time required for learning and classification. To achieve this, five new approaches are proposed. The empirical analysis and outcomes of experiments carried out in this research work lead to effective learning and classification using Random Forest algorithm.
Ensemble classification [7] is a data mining approach that utilizes a number of classifiers that work together in order to identify the class label for unlabeled instances. Random forest (RF) is an ensemble classification approach that has proved its high accuracy and superiority.With one common goal in mind, RF has recently received considerable attention from the research community to further boost its performance. In this paper, we look at developments of RF from birth to present. The main aim is to describe the research done to date and also identify potential and future developments to RF. Our approach in this review paper is to take a historical view on the development of this notably successful classification technique.We start with developments that were found before Breiman’s introduction of the technique in 2001, by which RF has borrowed some of its components. We then delve into dealing with the main technique proposed by Breiman. A number of developments to enhance the original technique are then presented and summarized. Successful applications that utilized RF are discussed, before a discussion of possible directions of research is finally given.
The naive Bayes classifier greatly simplify learning by assuming that features are independent given class. Although independence is generally a poor assumption, in practice naive Bayes often competes well with more sophisticated classifiers.
There broad goal is to understand the data characteristics which affect the performance of naive Bayes. Our approach uses Monte Carlo simulations that allow a systematic study of classification accuracy for several classes of randomly generated problems.
They analyze the impact of the distribution entropy on the classification error, showing that low-entropy feature distributions yield good performance of naive Bayes. We also demonstrate that naive Bayes works well for certain nearly functional feature dependencies, thus reaching its best performance in two opposite cases: completely independent features (as expected) and functionally dependent features (which is surprising). McCallum and Nigam [8] has compared two variants of naïve bayes namely, multi-variate bernoulli model and multinomial model, in text classification. They found multinomial model best as it reduces error by an average of 27% over multi-variate bernoulli model. Also, there are many researchers who have used multinomial model for text classification such as Lewis and Gale [9], Kamal Nigam et al. [10].
III. MACHINE LEARNING CLASSIFIER
A. WEKA
WEKA is a collection of open source of many data mining and machine learning algorithms, including: pre-processing on data, classification, clustering, association rule extraction.[3] [4] In this paper we have taken the real world problem of predicting whether it is going to rain or any other prediction of weather. Machine learning works on the concept of the way a human brain works the machine also uses logical steps to perform the decision or to predict an output.
In Weka ARFF files are used which is the external representation of an Instances class Consists of –
Header: Describes the attribute types –
Data section: Comma separated list of data Example of ARFF File:-
B. SUPERVISED MACHINE LEARNING
There are various supervised methods that are available viz.
method based on similarity measures [5], probabilistic methods, methods based on discriminating rule and methods based on linear classifications.
a) NAIVE-BAYES (NB).
Naive Bayes is intended as a simple representative of statistical learning methods. It has been used in its most classi- 31 cal setting (Duda and Hart, 1973). That is, assuming the independence of features, it classifies a new example by assigning the class that maximizes the conditional probability of the class given the observed sequence of features of that example. Model probabilities are estimated during the training process using relative frequencies. To avoid the effect of zero counts, a very simple smoothing technique has been used, which was proposed in (Ng, 1997).
which maximizes the following formula is chosen as the most appropriate sense in context as shown in following equation :
where m is the number of features, and the last formula is from the naive assumption that the features are conditionally independent given the sense. Co-occurrence frequency in training set of sense and feature in the presence of sense is counted to evaluated the probabilities P(Si) and P( fj | Si).
Algorithmic steps for Naïve Based 1) Preprocessing
a. Segment input sentence b. Remove stop words from input
2) Multi sense lookup
Lookup possible sense meanings of the ambiguous word from the corpus
3) Calculating Probability for all senses si of W do
for all words fi in the vocabulary do P(fi|si) = C(fi,si)/C(si)
end end
for all senses si of W do P(si) = C(si) / N end
4) Disambiguation for all senses si of W do score(si) = log P(si)
for all words fi in the context window c do score(si) = score(si) + log P(fi|si)
end end
Choose s' = arg max score(si)
b) DECISION TABLE
Decision tables, like decision trees or neural nets, are classification models used for prediction. They are induced by machine learning algorithms. A decision table consists of a hierarchical table in which each entry in a higher level table gets broken down by the values of a pair of additional attributes to form another table. The structure is similar to dimensional stacking. A visualization method is presented that allows a model based on many attributes to be understood even by those unfamiliar with machine learning.
A decision table [7] has two components:
A schema, which is a list of attributes.
A body, which is a multiset of labeled instances. Each instance consists of a value for each of the attributes in the schema and a value for the label. The set of instances with the same values for the schema attributes is called a cell.
Fig:- Decision Tree in Weka
c) RANDOM FOREST
Random forests is a notion of the general technique of random decision forests that are an ensemble learning method for classification, regression and other tasks, that operate by constructing a multitude of decision trees at training time and outputting the class that is the mode of the classes (classification) or mean prediction (regression) of the individual trees. Random decision forests correct for decision trees' habit of overfitting to their training set.
We assume that the user knows about the construction of single classification trees. Random Forests grows many classification trees. To classify a new object from an input vector, put the input vector down each of the trees in the forest. Each tree gives a classification, and we say the tree "votes" for that class. The forest chooses the classification having the most votes (over all the trees in the forest).
Each tree is grown as follows:
1. If the number of cases in the training set is N, sample N cases at random - but with replacement, from the original data. This sample will be the training set for growing the tree.
2. If there are M input variables, a number m<<M is specified such that at each node, m variables are selected at random out of the M and the best split on these m is used to split the node. The value of m is held constant during the forest growing.
Fig:- Random Forest in Weka
d) MULTILAYER PERCEPTRON
The MLP is one of the most used supervised model which consist of multiple layers of computational units usually interconnected in a feed‐forward way.
In Multilayer Perceptron each neuron in one layer has direct connections to all the neurons of the subsequent layer. As a result MLP’s became popular in order to parametrize nonlinear models and classifiers, often leading to improved results compared to classical methodsAn MLP is a network of simple neurons called perceptrons. The basic concept of a single perceptron was introduced by Rosenblatt in 1958. The perceptron computes a single output from multiple real-valuedinputs by forming a linear combination according to its input weights and then possibly putting the output through some nonlinear activation function. Mathematically this can be written as
where w denotes the vector of weights, x is the vector of inputs, b is the bias and ϕ is the activation function.
Fig:- MultiLayer Perceptron in Weka
IV. RESULT AND DISCUSSION
ARFF File (Data Set) Decision Table Random Forest Naïve Bayes Multi Layer Perceptro n
Glass 77.1028% 99.5327% 55.6075% 85.9813%
Weather 64.2857% 100% 92.8571% 100%
Labor 91.2281% 100% 98.2456% 100%
Vowels 73.2323% 100% 71.2121% 97.7738%
Balance-sheet
77.44% 99.36% 90.88% 92.16%
Table: A comparative analysis of different dataset using different supervised classifiers in WEKA.
V. CONCLUSION
In this paper the performance of the most well known classification algorithms like decision trees, Naïve Bayes, Random Forest and Multilayer Perceptron is shown. Using Weka software we analyzed that which Machine classifier give maximum output after classification the instances of any dataset. Through the implementation we used five ARFF files in different supervised classifiers. According to result , we conclude that Random forest is best classifier for classify the instance as it gave maximum output in all dataset. After Random Forest Multilayer Perceptron is also produced best output. But comparatevly Random Forest and Multilayer Perceptron, Decision Table produced very low output . Naïve bayes classifier is also comparatevly good from the Decision Table.
REFERENCES
1. http://in.mathworks.com/help/stats/supervised-learning-machine-learning-workflow-and-algorithms.html 2. http://machinelearningmastery.com/supervised-and-unsupervised-machine-learning-algorithms/
3. Yugal Kumar, G. Sahoo” Analysis Of Parametric & Non Parametric Classifiers For Classification Technique Using WEKA”, I.J. Information Technology and Computer Science, 2012
4. R. Kohavi, “The Power of Decision Tables”, Proceedings of the European Conference on Machine Learning, Lecture Notes in Artificial Intelligence 914, Springer Verlag, Berlin, Heidelberg, NY, pages 174-189.
5. J. Quinlan, C4.5:Programs For Machine Learning, Morgan Kaufmann Publishers, Inc., 1993.
6. Vrushali Y Kulkarni, Pradeep K Sinha” Effective Learning and Classification using Random Forest Algorithm”, International Journal of Engineering and Innovative Technology (IJEIT) Volume 3, Issue 11, May 2014
7. Khaled Fawagreh, Mohamed Medhat Gaber and Eyad Elyan”Random forests: from early developments to recent advancements”, Systems Science & Control Engineering: An Open Access Journal, 2014
8. A. McCallum, K. Nigam, “A comparison of event models for naive Bayes text classification”. AAAI/ICML- 98Workshop on Learning for Text Categorization, AAAI Press 41–48, 1998.
9. D.D. Lewis, and W.A. Gale, “A sequential algorithm for training text classifiers”. In SIGIR-94, 1994
10. K. Nigam, A. McCallum, S. Thrun, and T. Mitchell, “Learning to classify text from labeled and unlabeled documents”. In AAAI-98,1998.
11. J. A. K. Suykens and J. Vandewalle,” Training Multilayer Perceptron Classifiers Based on a Modified Support Vector Method”, Ieee Transactions On Neural Networks, Vol. 10, No. 4, July 1999
12. Wikipedia.org http://en.wikipedia.org/wiki/Weka_(machine_learning) 13. WEKA Tutorial http://www.cs.utexas.edu/users/ml/tutorials/Weka-tut/
14. Alistair Kennedy and Stan Szpakowicz., “A Supervised Method of Feature Weighting for Measuring Semantic Relatedness”,2011.
15. Nirali patel, Bhargesh Patel,Rajvi Parikh,Brijesh Bhatt ”A Survey: Word Sense Disambiguation”, International Journal of Advance Foundation and Research in Computer (IJAFRC) Volume 2, Special Issue (NCRTIT 2015), January 2015.