Clustering XML Documents using FCM,
TF-IDF and SVM
Shivmati, Sachin Shrivastava
M. Tech (pursuing), Dept. of CSE, SATYA Group of Institutions at Palwal, Haryana, India
Assistant Professor, Dept. of CSE, SATYA Group of Institutions at Palwal, Haryana, India
ABSTRACT: These days mining significant data from expansive scale web records are more critical to fulfil the client request. XML and RDF reports are supporting the semantic data recovery to decipher and extricate significant data for client inquiry. XML archives have light weight code and intelligent structure, which encourage simple trade of information values and structure data regarding learning. Many mining systems and calculations are utilized to improve the execution of XML data Retrieval. Arrangement (Supervised Learning) and Clustering (Unsupervised Learning) are the pre-handling procedures used to gathering up the comparative information objects in light of likeness criteria. This paper under the scheme exhibits the review on three grouping calculations (FCM, VSM and TF-IDF) and its similitude measures on XML datasets. The three grouping calculations are contrasted and tried and the same xml datasets for finding the best one to bunch XML reports. In this scheme the strategy to enhance the execution of Information Retrieval System (IRS) by expanding the numbers of pertinent xml document recovered. There are a few sorts of instability and fluffiness related with IRS like inquiry term vulnerability, pertinence vulnerability required in recovering of immaterial reports. The point of this paper is to dispense with various sorts of instability and increment the shot of recovering important archives. In the system a technique is proposed which initially figure question and report group similitude which not just recover the archives coordinating inquiry terms and in addition like recovered records by ascertaining the inquiry and bunch closeness. This diminishes seek term vulnerability and tries to decrease the fluffiness related with archive pertinence in two stages. To start with adjustment is made as a rule term frequency-inverse document frequency (tf-idf) scoring system to give significance of instruction of a record substance and furthermore figuring question and report synopsis cover. All the above data is utilized to quantify the record important score. Consequently, inculcating the Vector Space Mode (VSM) to remove fuzziness along-with calculating the similarity using Fuzzy C-Means clustering.
.
KEYWORDS: Fuzzy C-Means Clustering, Term Frequency (FCM), Term Frequency - Inverse Document Frequency (TDF-IDF), Extensible Mark-up Language (XML), Vector Space Model (VSM), Information Retrieval
I. INTRODUCTION
II. RELATED WORK
With the development of information technology, digital information grows very fast and has more and more kinds of type, web data have different formats; therefore about 90% of data remain without use and are not represented in user mining. [2] XML is a W3C standard structured language.XML is used to provide meaningful information about the stored content. An XML document can be modeled as a rooted, ordered, and labeled tree. [3] The XML page will be consisted of built-in and user defined tags. The metadata information of the pages is extracted from the XML. User defined tags will help the system in getting answers from reliable sources. [4] To get meaningful information from XML document there are different techniques and mechanisms were incorporated. But finding the best among them is a difficult task.[4,5] Data classification and Clustering techniques are used to extract and summarize data into similar groups. As web is migrating from HTML to XML, large amount of data is accumulating day by day. This huge amount of data on the websites is needed to be managed.[6,7] For the same purpose, many data mining techniques are available to manage the datasets.[7] Supervised learning is one of the technique used to discovers the patterns in the data, which is used to predict the values of the class attribute of future data instances. These classes indicate some real-world predictive or classification tasks such as determining whether a news article belongs to the category of sports or politics, or whether a patient has a particular disease.[8] Clustering is one technology for finding intrinsic data that has no class attributes.. It organizes data instances into similarity groups, called clusters such that the data instances in the same cluster are similar to each other and data instances in different clusters are very different from each other.[8] Clustering is also known as unsupervised learning. This paper presents the study on various clustering algorithms. Lots of work has been done on fluffy data recovery to model vulnerability and imprecision in IR. Michal Kozielski proposed a strategy which utilizes fluffy c-means bunching to group the XML records [6].The technique bunches highlight vectors encoding XML reports on the distinctive structure levels. Razaz and M. Sch. proposed a position calculation in view of fluffy c-means grouping procedures [7]. The principal phase of the calculation is to develop the maximum item transitive conclusion of the association grid which is then utilized as a fluffy likeness connection in a bunching procedure. Guadalupe J. Torres, Ram B. Basnet, Andrew H. Sung, Srinivas Mukkamala and Bernardete M. Ribeiro propose a calculation for performing closeness investigation among various bunching calculations [4].There are a few papers accessible which utilizes fluffy c implies grouping calculation to re-rank the records after recovery. Yet, these papers don't utilize arrangement of record bunch utilizing fluffy c-implies grouping in the preprocessing steps which is utilized as a part of this paper. In past papers stress is given on the record and question cover score figuring. On the off chance that the report rundown contains all the more no of inquiry terms then the archive will be more applicable as for question [2]. However below are terminology explained to adjudicate the scheme and scenario depicted?
Cluster: Cluster is the process of grouping up the similar data objects in to groups. A Cluster group of objects are different from other cluster group of objects. Cluster analysis is an important technique which is used for many practical applications. Clustering is the process of partitioning a given set of objects into disjoint clusters. [9] This is done in such a way that objects in the same cluster are similar while objects belonging to different clusters differ considerably, with respect to their attributes.[9,10] To get meaningful information from clusters, then clusters should get the real structure of data objects.
Similarity-based cluster definition: A cluster is a set of objects that are “similar”, and objects in other clusters are not “similar.” A variation on this is to define a cluster as a set of points that together create a region with a uniform local property, e.g., density or shape.[11] Generally Cluster Algorithm classified as four models over an algorithm i.e. Connectivity models, Centroid models, Distribution models and Density Models. The most commonly used Cluster types are Partition and Hierarchal cluster whereas under the scheme we used the fuzzy c-means clustering. A clustering algorithm organizes items into groups based on a similarity criteria. The Fuzzy c-Means algorithms a clustering algorithm where each item may belong to more than one group (hence the word ‘fuzzy’), where the degree of membership for each item is given by a probability distribution over the clusters.
the absolute membership of a data point to a given cluster; instead, it calculates the likelihood (the degree of membership) that a data point will belong to that cluster. Hence, depending on the accuracy of the clustering that is required in practice, appropriate tolerance measures can be put in place. Since the absolute membership is not calculated, FCM can be extremely fast because the number of iterations required to achieve a specific clustering exercise corresponds to the required accuracy.
Iterations: In each iteration of the FCM algorithm, the following objective function J is minimized:
Equation: 1
Here, N is the number of data points, C is the number of clusters required, cj is the centre vector for cluster j, and δij is the degree of membership for the ith data point xi in cluster j. The norm, k xi – cj k measures the similarity (or closeness) of the data point xi to the centre vector cj of cluster j. Note that, in each iteration, the algorithm maintains a centre vector for each of the clusters. These data-points are calculated as the weighted average of the data-points, where the weights are given by the degrees of membership.
Degree of membership: For a given data point xi , the degree of its membership to cluster j is calculated as follows:
Equation: 2
where, m is the fuzziness coefficient and the centre vector cj is calculated as follows:
Equation: 3
In equation 3 above, δij is the value of the degree of membership calculated in the previous iteration. Note that at the start of the algorithm, the degree of membership for data point I to cluster j is initialized with a random value θij , 0 ≤ θij ≤ 1, such that PC j δij = 1.
Fuzziness coefficient: In equations (2) and (3) the fuzziness coefficient m, where 1 < m < ∞, measures the tolerance of the required clustering. This value determines how much the clusters can overlap with one another. The higher the value of m, the larger the overlap between clusters. In other words, the higher the fuzziness coefficient the algorithm uses, a larger number of data points will fall inside a ‘fuzzy’ band where the degree of membership is neither 0 nor 1, but somewhere in between.
Equation: 4
where, δkijand δ k+1
ij are respectively the degree of membership at iteration k and k + 1,and the operator ∆, when supplied a vector of values, returns the largest value in that vector.
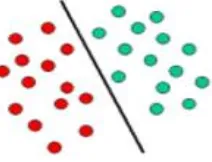
Support Vector Machines (SVM): Support Vector Machines are based on the concept of decision planes that define decision boundaries. A decision plane is one that separates between a set of objects having different class memberships. A schematic example is shown in the illustration below. In this example, the objects belong either to class GREEN or RED. The separating line defines a boundary on the right side of which all objects are GREEN and to the left of which all objects are RED. Any new object (white circle) falling to the right is labeled, i.e., classified, as GREEN (or classified as RED should it fall to the left of the separating line).
Figure 1: Schematic example is shown in the illustration for Support Vector Machine
The above Figure 1 is a classic example of a linear classifier, i.e., a classifier that separates a set of objects into their respective groups (GREEN and RED in this case) with a line. Most classification tasks, however, are not that simple, and often more complex structures are needed in order to make an optimal separation, i.e., correctly classify new objects (test cases) on the basis of the examples that are available (train cases). This situation is depicted in the illustration below. Compared to the previous schematic, it is clear that a full separation of the GREEN and RED objects would require a curve (which is more complex than a line). Classification tasks based on drawing separating lines to distinguish between objects of different class memberships are known as hyperplane classifiers depicted in Figure 2. Support Vector Machines are particularly suited to handle such tasks.
Figure 2: Hyperplane classifiers using Support Vector Machine
The illustration below in Figure 3 shows the basic idea behind Support Vector Machines. Here we see the original objects (left side of the schematic) mapped, i.e., rearranged, using a set of mathematical functions, known as kernels. The process of rearranging the objects is known as mapping (transformation). Note that in this new setting, the mapped objects (right side of the schematic) is linearly separable and, thus, instead of constructing the complex curve (left schematic), have to do is to find an optimal line that can separate the GREEN and the RED objects.
TF-IDF: Term frequency (tf_{w,d}) is the number of times word w occurs in document d. The document frequency (df_{w}) is the number of documents in which the word w occurs at least once. The inverse document frequency of a word is low if it occurs in many documents and is highest if the word occurs in only one. The underlying Figure 4 depicts weighting scheme are based on two empirical observations regarding text. First, the more times a term appears in a document, the more likely it is that term is relevant to the topic of the document. Second, the more times the term occurs throughout all document, the more poorly the term discriminates between documents.
Figure 4: Word Occurrence and Weighting Scheme based in TFIDF.
III.PROPOSED ALGORITHM &PSEUDO CODE
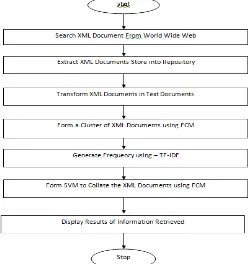
Under the scheme the proposed architecture is depicted with nitty-gritty and component solutions as workflow for ready reference and perusal whereas the XML documents will be fetched from the world wide web using google suggested links. However, the documents will be preserved in repository respectively, subsequently, Fuzzy C-Mean will form the cluster, and TF-IDF for frequency and SVM for distinct XML document retrieval, below diagram figure 5 depicts the same.
Figure 5 : Depicts the workflow illustration for the proposed scheme encompassing the XML document Clustering using FCM, SVM and TF-IDF.
Step 1:
Score(q,d)=SimX(q,c) + Sim(q,d) + Ovelap(q,ds) Where,
Score (q, d) =weight of the document d with respect to the XML query q SimC (q, c) =query vide XML structure and cluster similarity
Sim (q, d) =modified tf-idf score
overlap (q, ds) =no of terms present in the summary of XML document.
Step 2:
Score Calculation for Query and Cluster Similarity using fuzzy c-mean:
Where,
q=number of terms in the query
cq= number of query terms included in a cluster centroid cq /d = query inclusion ratio for the cluster.
Wqi=weight of query term
Wci=weight of term in cluster centroid
The XML documents included in the same cluster have the same query-cluster similarity. Query cluster similarity core is influenced by the query inclusion ratio, which prefers the cluster whose centroid includes more query terms.
Algorithm for Calculation of Query and Cluster Similarity
Step1: prepare XML document cluster using fuzzy c-means clustering Step2: prepare query vector of query q
Step3: initialize simC [q, c] and cq[c] as zero Step4: for each query term
Step5: do for each cluster
Step6: do if term t is present in cluster Step7: do fetch centroid vector of cluster(C) Step8: do simX [q, c] +=wqi *wci
Step9: do cq[c] +=1 Step10: calculate |q|
Assign SimX [q, c] to each document belongs to cluster c
Step 3:
Calculation of Modified TF-IDF Score Score Calculation for Modified Vector Space Model. The query and document similarity score based on modified vector space model is calculated along with FCM as:
Sim(q,d) = tfm(t) * idfm(t) * norm(d) * norm(q) Where, tfm (t) is the modified term frequency factor for term t. It is represented by :
Tfm(t)=tf * log2 (1+R)
tf= term frequency in the XML document d R= (dt+ tf-1)/dl
dl= XML document length
dt= no’s of distinct term in the XML document
Where, N= total no’s of document in the collection n=document frequency of the term t norm (d) =normalization factor used by Juru based on SMART scoring mechanism [3]. It is represented by:
Where, avgdt=average of distinct term for all documents norm (q) =the normalization factor of query terms represented by:
Algorithm for Score Calculation Based On Modified Vector Space Model along with FCM:
Step1: float Sim [N] = 0 Step2:.initialize dt [N] Step3:.initialize dl [N] Step4: initialize avgdt Step5: initialize norm [N] Step6: for each query term t
Step7: do calculate wt,q and fetch postings list for t Step8: for each pair (d, tft,d) in postings list Step9: do Sim[d] += wft,d * wt,q
Step10: read the array norm[d] Step11: for each d
Step12: do Sim[d] = Sim[d] *norm[d]*norm[q]
IV. SIMULATION RESULTS
For experiment in the scheme 100 XML documents and 10 queries are raised. The experiment was done using c# programming language and NUnit standard package.. To store intermediate and final result Microsoft sql-server is used. Performance Measurement Parameter: In this scheme, two performance parameters are defined to evaluate the proposed approach. These two performance parameters are listed as follows. (Precision): It is the fraction of retrieved documents that are relevant.
Precession=#relevant_items_retrieved /#retrieved_items
Recall(R) is the fraction of relevant documents that are retrieved
Recall=relevant_items_retrieved /relevant_items
All the stages of the proposed model has been implemented and executed by taking 10 queries and on 100 no of
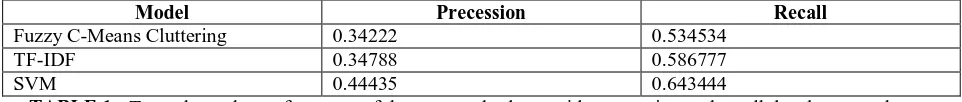
documents. TABLE I contains comparison result. The result shows that precision and recall value of the proposed
work is increased. This means proposed model is more efficient to retrieve the relevant documents. The proposed result is derived using machine comprising of 2.4 GHZ processor with 4GB of RAM and 64MB of L2 Cache.
Model Precession Recall
Fuzzy C-Means Cluttering 0.34222 0.534534
TF-IDF 0.34788 0.586777
SVM 0.44435 0.643444
Graphical Comparison of Result
The graph 1, 2 shows scheme proposed model works in as under with respective results gained using precession recall:
Graph 1: Bar Chart depicting the precession and recall threshold on FCM, TF-IDF & SVM
Graph 2: Surface Chart depicting the precession and recall threshold on FCM, TF-IDF & SVM
V. CONCLUSION AND FUTURE WORK
This paper proposed a novel algorithm for improvement of performance in document retrieval using fuzzy c-means clustering algorithm and modified vector space model with TF-IDF. Fuzzy c-means algorithm is used to cluster documents by capturing the inter document similarity and SVM to remove the same. It also eliminates the disadvantage of classical hard clustering algorithm. Term frequency is modified to give importance of the in-formativeness of the documents and modification in idf eliminates the abrupt changes in idf with respect to document frequency. Finally precession recall correlation ratio retrieved only those documents which have some correlation with query. Future work can be not only with XML document and can be with Web-Services with SOAP Envelops.
REFERENCES
1. Christopher D. Manning, Prabhakar Raghavan,Hinrich Schtze, An Introduction to information retrieval, Cambridge University Press Cambridge, England 2008. 2. LI Guoliang , FENG Jianhua, ZHOU Lizhu ,” Keyword Searches in Data Centric XML Documents Using Tree Partitioning,
3. Tsinghua Science and Technology, February 2009, 14(1): 7-18
4. Ritu Khatri, Kanwalvir Singh Dhindsa, Vishal Khatri, “ Ivestigation and Analysis of New Approach for Intellignet Semantic Web Search Engines, IJRTE April 2012.
5. Amit Mishra, Sanjay Kumar jain, “ A Survey on question answering system with classification, Journal of King Saud University - Computer and Information Sciences
6. Megha Gupta¹, Naveen Aggarwal², “Performance Analysis of Classification Techniques [7]. on XML Dataset”, IJCST Vol. 1, Issue 1, September 2010
7. Gurpreet Kaur and Naveen Aggarwal, “Exploiting Hierarchal Structure of XML Data Using Association Rule Analysis”, International Journal of Machine Learning and Computing, Vol. 2, No. 3, June 2012.
8. N.o. rubens, The application of fuzzy logic to the construction of the ranking function of information retrieval systems, Computer Modelling and New Technologies, 2006, Vol.10, No.1, 20-27
9. Doron Cohen, Einat Amitay, David Carmel, Lucene and Juru at Trec 2007: 1Million Queries Track, IBM Haifa Research Lab, 1905 Michal Kozielski, Multilevel conditional Fuzzy C-Means Clustering of XML documents, Silesian University of Technology, 2007.
0 0.2 0.4 0.6 0.8
Precession
Recall
Precession 0
0.2 0.4 0.6 0.8
0.6-0.8
0.4-0.6
0.2-0.4