University of Windsor University of Windsor
Scholarship at UWindsor
Scholarship at UWindsor
Electronic Theses and Dissertations Theses, Dissertations, and Major Papers
2013
Development of Procedures for Accurate Finite Element Modeling
Development of Procedures for Accurate Finite Element Modeling
of the Dynamic and Quasi-Static Performance of Automotive
of the Dynamic and Quasi-Static Performance of Automotive
Chassis Components Incorporating Hyperelastic Materials
Chassis Components Incorporating Hyperelastic Materials
Matthew Bondy University of Windsor
Follow this and additional works at: https://scholar.uwindsor.ca/etd
Recommended Citation Recommended Citation
Bondy, Matthew, "Development of Procedures for Accurate Finite Element Modeling of the Dynamic and Quasi-Static Performance of Automotive Chassis Components Incorporating Hyperelastic Materials" (2013). Electronic Theses and Dissertations. 4757.
https://scholar.uwindsor.ca/etd/4757
This online database contains the full-text of PhD dissertations and Masters’ theses of University of Windsor students from 1954 forward. These documents are made available for personal study and research purposes only, in accordance with the Canadian Copyright Act and the Creative Commons license—CC BY-NC-ND (Attribution, Non-Commercial, No Derivative Works). Under this license, works must always be attributed to the copyright holder (original author), cannot be used for any commercial purposes, and may not be altered. Any other use would require the permission of the copyright holder. Students may inquire about withdrawing their dissertation and/or thesis from this database. For additional inquiries, please contact the repository administrator via email
Development of Procedures for Accurate Finite Element Modeling of the Dynamic and
Quasi-Static Performance of Automotive Chassis Components Incorporating
Hyperelastic Materials
by
Matthew Bondy
A Thesis
Submitted to the Faculty of Graduate Studies
through Mechanical, Automotive, and materials Engineering
in Partial Fulfillment of the Requirements for
the Degree of Master of Applied Science at the
University of Windsor
Windsor, Ontario, Canada
2012
Development of Procedures for Accurate Finite Element Modeling of the Dynamic and
Quasi-Static Performance of Automotive Chassis Components Incorporating
Hyperelastic Materials
by
Matthew Bondy
APPROVED BY:
______________________________________________
Dr. Faouzi Ghrib
Department of Civil and Environmental Engineering
______________________________________________
Dr. Daniel Green
Department of Mechanical, Automotive and Materials Engineering
______________________________________________
Dr. William Altenhof, Advisor
Department of Mechanical, Automotive and Materials Engineering
______________________________________________
Dr. Andrzej Sobiesiak, Chair of Defense
Department of Mechanical, Automotive and Materials Engineering
iii
Declaration of Originality
I hereby certify that I am the sole author of this thesis and that no part of this
thesis has been published or submitted for publication.
I certify that, to the best of my knowledge, my thesis does not infringe upon
anyone’s copyright nor violate any proprietary rights and that any ideas, techniques,
quotations, or any other material from the work of other people included in my thesis,
published or otherwise, are fully acknowledged in accordance with the standard
referencing practices. Furthermore, to the extent that I have included copyrighted
material that surpasses the bounds of fair dealing within the meaning of the Canada
Copyright Act, I certify that I have obtained a written permission from the copyright
owner(s) to include such material(s) in my thesis and have included copies of such
copyright clearances to my appendix.
I declare that this is a true copy of my thesis, including any final revisions, as
approved by my thesis committee and the Graduate Studies office, and that this thesis has
iv
Abstract
Finite element models of the vehicle for crashworthiness have traditionally included
simplified representations of isolators intended to improve noise and vibration. However,
the low stiffness of the hyperelastic material employed in such components allows for
large deformations under impact conditions with a significant effect upon the
accelerations experienced by the occupant. Modeling these components is challenging
due to the non-linear behaviour of the material and the large deformations. The purpose
of this research was to identify practices for developing accurate and efficient finite
element models of chassis components incorporating hyperelastic materials. To maximize
the comprehensiveness of this process, this research included quasi-static and dynamic
material characterization; material model selection and implementation; finite element
modeling techniques; quasi-static and dynamic component characterization; and model
validation. Conclusions included the importance of comprehensive material
characterization, material model selection, variation in results due to solver updates, and
v
Dedication
vi
Acknowledgements
This research was associated with the double degree University of Windsor and
Politecnico di Torino program supported by FIAT-Chrysler. I worry that it may be
impossible to acknowledge everyone involved in organizing this program, the following
is likely a partial list. At the Politecnico di Torino Dr. Giovanni Belingardi, Dr. Giancarlo
Genta, and Raffaella Fiora were incredibly helpful and went out of their way to make
myself and the other Canadians feel more than welcome. I would like to thank, in
particular, Dr. Belingardi, as one my supervisors, for providing invaluable advice.
Another individual at the Politecnico, Lorenzo Peroni, deserves special recognition for
the significant investment of time to provide a great deal of assistance with this research.
I would also like to thank Professor Donato Firrao for finding us a place to stay in
Collegio Valentino.
FIAT engineers Massimo Barbi (Centro Ricerche FIAT) and Paolo Chiappero (Mirafiori
FIAT polymer laboratory) provided invaluable advice and assistance with this research.
The experience gained working with these individuals and their co-workers will
undoubtedly be of great benefit to me in my future career. Several Chrysler engineers are
equally deserving of my sincere gratitude. Mohammed Malik provided significant
organizational and technical assistance from the Automotive Research and Development
Center in Windsor. Dr. Sae Park and Hamid Keshtkar, crashworthiness engineers at
Chrysler Technical Center, were a pleasure to work with and very supportive. At the
University of Windsor I would like to thank Mike Houston for his advice before,
throughout, and after the trip overseas. Dr. Peter Frise and Jan Stewart are forever owed
a debt of gratitude for their work in developing this program and providing a great deal of
support. To my Canadian advisor, Dr. William Altenhof, thank you. I was very fortunate
vii
Contents
Declaration of Originality ... iii
Abstract ...iv
Dedication ... v
Acknowledgements ...vi
List of Figures ... xi
List of Tables ... xviii
List of Abbreviations, Symbols, Nomenclature ... xx
List of Nomenclature ... xxii
Chapter 1: Introduction ... 1
Chapter 2: Literature Review ... 5
2.1 Powertrain Suspension ... 5
2.2 Review of Research on Automotive Chassis Components Incorporating Hyperelastic Materials ... 8
2.3 Structural, Transient Finite Element Method ... 13
2.4 Hyperelastic Materials ... 15
2.5 Mullins’ Effect ... 19
2.6 Temperature Dependency ... 19
2.7 Hyperelastic Material Models in LS-DYNA ... 20
2.8 Solid Element Formulations in LS-DYNA ... 22
2.9 Locking ... 23
2.10 Oberkampf-Trucano (OT) Error Metric ... 24
2.11 American Society for Testing and Materials (ASTM) Standards ... 25
2.12 Split-Hopkinson Pressure Bar (SHPB) Material Testing ... 27
2.13 Split Hopkinson Pressure Bar Testing of Soft Materials ... 32
Chapter 3: Scope of Research ... 36
Chapter 4: Methodology ... 37
4.1 Quasi-Static Material Characterization ... 38
4.2 Dynamic Material Characterization ... 44
4.3 Finite Element Modeling of Quasi-Static Material Characterization ... 44
4.3.1 Single Element Models ... 44
viii
4.3.3 Simple Tension Finite Element Models with Automatic Tetrahedron Remeshing ... 48
4.3.4 Simple Compression Finite Element Models ... 49
4.3.5 Planar Tension (Pure Shear) Finite Element Models ... 51
4.3.6 Equibiaxial Tension Finite Element Models... 53
4.3.7 Single Element Models to Validate Strain Rate Sensitivity Capabilities of MAT 181 56 4.4 Finite Element Modeling of Quasi-Static Material Characterization with MAT 77O (Ogden) ... 60
4.5 Development of Finite Element Model of Chrysler RT Platform Transmission Mount ... 69
4.5.1 Tied Contact ... 77
4.6 Component Level Testing – Chrysler Engine Mount ... 78
4.6.1 Fixture Design ... 78
4.6.2 Quasi-Static Component Characterization ... 80
4.6.3 Dynamic Component Characterization ... 81
4.7 Finite Element Model Validation ... 83
4.7.1 Quasi-Static Force-Displacement Response ... 83
4.7.2 Dynamic Force-Displacement Response ... 85
Chapter 5: Results ... 86
5.1 Quasi-Static Material Characterization ... 86
5.2 Finite Element Modeling of Quasi-Static Material Characterization with MAT 181 (Simple Rubber/Foam) ... 92
5.2.1 Single Element Models (MAT 181, MAT 77H, & MAT 77O) ... 92
5.2.2 Simple Tension Finite Element Models (MAT 181) ... 95
5.2.3 Simple Compression Finite Element Models (MAT 181) ... 97
5.2.4 Planar Tension (Pure Shear) Finite Element Models (MAT 181) ... 99
5.2.5 Equibiaxial Tension Finite Element Models (MAT 181) ... 103
5.3 Finite Element Modeling of Dynamic Material Characterization by AXEL Products Physical Testing Services ... 106
5.3.1 Single Element Models to Validate Strain Rate Sensitivity Capabilities of MAT 181 ... 106
5.4 Finite Element Modeling of Quasi-Static Material Characterization with MAT 77O Ogden ... 108
5.4.1 Simple Tension Finite Element Models (MAT 77O, 6 Terms) ... 108
ix
5.4.3 Simple Tension Finite Element Models with Automatic Tetrahedron Remeshing (MAT
77O, 8 Terms) ... 114
5.4.4 Simple Compression Finite Element Models (MAT 77O, 6 Terms) ... 117
5.4.5 Simple compression finite element models (MAT 77O, 8 Terms) ... 119
5.4.6 Planar Tension (Pure Shear) Finite Element Models (MAT 77O, 6 Terms) ... 122
5.4.7 Planar Tension (Pure Shear) Finite Element Models (MAT 77O, 8 Terms) ... 125
5.4.8 Equibiaxial Tension Finite Element Models (MAT 77O, 6 Terms) ... 131
5.4.9 Equibiaxial Tension Finite Element Models (MAT 77O, 8 Terms) ... 134
5.5 Finite Element Models of Chrysler RT Platform Transmission Mount ... 137
5.5.1 Hourglass control ... 146
5.5.2 Tetrahedron element formulations and geometry simplifications ... 149
5.5.3 Tied Contact ... 151
5.6 Component Characterization ... 154
5.6.1 Fixture Design ... 154
5.6.2 Quasi-Static Component Characterization ... 157
5.6.3 Dynamic Component Characterization ... 165
5.7 Finite Element Model Validation ... 167
5.7.1 Quasi-Static Force-Displacement Response ... 167
5.7.2 Dynamic Component Force-Displacement Response ... 172
Chapter 6: Discussion ... 173
6.1 Quasi-Static Material Characterization ... 173
6.2 Finite Element Modeling of Quasi-Static Material Characterization ... 174
6.2.1 Single Element Models ... 174
6.2.2 Simple Tension Finite Element Models ... 175
6.2.3 Simple Compression Finite Element Models ... 178
6.2.4 Planar Tension (Pure Shear) Finite Element Models ... 179
6.2.5 Equibiaxial Tension Finite Element Models... 183
6.3 Finite Element Model of Chrysler Engine Mount ... 187
6.3.1 Hourglass control ... 188
6.3.2 Tetrahedron element formulations and geometry simplifications ... 188
6.3.3 Tied Contact ... 188
x
Component Characterization ... 189
6.4.1 Fixture Design ... 189
6.4.2 Quasi-Static Component Characterization ... 190
6.4.3 Dynamic Component Characterization ... 191
6.5 Finite Element Model Validation ... 192
6.5.1 Quasi-static component characterization model validation ... 192
6.5.2 Dynamic component characterization model validation ... 193
Chapter 7: Conclusions... 194
7.1 Quasi-Static Material Characterization ... 194
7.2 Dynamic Material Characterization ... 195
7.3 Finite Element Modeling of Quasi-Static Material Characterization ... 195
7.4 Finite Element Modeling of the Chrysler Engine Mount... 197
7.5 Component Characterization ... 198
7.6 Validation of Finite Element Models of the Chrysler Engine Mount ... 199
References ... 200
Appendix A ... 204
MATLAB/Octave script to compute Oberkampf-Trucano error metric for LS-DYNA model of ASTM D412 simple tension material characterization process ... 204
Appendix B ... 206
MATLAB/Octave script to determine Ogden material model coefficients ... 206
Appendix C ... 218
MATLAB/Octave function used with a minimization function (in the previous script) to determine Ogden material model coefficients ... 218
Appendix D ... 220
Summary of material characterization models parametric studies – sorted by validation metric ... 220
Appendix E ... 226
Summary of material characterization models parametric studies – sorted by CPU time... 226
xi
List of Figures
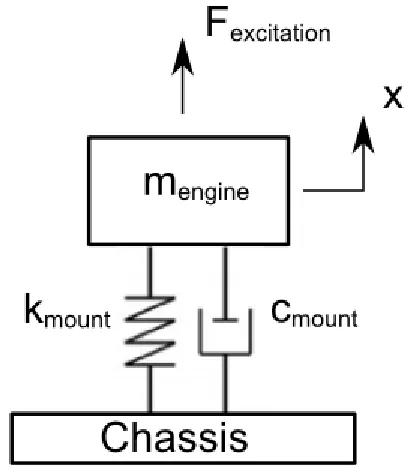
Figure 1: One degree of freedom, mass-spring-damper model of the engine suspension ... 5
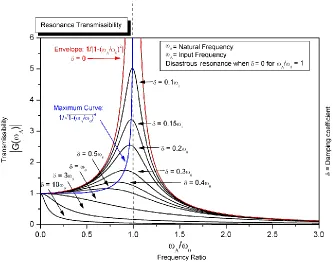
Figure 2: Engine suspension (under-damped 2nd order system) frequency response (MasterHD, 2008). ... 7
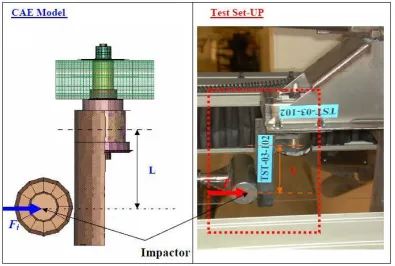
Figure 3 - Chrysler rubber bushing CAE model and experimental validation. ... 9
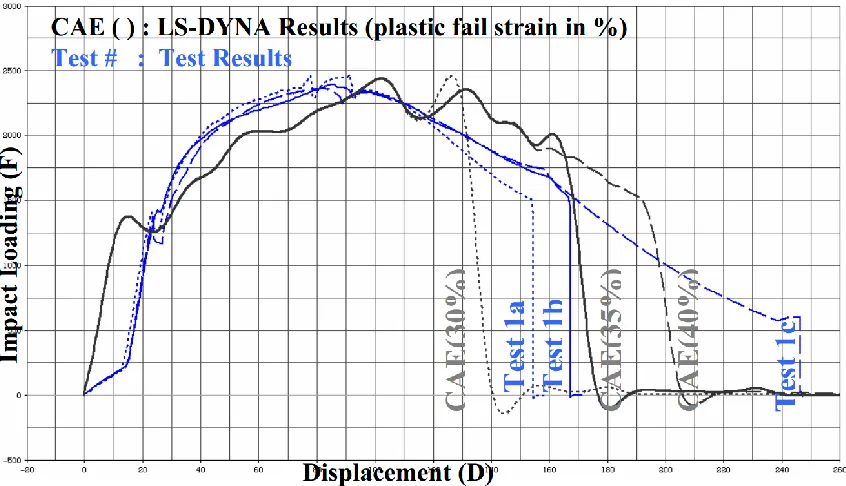
Figure 4: Force-displacement responses of Chrysler body mount CAE models validated with respect to mechanical characterization of a physical component. ... 10
Figure 5: ASTM tensile specimen die (ASTM International, 2009). ... 26
Figure 6: Kolsky pressure bar apparatus. ... 29
Figure 7: Split Hopkinson pressure bar. ... 31
Figure 8: Methodology roadmap. ... 37
Figure 9: Removal of rubber segments to prepare quasi-static material characterization specimens (simple compression specimen preparation shown). ... 39
Figure 10: Fortuna leather skiving machine in FIAT Mirafiori polymer laboratory. ... 40
Figure 11: Mitotoyo measuring device consistent with ASTM standard D3767 for measuring thickness of rubber components with a specified force of compression. ... 41
Figure 12: Microtechnica optical metrology system. ... 41
Figure 13: Pure shear (planar tension) material characterization. ... 42
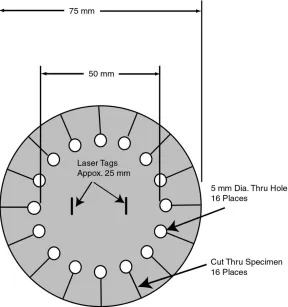
Figure 14: Equibiaxial tension material characterization. ... 43
Figure 15: Equibiaxial tension specimen dimensions. ... 43
Figure 16: Simple tension (ASTM D412 Type D) finite element model, coarse mesh. ... 47
Figure 17: Engineering stress-strain input to MAT 181 for finite element models of quasi-static material characterization processes. ... 47
Figure 18: Simple tension finite element model compatible with automatic tetrahedron remeshing. ... 49
Figure 19: Simple compression finite element model, coarse mesh. Three planes of symmetry labeled 1, 2, and 3. ... 50
Figure 20: Planar tension (pure shear) finite element model, coarse mesh. ... 52
Figure 21: Equibiaxial tension finite element model, coarse mesh... 54
xii
Figure 23: Simple compression AXEL data, strain rate sensitivity analysis, (a) small strains, (b)
full stress-strain curves... 58
Figure 24: LS-DYNA uniaxial stress-strain input. ... 59
Figure 25: Comparison between AXEL material characterization data and Ogden model (6 terms), coefficients determined using MARC, (a) pure shear (planar tension), (b) simple tension, (c) simple compression, (d) equibiaxial tension. ... 64
Figure 26: 8 Term Ogden Material Model (coefficients identified using MATLAB), (a) pure shear (planar tension), (b) simple tension, (c) simple compression, (d) equibiaxial tension. ... 68
Figure 27: (a) 2mm and (b) 1 mm average element edge length tetrahedron element mesh, finite element model of Chrysler RT platform transmission mount. ... 71
Figure 28: 1mm average edge length hexadron mesh, finite element model of Chrysler RT platform transmission mount. ... 72
Figure 29: 2mm average edge length tetrahedron mesh from hexahedron-meshing simplified geometry. ... 75
Figure 30: Coarse mesh using a combination of shell and solid element to represent the rubber regions. ... 76
Figure 31: Comparison between two of the coarsest meshes used in this research, (a) 4 mm average element edge length, (b) Chrysler supplied mesh, 8 mm average element edge length. .. 77
Figure 32: Contact interfaces for model with tied contact replacing merged nodes. ... 78
Figure 33: Initial fixture design and finite element model... 79
Figure 34: Revised fixture design and finite element model. ... 80
Figure 35: Quasi-static component characterization displacement profile. ... 81
Figure 36: Dynamic characterization apparatus. ... 82
Figure 37: (a) Prescribed and actual displacement and (b) velocity of the hydraulic cylinder over time, specimen #4. ... 83
Figure 38: Finite element model of engine mount including steel brackets... 84
Figure 39: Finite element model of dynamic component characterization process. ... 85
Figure 40: Quasi-static uniaxial stress-strain data. Sources: FIAT polymer laboratory and AXEL Testing Services, (a) simple tension, (b) simple compression. ... 88
Figure 41: Specimen tracking methodology. ... 89
xiii
Figure 43: Comparison between simple compression material characterization and equibiaxial
tension with stress transformation. ... 91
Figure 44: One element simple tension model, FIAT data. ... 93
Figure 45: Material model performance in simple tension with uniaxial tension-compression input data. ... 94
Figure 46: Coarse hexahedron mesh, ASTM D412 Type D specimen. ... 96
Figure 47: Model of simple compression test, coarse hexahedron mesh. ... 97
Figure 48: Energy balance for element formulation 1, coarse discretization. ... 98
Figure 49: Planar tension (pure shear) model, hexahedron elements, (a) coarse mesh, (b) coarse mesh, response of element formulation 3 removed, (c) 3rd level of mesh refinement. ... 100
Figure 50: Poor performance of a coarse mesh of tetrahedron elements of the planar tension (pure shear) material characterization process with MAT 181. ... 101
Figure 51: Lack of improvement of results with 1 level of refinement of the tetrahedron mesh of the planar tension (pure shear) material characterization model with MAT 181. ... 102
Figure 52: Stress-strain response of model employing tetrahedron elements, model of planar tension (pure shear) material characterization process, MAT 181, (a) 2nd level of mesh refinement, (b) 3rd level of mesh refinement. ... 103
Figure 53: Equibiaxial tension, MAT 181, (a) coarse hexahedron mesh, (b) 1st level of refinement. ... 105
Figure 54: Equibiaxial tension models, coarse tetrahedron mesh. ... 106
Figure 55: Energy balance, simple tension, strain rate of 0.01 1/s. ... 107
Figure 56: Energy balance plot for element formulation 1, simple tension model, coarse hexahedron element mesh. ... 109
Figure 57: Element formulation 1, (a) immediately prior to instability, (b) after instability associated with poor energy balance. ... 109
Figure 58: Simple tension model, hexahedron element formulation 1, refined mesh. ... 110
Figure 59: MAT 77O (8 Terms), simple tension finite element model, coarse hexahedron mesh, element formulation 41 (EFG). ... 112
Figure 60: Energy balance of simple tension model using the Ogden material model with 8 terms and element formulation 3. ... 113
xiv
Figure 62: (a) Force output from simple tension model employing automatic tetrahedron re-meshing, (b) Nodal displacement output (to calculate strain) from simple tension model
employing automatic tetrahedron re-meshing, (c) Stress-strain response of simple tension model employing automatic tetrahedron re-meshing. ... 116
Figure 63: Simple compression finite element model, hexahedron element formulation1 energy balance. ... 117
Figure 64: Element hourglassing, simple compression model, element formulation 1, Ogden material model (6 terms). ... 118
Figure 65: Simple compression model, revised mesh, coarsened through the thickness. ... 118
Figure 66: Simple compression finite element models, coarse tetrahedron mesh (MAT 77O, 6 terms), element formulation 13. ... 119
Figure 67: Simple compression finite element models, MAT 77O (8 Terms), hexahedron element formulations, (a) coarse discretization, (b) refined mesh. ... 121
Figure 68: Planar tension (pure shear) finite element model, (a) coarse hexahedron mesh, (b) first level of mesh refinement, (c) 2nd level of mesh refinement. ... 123
Figure 69: Stress-strain response of finite element models of the planar tension (pure shear) material characterization process (MAT 77O, 6 terms), tetrahedron element formulations, (a) coarse discretization, (b) 2nd level of mesh refinement. ... 125
Figure 70: Planar tension (pure shear) finite element models, MAT 77O (8 Terms), hexahedron element formulations, a) coarse discretization, b) 1st level of mesh refinement, c) 2nd level of mesh refinement, d) 3rd level of mesh refinement. ... 127
Figure 71: Planar tension (pure shear) finite element models, MAT 77O (8 Terms), tetrahedron element formulations, (a) coarse discretization, (b) 1st level of mesh refinement, (c) 2nd level of mesh refinement, (d) 3rd level of mesh refinement. ... 130
Figure 72: Stress-strain responses of finite element models of the equibiaxial tension material characterization process (MAT 77O, 6 terms), hexahedron elements, (a) coarse discretization, (b) 2nd level of mesh refinement. ... 132
Figure 73: Stress-strain responses of finite element models of the equibiaxial tension material characterization process, MAT 77O (6 terms), tetrahedron element formulations, (a) coarse discretization, (b) 2nd level of mesh refinement. ... 133
xv
Figure 75: Stress-strain responses of finite element models of the equibiaxial material characterization process (MAT 77O, 8 terms), tetrahedron element formulations, (a) coarse
discretization, (b) 2nd level of mesh refinement. ... 136
Figure 76: 1mm, 2mm, and 3mm solid hexadron meshes, element formulation 2, solver R5.1.1, hub translation in z-direction. ... 137
Figure 77: 2mm solid hexahedron mesh, z-translation of hub, study of element formulation (solver R5.1.1). ... 138
Figure 78: Study of solver version and element formulation for the 2mm solid hexahedron mesh loaded in the positive z-direction, (a) element formulation 1, (b) element formulation 2, (c) element formulation 3. ... 140
Figure 79: Analysis of solver version, element formulation, and level of discretization with translation of the hub in the x-direction. ... 141
Figure 80: Analysis of element formulation, level of discretization (hexahedron mesh) and solver version with translation of the hub in the y-direction. ... 141
Figure 81: Comparison of element formulation 3 with solvers R3 and R5 for translation of the hub in the y-direction (2mm mesh). ... 142
Figure 82: Force-displacement comparison between a 2 mm hexahedron mesh and a 4 mm shell-solid mesh, translation of hub in x-direction. ... 143
Figure 83: Force-displacement response, 4mm and 8mm meshes, x-translation of hub. ... 144
Figure 84: 4 mm global average element edge length, hexahedron solid mesh with shell elements for thin rubber regions, evidence of the need for local refinement of the mesh. ... 145
Figure 85: Local refinement of the mesh. ... 145
Figure 86: Local mesh refinement yields a force-displacement response more similar to a globally refined mesh. ... 146
Figure 87: Comparison of different types of hourglass control. ... 147
Figure 88: Study of hourglass control coefficients for hourglass control type 7. ... 148
Figure 89: External work, hourglass control type study. ... 148
Figure 90: Comparison between hexahedron and tetrahedron meshes from the original unmodified geometry and geometry simplified for meshing with hexahedron elements. ... 150
Figure 91: Comparison between tetrahedron element formulations 4, 10, and 13 (2mm element size, mesh generated from unmodified CAD data provided by Chrysler). ... 150
xvi
Figure 93: Energy balances for models with tied contact implemented with mesh that had
previously used merged nodes, element formulation 1. ... 152
Figure 94: Revised model to improve energy balance with tied contact. ... 152
Figure 95: Force displacement response for revised mesh to eliminate initial penetrations of tied contact interfaces. ... 153
Figure 96: Energy balances for models with tied contact and revised mesh to eliminate initial penetrations, element formulation 1. ... 153
Figure 97: Modifications to finite element model of revised fixture design: removal of washers and corresponding bolt preload. ... 156
Figure 98: Refined mesh of loading fixture... 157
Figure 99: Quasi-static force displacement response of specimens 1 through 3, (a) test #1 of specimen #1, (b) test #2 of specimen #1, (c) test #1 of specimen #2.. ... 159
Figure 100: First loading and unloading cycle, quasi-static component characterization, (a) tension, (b) compression. ... 161
Figure 101: Tensile and compression loading, first and second cycles, (a) tension, (b)
compression. ... 163
Figure 102: Bracket deformation, specimen #1, test #1. ... 164
Figure 103: Separation of fixture plates, specimen #1, test #1. ... 164
Figure 104: (a) Displacement of the hydraulic cylinder and (b) force (from load cell) over time.
... 165
Figure 105: Dynamic force-displacement response of the Chrysler engine mount... 166
Figure 106: Quasi-static and dynamic force-displacement responses of Chrysler powertrain suspension component. ... 167
Figure 107: Quasi-static force-displacement characteristics in tension (finite element model). . 168
Figure 108: Engine mount finite element model validation, tensile loading, quasi-static
characterization ... 169
Figure 109: Engine mount finite element model validation, tensile loading, quasi-static
characterization, tied contact replaced with constraints. ... 170
Figure 110: Finite element model validation, compressive loading, quasi-static characterization.
... 171
Figure 111: Finite element model of compressive loading and high resolution image. ... 171
xvii
xviii
List of Tables
Table 1: Standard ASTM D412 Dumbbell Dies. ... 27
Table 2: Chrysler meshing guidelines and simple tension model quality, tetrahedron meshes. .... 46
Table 3: Chrysler meshing guidelines and simple tension model quality, hexahedron meshes. ... 46
Table 4: Chrysler meshing guidelines and mesh quality for simple tension model with automatic re-meshing ... 48
Table 5: Chrysler meshing guidelines and simple compression model quality, tetrahedron meshes.
... 50
Table 6: Chrysler meshing guidelines and simple compression model quality, hexahedron
meshes. ... 51
Table 7: Chrysler meshing guidelines and planar tension (pure shear) model quality, tetrahedron meshes. ... 52
Table 8: Chrysler meshing guidelines and planar tension (pure shear) model quality, hexahedron meshes. ... 53
Table 9: Chrysler meshing guidelines and equibiaxial tension model quality, tetrahedron meshes.
... 54
Table 10: Chrysler meshing guidelines and equibiaxial tension model quality, hexahedron
meshes. ... 55
Table 11: Relationships between principal stretch ratios for common material characterization processes. ... 61
Table 12: 6 term Ogden model obtained using MARC-Mentat. ... 65
Table 13: Oberkampf-Trucano validation metrics for 6 term Ogden model from MARC-Mentat.
... 65
Table 14: 8 term Ogden model, coefficients identified using MATLAB. ... 69
Table 15: Oberkampf-Trucano validation metric, 8 term Ogden model, MATLAB coefficients. 69
Table 16: CPU time breakdown, FIAT computing cluster, MPP solver. ... 73
Table 17: Chrysler meshing guidelines and simple compression model quality, tetrahedron meshes of the Chrysler powertrain suspension component. ... 73
Table 18: Chrysler meshing guidelines and simple compression model quality, hexahedron meshes of the Chrysler powertrain suspension component. ... 74
xix
Table 20: Oberkampf-Trucano validation metrics for single element models to compare material models with uniaxial stress-strain input. ... 94
Table 21: Mass scaling, single element model, strain rate of 0.01 1/s ... 107
Table 22: Oberkampf-Trucano validation metric, single element models to assess strain rate sensitivity modeling with MAT 181. ... 107
Table 23: Comparison between simple tension models using MAT 181 and MAT 77O (6 terms).
... 176
Table 24: Comparison between simple tension models using MAT 181 and MAT 77O (8 terms).
... 177
Table 25: Comparison between simple compression finite element models using MAT 181 and MAT 77O (6 terms) ... 178
Table 26: Comparison between simple compression finite element models using MAT 181 and MAT 77O (8 terms). ... 179
Table 27: Comparison between planar tension (pure shear) models using MAT 181 and MAT 77O (6 terms), hexahedron element formulations. ... 180
Table 28: Comparison between planar tension (pure shear) models using MAT 181 and MAT 77O (6 terms), tetrahedron element formulations. ... 181
Table 29: Comparison between planar tension (pure shear) models using MAT 181 and MAT 77O (8 terms), hexahedron element formulations. ... 182
Table 30: Comparison between planar tension (pure shear) models using MAT 181 and MAT 77O (8 terms), tetrahedron element formulations. ... 183
Table 31: Comparison between equibiaxial tension models using MAT 181 and MAT 77O (6 terms), hexahedron element formulations. ... 184
Table 32: Comparison between equibiaxial tension models using MAT 181 and MAT 77O (6 terms), tetrahedron element formulations. ... 185
Table 33: Comparison between equibiaxial tension models using MAT 181 and MAT 77O (8 terms), hexahedron element formulations. ... 186
xx
List of Abbreviations, Symbols, Nomenclature
AMD Advanced Micro Devices
BOF Body on frame
CAD Computer aided design
CAE Computer aided engineering
CDC Center for disease control
CPU Central processing unit
CTC Chrysler Technical Center
DP Double precision
EFG Element free Galerkin
EPDM Ethylene propylene diene monomer
EuroNCAP European New Car Assessment Program
FE Finite element
FIAT Fabbrica Italiana Automobili Torino
GHz Gigahertz
GPa Gigapascal
GTM Gassmann Theiss Messtechnik
IIHS Insurance Institute for Highway Safety
ISO International Organization for Standardization
LSTC Livermore Software Technology Corporation
mm Millimeter
MPa Megapascal
MPP Massively parallel processing
N Newton
NCAP New Car Assessment Program
NI National Instruments
NVH Noise, vibration, and harshness
PdT Politecnico di Torino
PSSF Penalty stiffness scaling factor
xxi
SHPB Split Hopkinson pressure bar
SMP Shared memory parallel
SP Single precision
TSSF Time step scaling factor
USB Universal serial bus
xxii
List of Nomenclature
Fexcitation Force exerted by the powertrain on the powertrain suspension
mengine Mass of the powertrain
x Displacement of the powertrain
cmount Damping of the powertrain suspension
kmount Stiffness of the powertrain suspension
w Excitation frequency of the powertrain
wn Natural frequency of the powertrain suspension
Fchassis Force exerted by the powertrain suspension on the chassis
T Powertrain suspension force transmissibility
s Laplace variable
ζ Damping ratio of the powertrain suspension
s* Laplace variable normalized with respect to the powertrain suspension
natural frequency
m Mass
c Damping
k Stiffness
Fext External Forces
Δt Explicit time integration critical time step
M1 Discrete element nodal mass
M2 Discrete element nodal mass
L Element length
ρ Material density
E Elastic modulus
ν Poisson’s ratio
λx Stretch ratio in the x-direction
Lo Initial element length
δ Element deformation
εx Strain in the x-direction
xxiii
εz Strain in the z-direction
σx Normal stress in the x-direction
σy Normal stress in the y-direction
σz Normal stress in the z-direction
τxy Shear stress in the y-direction on a plane with a normal in the
x-direction
τxz
Shear stress in the z-direction on a plane with a normal in the
x-direction
τyz
Shear stress in the z-direction on a plane with a normal in the
y-direction
W Strain energy density
C1 Mooney material model constant
C2 Mooney material model constant
λ1 Stretch ratio in the first principal direction
λ2 Stretch ratio in the second principal direction
λ3 Stretch ratio in the third principal direction
I1 First stretch ration invariant
I2 Second stretch ratio invariant
I3 Third stretch ratio invariant
bj Ogden material model parameters
cj Ogden material model parameters
C100 Frazer-Nash material model coefficient
U Strain energy density
Ni(x) Lagrange interpolation function
w(x) Beam element deflection
Ψ(x) Beam element angle of deflection
si Angle of deflection of beam at node i
wi Deflection of beam at node i
xA Axial position on beam of node A
xxiv
δ1 Deformation in the first principal direction
δ2 Deformation in the second principal direction
δ3 Deformation in the third principal direction
S Simple tension stress
SPure shear Pure shear (planar tension) stress
SBiaxial Equibiaxial tension radial stress
V Error metric proposed by Oberkampf and Trucano
y Numerical data being validated
Y Experimental data for model validation
ZBar Mechanical impedance of a bar of a split bar apparatus
ABar Cross sectional area of bar of a split bar apparatus
CBar Speed of sound in bar material
EBar Elastic modulus of bar material
ρBar Density of bar material
TIncident Time duration of the incident pulse
LStriker Length of the striker bar
CStriker Speed of sound in the striker bar material
σIncident Stress magnitude of the incident pulse
vStriker Velocity of the striker bar
εIncident Strain magnitude of the incident pulse
εReflected Strain magnitude of the reflected pulse
εTransmitted Strain magnitude of the transmitted pulse
v1
Velocity of the surface of the input bar at the input bar-specimen
interface
v2
Velocity of the surface of the output bar at the specimen-output bar
interface
LSpecimen Length of the split Hopkinson pressure bar specimen
σUniaxial Uniaxial stress (simple tension and compression)
εUniaxial Uniaxial strain (simple tension and compression)
xxv
σEquibiaxial Equibiaxial tension radial stress
σSimple compression Simple compression stress
εEquibiaxial Equibiaxial tension radial strain
σFixture Approximate maximum stress in steel plates of fixture
M Moment applied to beam approximation of fixture
c Thickness of beam approximation of fixture plate
I Moment of area of fixture plate
σBolt preload Approximation of stress in fixture plate due to bolt preload
FBolt preload Fixture bolt preload
rwasher inner Inner radius of fixture bolt washer
1
Chapt
e
r 1: Introduction
From 2011 to 2020 the United Nations General Assembly has instituted a Decade of
Action for Road Safety. This initiative seeks to save 5 million lives over this ten year
period (WHO, 2011). It is estimated that over 1 million fatalities and 50 million injuries
occur each year worldwide as a result of motor vehicle incidents (WHO, 2004). Over the
next 20 years these figures are projected to increase by 65%. In the USA motor vehicle
incidents are the leading cause of death in the 5-34 age group (CDC, 2010) with over 2.3
million motor transport incident related admissions to emergency departments in 2009
(CDC, 2011). Crash related fatalities in 2005 cost an estimated $41 billion in medical
costs and work loss.
Vehicle collisions are the second leading cause of death in Canada and the third leading
cause of both hospitalizations and disabilities (SMARTRISK, 2009). The economic
impact of transportation incidents is staggering at approximately $4 billion each year.
Additionally, injuries resulting from transportation incidents are the leading cause of
economic losses in the form of reduced productivity. Consistent with North America, in
the European Union road traffic incidents are the leading cause of death for the
population under 45 years of age (Genta G, 2009). Government crashworthiness
standards dictate impact performance requirements and are consistently updated to ensure
improved protection of the occupant. Additionally, in the USA the new car assessment
program (NCAP) and the insurance institute for highway safety (IIHS) rate vehicles on
their impact performance and this data is provided to consumers to consider when
purchasing a vehicle.
Safety may be one of the more important vehicle characteristics for consumers
considering the purchase of a new vehicle. A study in Europe found that European New
Car Assessment Program (EuroNCAP) ratings and safety related features were the
highest priorities among consumers that had recently purchased a new vehicle (Koppel S,
2008). This study was completed using questionnaires in Sweden, a European country
with a low number of fatalities resulting from transport incidents, and telephone
2
incidents. In Sweden potential participants with a recent new vehicle purchase were
identified through insurance records. A consulting group in Spain conducted telephone
interviews. Eligibility criteria for the telephone interviews were defined by the
demographics of the Swedish participants.
Other important considerations for consumers are ride quality and levels of noise,
harshness, and vibration (NVH). A variety of elastomeric materials are used in vehicles
as isolators, dampers, and mounts between body and frame, on the engine cradle, etc.
These flexible isolators are mainly made of rubber and other polymeric materials. They
are usually enclosed in a metallic tube to protect and contain the flexible elements. These
components are critical components of modern vehicles because of their effect on the
perceived quality in terms of ride and NVH.
The term crashworthiness originated in the aerospace industry in the 1950s. In the
automotive industry this term refers to the design of a vehicle’s structure to deform in a
controlled manner in a crash and absorb energy to protect the occupants. There are
several requirements in designing a vehicle for crashworthiness. The passenger
compartment must be stiff to prevent harmful intrusions. However, there must be zones
where structural elements, crash boxes for example, can dissipate energy through
progressive deformation reducing accelerations experienced by the occupant to tolerable
levels. Additionally, the fuel system must be protected and the roof must be structurally
sound in rollover type events.
The connections between the car body and subframe may have a significant effect on the
impact performance of modern vehicles. These connections consist of a bolt in a rubber
bushing which is commonly contained in a metal tube. As an example of the importance
of these connections, the occupant compartment, as part of the automotive body, may be
connected to a front subframe by connections of this type. By allowing relative
displacement between the occupant compartment and the front subframe, which is
designed to manage energy in a frontal crash, the accelerations experienced by the
occupant may be influenced by these connections. However, the rubber components are
3
Similar rubber components can also be found in the engine mounts and chassis
suspension connections. Researchers at Ford Motor Company have documented the
importance of suspension lower control arm bushings on the impact performance of the
vehicle (Eguia M H. M., 2005). In many computer models the suspension connections
are rigid body joints (e.g. spherical, revolute, and cylindrical joints). Another common
technique to model these rubber components replaces the component with discrete spring
and damper elements (Park S, 2004). However, these approaches result in a model that
may not be suitable for the complex loading resulting from an impact. Additionally, the
resulting models are poor predictors of failure modes and may give misleading results in
the design phase. Airbag deployment strategies for low speed impacts may also be
affected.
However, modeling the mechanical behaviour of rubber is difficult due to the nonlinear
properties of the material and the large deformations that are commonly encountered with
rubber components. The structural finite element (FE) method solves partial differential
equations of motion coupled with mechanical material behaviour over a discretized
domain (elements). For nearly incompressible materials (e.g. rubber) a problem known
as element locking can introduce error into the model in the form of increased element
stiffness reducing the level of deformation for a given load.
The purpose of this research was to develop methodologies for modelling components
employing hyperelastic materials. A primary consideration was the application: full
vehicle models for crashworthiness assessment and design. These methodologies were
developed through extensive parametric studies of modelling techniques. Furthermore,
material characterization was performed to obtain suitable, high quality material data and
to start from the most fundamental stage of the modeling process to have a thorough
understanding of the many factors and their interdependence. Ultimately, this research
concluded with quasi-static and dynamic experimental characterization of a Chrysler
4
This thesis documents this research as follows. A literature review summarizes
fundamental knowledge for the completion of the methodology of this work as well as
recent or important contributions to scientific and engineering literature on the topic of
the crash performance influence of rubber noise and vibration isolators. This is followed
by a detailed description of the methodology for this research. The corresponding results
are presented for each step of the methodology. Finally, these results are discussed and
conclusions are stated. Appendices for important but verbose data and resources are
5
Chapter 2: Literature Review
2.1 Powertrain Suspension
The most important chassis isolators for noise and vibration may be those supporting the
powertrain. These components may also have critical roles to play in vehicle
crashworthiness. The frequency range of the dynamic excitation of the chassis by the
powertrain is directly proportional to the range of possible engine speeds (Morello L,
2011). These frequencies for the engine and transmission are functions of the number of
cylinders, the cylinder configuration, and the gear ratios in the transmission. The
suspension of the engine is designed considering two relatively simple considerations:
minimize transmission of dynamic forces to the chassis and minimize engine
displacement with respect to the chassis. If the suspension of the engine is simplified to a
one degree of freedom mass-spring-damper system a simple analysis of this system can
aid in its design. If the chassis is assumed to be stationary the forces acting upon the
engine and the chassis and the force transmissibility transfer function can be defined as
shown in Equations 1 through 4.
6
̈ ̇
̇
̇
̈ ̇
The force transmissibility function can be non-dimensionalized to consider damping ratio
rather than damping and by normalizing the Laplace variable with respect to the natural
frequency. The resulting form of this equation is given by Equation 5. This transfer
function is plotted with respect to excitation frequency and damping ratio in Figure 2. For any amount of damping the engine suspension reduces the transmitted force when the
ratio of excitation frequency to natural frequency is greater than the √2. Therefore, for
the minimum excitation frequency (directly proportional to the minimum engine speed) a
maximum suitable natural frequency may be calculated. Since the mass of the engine is
essentially fixed it is the stiffness of the engine mount that is the primary design variable.
To reduce the transmissibility the natural frequency of the engine suspension should be
minimized which is achieved by minimizing the stiffness. However, if the stiffness is
excessively low large displacements of the powertrain will be possible. It is clear that
displacements must be within reasonable limits to avoid undesirable contact between the
engine and surrounding components and structures.
7
Figure 2: Engine suspension (under-damped 2nd order system) frequency response
(MasterHD, 2008).
Many engine support structures are designed with a non-linear force-displacement
response to minimize stiffness for low displacements but with a marked increase in
stiffness after sufficient displacement. Elastomers are often used for their low stiffness
and internal damping. After sufficient displacement internal contact may occur within
the engine mount such that small additional displacements result in relatively large
compressive strains. The incompressibility of the rubber further increases the stiffness.
As shown in Figure 2 the damping is a more complex characteristic. At low frequencies, particularly close to the natural frequency, damping should be maximized to reduce
transmissibility. However, at high frequencies increased damping increases
transmissibility. Elastomers used for such components exhibit varying internal damping
with respect to frequency but many high end vehicles may use hydraulic mounts which
8
2.2 Review of Research on Automotive Chassis Components Incorporating
Hyperelastic Materials
Rubber bushings, isolators, and dampeners for automotive applications commonly consist
of a hollow elastomer cylinder between two metal cylindrical sleeves. Many are of the
mold bonded type which is manufactured using injection molding to inject the elastomer
between the metal sleeves where it then cures and bonds with the metal. This may be
followed by a process known as swaging where the outer sleeve is compressed to
eliminate residual tensile stresses in the elastomer due to shrinkage during the curing
process. Researchers in the USA at Rowan University (NJ) and the University of
Michigan performed experimental tests and numerical simulations (FEM) of this type of
bushing under several types of loading (Kadlowec J, 2003). Radial loads were applied by
loading the internal sleeve normal to the axis of the bushing and fixing the outer sleeve.
Torsional loading was applied to the internal sleeve about the axis of the bushing with the
outer bushing again fixed. For the combined radial and torsional loading the bushing was
loaded in torsion to a pre-set angle after which the radial load was applied. Test
specimens were subjected to several loading cycles to precondition the material before
running the tests against which the finite element models would be compared.
The finite element modeling was completed using ABAQUS. It was not indicated how
the material model parameters were obtained. The cooling and swaging manufacturing
processes were first simulated to capture the prestress in the material. The resulting
model correlated well with experimental data for radial and torsional loading applied
separately. However, the model did not correlate well with the combined radial and
torsional loading. It was proposed that through more extensive material testing better
material model data could be obtained which may improve the finite element model.
Morman and Pan (Morman K, 1988) modeled the mechanical behaviour of several
elastomeric automotive components. The simplest model was a bonded cylindrical
block: a rubber cylinder bonded to two steel end plates. The authors of this publication
also modeled a specific automotive rubber bushing known as a Silentbloc. With this type
9
draft angles using lubricant and severe deformation of the rubber occurs. The rubber is
not bonded to the metal of the sleeves. Morman and Pan created finite element models of
the assembly process, axial loading, and radial loading. The FE model was compared
with experimental data and simple analytical models. The FE model did not correlate
well with the experimental data but the response of the FE model was improved by
modeling the preload. The lack of accuracy may partially be the result of the use of a
very simple, 2 parameter material model.
Figure 3 - Chrysler rubber bushing CAE model and experimental validation.
Researchers at Daimler Chrysler presented a paper at the 8th International LS-DYNA
Users Conference in 2004 on their models of a rubber vehicle mount (Park S, 2004).
Their model used the Mooney-Rivlin rubber material model (MAT_27) and included
preloading of the bolt holding the assembly together as shown in Figure 3. The bolt was
preloaded by dividing the bolt into upper and lower halves and applying forces to draw
these two components together thereby compressing the rubber bushing. When the
proper preload had been reached a tied contact algorithm was used to connect the two
10
supplier. The steel bolts and the plates connected by the isolator used the piecewise
linear plasticity material model (MAT_24). An impact test, as shown in Figure 3, was used to validate the model which exhibited a strong correlation with the experimental
results (Figure 4).
Figure 4: Force-displacement responses of Chrysler body mount CAE models validated
with respect to mechanical characterization of a physical component.
Researchers at the University of Iowa compared analytical, numerical, and experimental
load-deflection responses for rubber bushings subjected to several different types of
loading (Chen J, 1997). Two rubber material models are used for the finite element
modelling: the Mooney-Rivlin model and a Cubic model proposed by Yeoh (Yeoh,
1990). A comprehensive review of the Mooney-Rivlin material model is presented in a
later section of this thesis. The finite element modelling was completed using the
pressure projection method which avoids volumetric locking. The bushing was loaded
axially, in torsion, and radially (each type of loading was applied separately). The
authors compared their models with analytical 2D plane stress and plane strain solutions.
Their conclusions include that for very short bushings a 3D analysis is necessary for
11
In a more recent investigation Dharwadkar and Adivi investigated the modelling of
engine suspension components for crash simulations (Dharwadkar N, 2011). The authors
of this thesis modeled the left hand side engine suspension mount (the connection
between the gearbox and chassis structural members) used in most Volvo vehicles. The
mount is manufactured by Trelleborg Automotive in Germany. This engine mount
consists primarily of rubber and aluminum. Modelling was completed using LS-DYNA.
The rubber components used MAT_77 (MAT_HYPERELASTIC_RUBBER). The
aluminum components used a user defined material model (MAT_48). This rubber
material model cannot consider strain rate effects.
The model was validated with respect to bench testing of an engine mount with strong
correlation between the numerical model and the experimental results. The validated
engine mount model was utilized in a full vehicle model of a Volvo V60 and simulations
of full width frontal impacts and offset frontal impacts were completed. In experimental
full vehicle crash testing there was a failure in the aluminum of the engine mount. The
authors tuned their aluminum material model to obtain a similar failure. The effects of
the revised model of the engine mount on the crash pulse or response of the occupant
were not considered at the time of publication.
Engineers at Ford Motor Company published a technical paper with SAE in 2003 on their
efforts to model body mounts in body on frame (BOF) configuration vehicles (Chen Y,
Dynamic Testing and CAE Modeling of Body Mount - An Application in the Frontal
Impact Analysis of a Body-on-Frame Vehicle, 2003). This publication contains a great
deal of information on experimental testing carried out by Ford engineers. There are
many interesting observations. Connections between the body and frame were found to
fail due to failure of the body mount itself or due to floor pan rupture. Preloading of the
body mounts as is completed during vehicle assembly was accounted for in component
level testing. Preloading due to the weight of the body was also considered. Neither was
found to be significant. Additionally, the elastomer portion was not found to have a
significant effect on the structural behaviour. However, the unloading behaviour of the
mount was deemed important. In a related publication Ford engineers modeled an engine
12
and CAE Modeling of Engine Mounts and the Application in Vehicle Crash Analysis,
2003) (Li M, 2005).
Researchers at Ford Motor Company have extensively studied suspension lower control
arm structure behaviour in impact conditions (Eguia M H. M., 2005). Rubber bushings
are used at the connections between the lower control arm and structural elements of the
sprung mass of the vehicle. It was observed that these bushings allow for significant
relative movement between the lower control arm and the frame for degrees of freedom
normally constrained by the suspension mechanism. The lower control arm assembly can
be critical in achieving optimal energy absorption since the lower control arm reinforces
the vehicle frame and may prevent or influence plastic deformation of this critical region.
In one of many related publications the same researchers from Ford Motor Company
document their investigations into the impact performance of lower control arms using
numerical simulation (Huang M, 2005). The authors modeled the rubber bushings using
beam elements with customized properties. One challenge highlighted by the authors
was the need to complete physical testing to obtain data to accurately model the bushings
using the beam element technique. A specific challenge was the press fit between the
bushings and the lower control arm.
These researchers at Ford Motor Company also investigated the mechanical performance
of suspension bushings experimentally (Eguia M T. T., 2006). These investigations
considered lower control arm bushings from two vehicles loaded axially, radially, and in
bending about axes running radially. The loads were applied by an impact using a form
of sled test at speeds of 6, 8, 10, 15, and 17 mph (10, 13, 16, and 24 km/h). The
publication documents deficiencies in their apparatus (plastic deformation of the fixtures)
yielding invaluable advice for further research on this topic. Bushing stiffness varied
considerably for the different types of bushing and the direction in which the load was
applied. The highest stiffness encountered was 100 000 lbf/inch (17500 N/mm) for a
bushing loaded axially. Another bushing recorded the lowest stiffness, also in the axial
direction, of 5200 lbf/inch (910 N/mm). The peak load reached in testing, resulting in
13
2.3 Structural, Transient Finite Element Method
In the transient structural finite element method the momentum equation, coupled with
material stress-strain relationships, is solved to obtain displacements, velocities, and
accelerations for all nodes of a structure. The coupling equations between stress (force in
the momentum equation) and strain (calculated from displacements) are known as
constitutive equations or, more commonly, the material model. For each node the mass
(m), dampening (c), and stiffness (k) is determined by the material surrounding each node
(the elements). External forces are denoted Fext. A node can be connected to several
elements, each of which will contribute to the nodal mass, damping, and stiffness. The
mass, stiffness, and dampening contributions of elements to nodes are determined using
the finite element (FE) method.
̈ ̇
This equation is solved numerically with respect to time using a central difference
scheme to numerically approximate derivates with respect to time. Two types of time
integration are commonly employed: explicit time integration and implicit time
integration. With explicit time integration the solution marches forward in time with the
solution at each timestep calculated using existing information (e.g. nodal displacements
and velocities and stiffness and damping of the structure at the beginning of the time
step). The numerical algorithm can be found in section 24 of the LS-DYNA Theory
Manual (Hallquist, 2006). The maximum timestep is restricted to the transit time for the
stress wave propagation speed across the smallest element. For a beam element this
speed depends on the modulus of elasticity (E), the density of the material (ρ), and the
characteristic length of the element (L). The function is given in Equation 7. Similar
relationships are given by Equations 8, 9, and 10 for discrete, shell, and solid elements
(positive, nonzero strain rates) respectively (v is Poisson’s ratio). For solid elements the
minimum time step of equation 10 assumes a constant bulk modulus. The implicit time
integration scheme does not have such a limitation on the time step but is iterative at each
time step due to a dependence on future (unknown) nodal displacements (section 34 of
14
√
√
√
√
By default the explicit time integration solver in LS-DYNA finds the element with the
smallest minimum time step. This time step is then adjusted depending upon a time step
scaling factor (TSSF) that can be modified by the user. The explicit time integrator can
be forced to use larger time steps if mass scaling is used. The solver will add mass to the
model to allow a specified larger time step without instabilities. For quasi-static analyses
mass scaling has little effect on the results. However, the ratio of kinetic energy to total
energy should be monitored to ensure this approach is reasonable.
The discrete element critical time step (Equation 8) is significant due to the use of
discrete elements in modelling contact between entities. The nodal masses at either end
of the element are denoted M1 and M2. Contact algorithms search for entities with node
through segment penetrations and insert discrete elements (springs and dampers) to
model the contact phenomenon. The critical time steps for all contact related discrete
elements are not calculated at each time step. However, the LS-DYNA solver will
display a message upon starting a simulation estimating the minimum time step for stable
contact and will suggest to the user that a smaller explicit time integration time step be
15
2.4 Hyperelastic Materials
Rubber originally referred to the compound obtained from latex of the Hevea Braziliensis
tree. This natural rubber is a hydrocarbon with the chemical formula (C5H8)n (Treloar L. ,
2009). The typical molecular weight is approximately 350 000 u. Natural rubber is in
the form of small particles (0.1 to 1 µm) in a water-based solution with rubber accounting
for approximately 35 percent. The rubber particles would aggregate if not for a protein
coating. The rubber is obtained from the latex by removing the water or by acid
precipitation; the latter produces a more pure rubber. Elastomer generally refers to
synthetic materials with properties similar to rubber.
The properties of rubber stem from the molecular structure of the material. As an
example, double bonds between carbon atoms in the continuous hydrocarbon chain react
with sulfur or other reagents during vulcanization. This process creates links between the
hydrocarbon chains. The double bonds are also the sites at which material degradation
initiates. A raw rubber that has not been vulcanized may exhibit mechanical properties
similar to vulcanized rubber for short time duration deformations as a result of
entanglements in the hydrocarbon chains. If a non-vulcanized rubber is loaded for an
extended period of time the entanglements will break down resulting in stress relaxation
and creep.
Rubber and similar elastomeric materials are capable of large deformations before
ultimate failure. Ultimate strain can be as high as 500 to 1000 percent. Stress-strain or
force-displacement curves for rubber specimens are generally quite non-linear with no
constant value for Young’s modulus. A constant Young’s modulus may be applied for
very small deformations in which case the value can be 5 orders of magnitude smaller
than Young’s modulus for steel. Rubber and similar elastomers also exhibit interesting
thermodynamic properties. There are two thermoelastic effects observed by Gough and
Joule in the 19th century: 1) rubber contracts upon heating when under a constant tensile
load and 2) rubber emits heat when loaded (Treloar L. , 2009). This heat emission is
associated with the hysteresis effects rubber exhibits with cyclic loading.
There are two contributors to the mechanical behaviour of rubber materials: elastic and
16
curve will be different for loading and unloading. The earliest strain energy density
phenomenological rubber material models did not account for hysteresis effects
commonly observed for rubbers with additional ingredients like sulfur or black carbon
(Charlton D, 1993). However, natural gum rubbers have less significant hysteresis
effects and can be better modelled using a strain energy density function. Ingredients like
sulfur or black carbon can significantly alter the molecular structure. These changes in
the molecular structure can result in a relatively high sensitivity to temperature,
environment, strain rate, loading history, and strain magnitude. When material samples
are tested to failure the data may not be reproducible due to the variability in defects.
Two methods are commonly used to model the mechanical characteristics of rubber
materials. The statistical thermodynamics method arises from the observation that rubber
in a natural state is highly irregular but as it is deformed in tension the rubber molecular
networks become more structured and the entropy is reduced (Charlton D, 1993).
However, this approach is only accurate up to approximately 50% strain (Shaw M, 1988).
Most rubber material models are based on the phenomenological approach: observation
and mathematical description of mechanical behaviour. In these models rubber is
assumed to be isotropic with random orientation of molecules in the non-deformed
condition. These assumptions of isotropy allow the use of the strain energy density
function. This approach, the use of a strain energy density function, is used due to its
capability to model non-linear elastic deformation. Rubber material models commonly
formulate this energy as a function of strain tensor invariants or stretch ratios. Stretch
ratios are calculated as shown by Equation 11 where L0 is the original length of the
specimen and L = L0 + δ where δ is the elongation.
( )
Mooney (Mooney, 1940) developed a phenomenological material model based on
assumptions that rubber is incompressible (ie. constant volume), isotropic when
17
function is given by Equation 12 where C1 and C2 are constants. Rivlin (Rivlin, 1956)
extended Mooney’s work by considering the symmetry of the strain energy function with
respect to the stretch ratios as required by isotropy. Many implementations of this
material model use the strain energy function given in Equation 16 where Cij are
constants.
)
)
∑ )
A particularly important characteristic of rubber is the near incompressibility. The
assumption of incompressibility results in a value of unity for the third stretch ratio
invariant (Equation 15). Incompressible materials undergo no change of volume when
loaded and correspondingly have a Poisson’s ratio of approximately 0.5, the upper limit on Poisson’s ratio. This upper limit can be observed for isotropic elastic materials by considering Hooke’s law as shown by Equation 17. A Poisson’s ratio of 0.5 results in
singularities when using the stress-strain constitutive equations for isotropic elastic
materials as shown in equation 18.