Scholarship at UWindsor
Scholarship at UWindsor
Electronic Theses and Dissertations Theses, Dissertations, and Major Papers
8-27-2019
E-commerce Recommendation by an Ensemble of Purchase
E-commerce Recommendation by an Ensemble of Purchase
Matrices with Sequential Patterns
Matrices with Sequential Patterns
Mehdi Naseri
University of Windsor
Follow this and additional works at: https://scholar.uwindsor.ca/etd
Recommended Citation Recommended Citation
Naseri, Mehdi, "E-commerce Recommendation by an Ensemble of Purchase Matrices with Sequential Patterns" (2019). Electronic Theses and Dissertations. 7826.
https://scholar.uwindsor.ca/etd/7826
E-commerce Recommendation by an
Ensemble of Purchase Matrices with
Sequential Patterns
By Mehdi Naseri
A Thesis
Submitted to the Faculty of Graduate Studies through the School of Computer Science in Partial Fulllment of the Requirements for
the Degree of Master of Science at the University of Windsor
Windsor, Ontario, Canada
2019
c
Sequential Patterns
by
Mehdi Naseri
APPROVED BY:
Z. Hu
Department of Mathematics & Statistics
S. Samet
School of Computer Science
C.I. Ezeife, Advisor School of Computer Science
I hereby certify that I am the sole author of this thesis and that no part of this thesis has been published or submitted for publication.
I certify that, to the best of my knowledge, my thesis does not infringe upon anyone's copyright nor violate any proprietary rights and that any ideas, techniques, quotations, or any other material from the work of other people included in my thesis, published or otherwise, are fully acknowledged in accordance with the standard referencing practices. Furthermore, to the extent that I have included copyrighted material that surpasses the bounds of fair dealing within the meaning of the Canada Copyright Act, I certify that I have obtained a written permission from the copyright owner(s) to include such material(s) in my thesis and have included copies of such copyright clearances to my appendix.
In E-commerce recommendation systems, integrating collaborative ltering (CF) and sequential pattern mining (SPM) of purchase history data will improve the accu-racy of recommendations and mitigate limitations of using only explicit user ratings for recommendations. Existing E-commerce recommendation systems which have combined CF with some form of sequences from purchase history are those referred to as LiuRec09, ChioRec12 and HPCRec18. ChoiRec12 system, HOPE rst derives implicit ratings from purchase frequency of users in transaction data which it uses to create user item rating matrix input to CF. Then, it computes the CFPP, the CF-based predicted preference of each targetuseruon anitemi as its output from the CF
process. Similarly, it derives sequential patterns from the historical purchase database from which it obtains the second output matrix of SPAPP, sequential pattern analy-sis predicted preference of each user for each item. The nal predicted preference of each user for each item FPP is obtained by integrating these two matrices by giving 90% to SPAPP and 10% to CFPP so it can recommend items with highest ratings to users. A limitation of HOPE system is that in user item matrix of CF, it does not distinguish between purchase frequency and ratings used for CF. Also in SPM, it recommends items, regardless of whether user has purchased that item before or not. This thesis proposes an E-commerce recommendation system, SEERs (Stacking Ensemble E-commerce Recommendation system), which improves on HOPE system to make better recommendations in the following two ways: i) Learning the best mini-mum support for SPA, best k similar users for CF and the best weights for integrating the four used matrices. ii) Separating their two intermediate matrices of CFPP and SPAPP into four intermediate matrices of CF_notpurchased, SP M_purchased, SP M_notpurchased and purchasehistory matrix which are obtained and merged
with the better-learned parameters from (i) above. Experimental results show that by using best weights discovered in training phase, and also separating purchased and not purchased items in CF and sequential pattern mining methods, SEERS provides better precision, recall, F1 score, and accuracy compared to tested systems.
Special thanks to my supervisor, Dr. Christie Ezeife for her patience, support and professional guidance during my graduate study.
DECLARATION OF ORIGINALITY III
ABSTRACT IV
DEDICATION V
ACKNOWLEDGEMENTS VI
LIST OF TABLES IX
LIST OF FIGURES XIII
1 Introduction 1
1.1 E-commerce Recommendation System Input and Output . . . 1
1.2 Collaborative Filtering . . . 2
1.2.1 Sequential Pattern Mining . . . 6
1.2.2 Generalized Sequential Pattern (GSP) Algorithm . . . 7
1.3 E-commerce Recommendation Systems Evaluation . . . 10
1.3.1 Accuracy . . . 11
1.4 Existing Hybrid E-commerce Recommendation Systems of Collabora-tive Filtering and Sequential Pattern Mining . . . 12
1.4.1 Hybrid sequential rules and collaborative ltering and collabo-rative ltering (D.-R. Liu, Lai, & Lee, 2009) . . . 13
1.4.2 Hybrid Online Product rEcommendation (HOPE) System (Choi, Yoo, Kim, & Suh, 2012) . . . 14
1.4.3 Historical Purchase with with Clickstream based Recommen-dation System (HPCRec) (Xiao & Ezeife, 2018) . . . 14
1.4.4 HOPE versus SEERS . . . 17
1.5 Observation and Thesis Hypothesis . . . 20
1.6 Thesis Contributions . . . 22
1.6.1 Method Contribution . . . 22
1.6.2 Feature Contribution . . . 23
1.6.3 Thesis Outline . . . 24
2 Related Work 25 2.1 E-commerce Recommendation Systems based on Collaborative Filter-ing and Sequential Pattern MinFilter-ing . . . 28
2.1.1 Hybrid Sequential Rules and Collaborative Filtering for Prod-uct Recommendation (D.-R. Liu, Lai, & Lee, 2009) . . . 28
2.1.2 Hybrid Online Product rEcommendation (HOPE) System (Choi, Yoo, Kim, & Suh, 2012) . . . 32
System (SEERS) 42
3.1 Input . . . 42
3.2 Output . . . 43
3.2.1 Problem Denition . . . 44
3.3 Proposed Method . . . 44
3.3.1 Using Collaborative Filtering to Create User Item Matrices . . 44
3.3.2 Create User Item Matrices by Mining Sequential Rules . . . . 49
3.3.3 Phase 1: Training . . . 54
3.3.4 Phase 2: Recommend Items . . . 58
3.4 Comparison of HOPE vs SEERS Through an Example . . . 61
3.4.1 Problem Denition . . . 61
3.4.2 Solution 1: HOPE Method . . . 61
3.4.3 SEERS Method . . . 68
4 Comparative Analysis 72 4.1 Datasets . . . 72
4.2 Implementation and Tools . . . 73
4.3 Evaluation Results and Analysis . . . 73
4.3.1 Sequential Rule Mining Recommendation Evaluation . . . 73
4.3.2 Best Support and Condence . . . 78
4.3.3 Collaborative Filtering Recommendations Evaluation . . . 78
4.3.4 Best Discovered Weights for Intermediate Matrices . . . 81
4.3.5 Compare Accuracy of Recommendation Methods . . . 81
5 Conclution and Future Work 84 5.1 Future Work . . . 85
REFERENCES 87
1 User Item rating matrix . . . 3
2 Similarity between users . . . 5
3 User item matrix in with discovered unknown ratings . . . 6
4 Sample input sequential database . . . 8
5 3-sequence candidate generation . . . 9
6 Categories of product recommendation . . . 11
7 Comparative features of related works . . . 17
8 User item matrix with unknown ratings . . . 21
9 User item matrix with discovered ratings . . . 21
10 Add weights to user item matrix with discovered unknown ratings in collaborative ltering . . . 22
11 Cluster of customers based on FRM . . . 29
12 Final segmentation of customers based of RFM patterns . . . 30
13 Customers bit vector and clustering of customers . . . 30
14 Changes of customers transactions in multiple periods . . . 31
15 Integrating collaborative ltering and sequential pattern mining . . . 36
16 (a) Consequential matrix (b) user-item purchase frequency matrix . . 37
17 User-item rating with predicted rarings . . . 37
18 Normalized user-item purchased frequency . . . 38
19 Click stream similarity with session <3,5,2> . . . 39
20 Normalized user-item matrix with predicted weights . . . 40
21 Final user matrix with all of predictions . . . 41
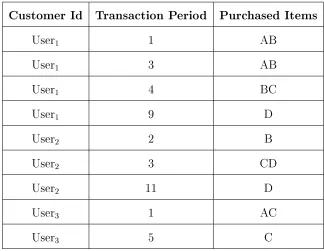
22 Purchase transactions . . . 43
23 Sample e-commerce recommendation system output . . . 44
24 Sample user item purchase frequency matrix . . . 45
27 User item matrix of collaborative ltering with k=1 . . . 48
28 User item matrix without purchased item of each customer . . . 48
29 Normalized collaborative ltering user item matrix without purchased items of each user. . . 49
30 Sample transactions (Table 22) sorted by transaction period and Cus-tomerId . . . 50
31 Sequential database of Table 22 and Table 30 . . . 50
32 Frequent sequences of input sequential dataset . . . 51
33 Frequent sequential rules of input sequential dataset . . . 52
34 User item rating in sequential pattern mining . . . 53
35 User item rating in sequential pattern mining for purchased items . . 53
36 User item rating in sequential pattern mining for not purchased items 54 37 Normalized user item rating in sequential pattern mining for purchased items . . . 54
38 Normalized user item rating in sequential pattern mining fro not pur-chased items . . . 54
39 Best support and condence of sequential rule mining with their F1 score 56 40 F1 score of collaborative ltering for not purchased item with various number of similar users . . . 57
41 Best weights for each user item matrix with their F1 score . . . 57
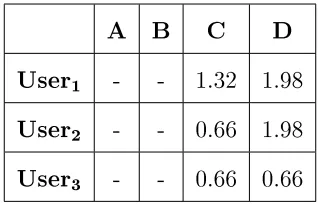
42 Normalized user item ratings in sequential pattern mining for pur-chased items . . . 59
43 Normalized user item rating in sequential pattern mining fro not pur-chased items . . . 59
44 Normalized collaborative ltering user item matrix without purchased item of each user . . . 59
45 Normalized user item purchase matrix . . . 60
frequency . . . 61
48 User item rating matrix from Table 22 . . . 63
49 Absolute preference of ratings in user item purchase frequency matrix 64 50 Absolute preference of ratings in user item purchase frequency matrix 64 51 Multiply ratings by ve in the user item purchase frequency matrix . 65 52 Similarity between users . . . 65
53 Output matrix of collaborative ltering on user item matrix of Table 48 66 54 Frequent sequences . . . 66
55 Next purchase product rating calculated by sequential pattern mining 67 56 Normalized collaborative ltering-based ratings . . . 67
57 Normalized Sequential pattern analysis-based prediction . . . 68
58 Sequential pattern analysis-based prediction . . . 68
59 Recommended items using hope method . . . 68
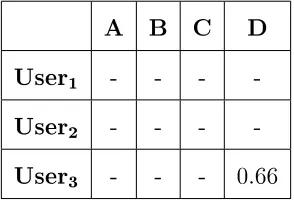
60 Normalized user item rating in sequential pattern mining for purchased items . . . 69
61 Normalized user item rating of sequential pattern mining for not pur-chased items . . . 70
62 Normalized collaborative ltering user item matrix without purchased item of each user . . . 70
63 Normalized purchase frequency user item matrix . . . 70
64 Ensemble user item matrix . . . 71
65 Top 3 items recommended to each user . . . 71
66 Precision of SPM recommendation with various support . . . 74
67 Recall of SPM recommendation with various support . . . 74
68 F1 score of SPM with various support . . . 75
and various condence . . . 76
71 F1 score of sequential rules recommendation with minimum support =4% and various condence . . . 77
72 Best minimum support and condence values of sequential rule mining for recommending 20 items . . . 78
73 Precision of collaborative ltering recommendation without purchased items by various number of similar users . . . 79
74 Recall of collaborative ltering recommendation without purchased items by various number of similar users . . . 79
75 F1 score of collaborative ltering recommendation without purchased items by various number of similar users . . . 80
76 Best weights for each user item matrix . . . 81
77 Comparing precision of recommendation systems . . . 81
78 Comparing recall of recommendation systems . . . 82
1 HOPE Framework . . . 18
2 Overview of SEERS recommendation phase . . . 19
3 Comparison of SEERS and HOPE . . . 20
4 HOPE Framework . . . 33
5 Overview of training in Stacking Ensemble E-commerce Recommenda-tion System (SEERS) . . . 55
6 Overview of recommendation in Stacking Ensemble E-commerce Rec-ommendation System (SEERS) . . . 58
7 HOPE Framework . . . 62
8 HOPE Framework with Table 22 as input . . . 63
9 SEERS Framework with Table 22 as input . . . 69
10 Precision of SPM recommendation with various support . . . 74
11 Recall of SPM recommendation with various support . . . 75
12 F1 score of SPM purchased with various support . . . 75
13 Precision of sequential rules recommendation with various condence 76 14 Recall of sequential rules recommendation with various condence . . 77
15 F1 score of sequential rules recommendation with various condence . 77 16 Precision of collaborative ltering recommendation without purchased items by various number of similar users . . . 79
17 Recall of collaborative ltering recommendation without purchased items by various number of similar users . . . 80
18 F1score of collaborative ltering recommendation without purchased items by various number of similar users . . . 80
19 Comparing precision of recommendation systems . . . 82
20 Comparing recall of recommendation systems . . . 82
CHAPTER 1
Introduction
Recommendation systems are tools and techniques, suggesting items to users such as what items to buy, what music to listen, what movie to watch, or what news to read (Ricci, Rokach, & Shapira, 2011). Many Recommendation systems have been developed in various domains such as Movies (Netix), News (Google), Image (Tum-blr), Video (YouTube), Friend (Facebook), Travel (TripAdvisor), Music (Spotify), E-commerce (Amazon). Selling or buying products or services online are termed as e-commerce. Each e-commerce platform usually has many products in its repository, and customers have to nd their favorite products one by one. To make shopping process more convenient and ecient, most e-commerce portals use recommenda-tion systems to oer appropriate products to a customer. So, they have become an important component of e-commerce platforms. Recommendation systems are also benecial for sellers too because they can sell more products by recommending needed products to more customers, and the likelihood of more purchases will be increased.
1.1 E-commerce Recommendation System Input and
Output
models (e.g. frequent purchase sequences already found in customers historical pur-chases). This information might be personalized data about a specic customer (such as their age, interests or previous transaction) or it might be non-personalized data (such as best sellers, market sales trends, shoppers advises, public statistics, market research) which are similar for all users.
There are many methods to gather these inputs. We can categorize informa-tion gathering methods in two categories: explicit informainforma-tion gathering and implicit information gathering. Explicit information gathering includes collecting rating of products by users, registration form, asking for interest and preferences. Implicit information gathering includes collecting the history of purchases, navigation history, time spent on specic pages, links followed by a user, button clicks, user data from social network platforms.
The output of a recommendation system is a list of top-N recommended items to each user. These items are ranked based on their ratings. For example recom-mendation system might recommend top 3 products {Item2, Item1, Item3} to user1
which indicates for this user, item2 has the highest rating, then item1 and item3. In
a similar way, three items will be recommended to each user.
1.2 Collaborative Filtering
Collaborative ltering is the most commonly researched recommendation system tech-nique. This method receives user item rating matrix as input and predicts unknown values in this matrix and return it as collaborative ltering output. A sample user item purchase frequency matrix is displayed in Table 1. For example this table shows
user1 has purchased item1, three times. As we can see in Table 1, many ratings are
unknown in this input matrix. For example we do not know if user1 likes item3 or
Table 1: User Item rating matrix
Item1 Item2 Item3 Item4 Item5
User1 3 1 ? 1 3
User2 ? 1 4 1 2
User3 2 2 4 2 1
User4 3 3 3 1 ?
In this research, neighborhood-based collaborative ltering is used. This method receives the user item rating matrix as input. Then nds other users who have similar ratings in this matrix, by using similarity methods such as Pearson or cosine similarity. Then predict unknown ratings by calculating weighted ratings of similar users which have a rating for that item. Therefore collaborative ltering recommendation systems can ll up more ratings in user item matrix.
Problem Denition: Receive user item rating matrix as input (e.g. Table 1), the goal is to nd unknown ratings in this matrix and return new user item rating matrix with less unknown ratings (e.g. Table 3) as output.
Input: Collaborative ltering recommendation system receives user item rating matrix as input. This matrix shows ratings of users for items. The ratings can be discovered from explicit data (e.g. user explicitly rated products) or by using implicit data (e.g. discover rating based on the historical purchase of user). For example, in e-commerce, each rating shows the frequency of purchasing an item by a user. For example sample input which is displayed in Table 1 indicates thatuser1 has purchased
item1 three times.
Output: User Item matrix with predicted ratings (e.g. Table 1) which has less or no unknown ratings compare to input user item matrix.
rating of items for that user (Equation 1). In this Equation,ruidenote rating ofuseru
for itemi. r¯i denote mean rating of useri. |Iu| denote number of items which useru
have a rating for them, for example user1 has rating for four items therefor |I1|= 4.
¯ ri =
P
i∈Iu
rui
|Iu|
(1) For example, in Table 1, user1 has rated four items which are 3,1,1,3, so
P
i∈Iu
rui=
3 + 1 + 1 + 3 and |I1|= 4 therefore mean rating of user1 is 1.75.
¯ r1 =
3 + 1 + 1 + 3
4 = 2
Therefore, users mean ratings are: r¯1 = 2 ,r¯2 = 2,r¯3 = 2.2, r¯4 = 2.5.
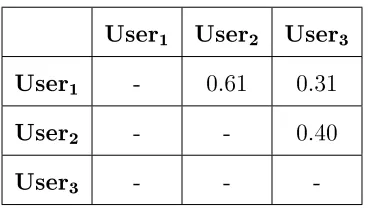
Step 2. Compute similarity between users. In this step, similarity function is used to nd similarity between the target user and all other users (Table 2). In this section, we have used Pearson similarity to estimate the similarity between two users (Equation 2). In this equation, u and v are two users who we want to nd similarity
between them. rui denote rating of itemi by useru. Iu denote item indices which
useru have a rating for them.
P earsonSimilarity(u, v) =
P
i∈Iu∩Iv
(rui−r¯u)(rvi−r¯v)
r P
i∈Iu∩Iv
(rui−r¯u)2
r P
i∈Iu∩Iv
(rvi−r¯u)2
(2)
For example in Table 1, user1 has rated item1, item2, item4, item5 so I1 is
{1,2,4,5}anduser2 rateditem2,item3,item4,item5 soI2 is{2,3,4,5}andIu∩Iv is
2,4,5. Now by using similarity equation 2 we nd similarity betweenuser1 and user2.
Similarity
(
u
1, u
2) =
√
(1−2)∗(1−2)+(1−2)∗(1−2)+(3−2)∗(2−2)(1−2)2+(1−2)2+(3−2)2
√
(1−2)2+(1−2)2+(2−2)2= 0
.
82
Table 2: Similarity between users User1 User2 User3 User4
User1 - 0.82 -0.4 0.52
User2 - - 0.89 0.13
User3 - - - 0.31
User4 - - -
-Step 3. Compute useru's pear group for itemj. Pu(j) denote pear group of
useru for itemj which is the set of users who have the highest similarity with useru
and have a rating for itemi. For example based on Table 2, Puser1(item3) are user4
and user2 because they have the most similarity withuser1 and both of them have a
rating for item3.
Step 4. Compute unknown ratings in user item matrix. To nd unknown rating ofuser1foritem1we use Equation 3. in this equation, ˆrui denote unknown
rat-ing ofuseru foritemi. ruidenote unknown rating ofuseru foritemi. Similarity(u, v)
is calculated similarity between useru and userv in step 2. Pu(j) denote pear group
ofuseru foritemj which is found in step 3 and shows most similar users touseru who
have rating for itemj.
ˆ
rui= ¯ru+
P
v∈Pu(j)
Similarity(u, v).(rvi−r¯v)
P
v∈Pu(j)
|Similarity(u, v)| (3)
For example two most similar users to user1 are user4 and user2 also both of
them have rating for item3. So Puser1(item3) are user2 and user4. Rating of user2
for item3 is 4 and rating of user4 for this item is 3. By using equation 3 we have:
ˆ
ruser1,item3 = 2 +
0.82∗(4−2) + 0.52∗(3−2.5)
0.82 + 0.52 = 2 +
1.64 + 0.26
Equation 3 and displayed in Table 3.
Table 3: User item matrix in with discovered unknown ratings Item1 Item2 Item3 Item4 Item5
User1 3 1 3.42 1 3
User2 2.72 1 4 1 2
User3 2 2 4 2 1
User4 3 3 3 1 2.18
After discovering unknown ratings in the user item matrix, we can use it to recom-mend items to users by selecting items which have the highest ratings. For example, consider user item matrix in Table 3. If we want to recommend three items to each user, then for users1, item5, item3 and item4 will be recommended because these
items have highest ratings in the user item matrix. Similarly recommended items to other users will be selected.
1.2.1 Sequential Pattern Mining
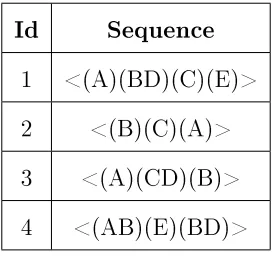
Sequential pattern mining receives input sequential database (e.g. Table 4) and min-imum support (e.g. 50 percent) as input and discovers frequent subsequences in sequential database with frequency higher than a user-specied threshold (e.g. 50 percent) (Aggarwal, Bhuiyan, & Al Hasan, 2014). Each input sequence consists of a list of itemsets (e.g. purchase transactions). For example, a sequence in input sequential database (Table 4) is <(A)(BD)(C)(E)> which consist of four itemsets and indicates user, purchase item A then items B and C together, later buy item C and nally purchase item E. Also, each itemset is a list of items (e.g. purchased
products), for example (BC) is an itemset which consists of two items which are B
and C. The output of sequential pattern mining is a list of frequent itemsets. For
future. For example, it can predict a customer who purchases a digital camera, later will buy a memory card. The problem of frequent sequential pattern mining has been widely studied because of its numerous applications to a variety of data mining problems such as mining e-commerce customers purchase pattern. As a result, many algorithms have been developed for mining frequent sequential patterns such as GSP (Srikant & Agrawal, 1996), Spade (Zaki, 2001), Spam (Ayres, Flannick, Gehrke, & Yiu, 2002), Prexspan (Pei et al., 2004), Lapin-Spam (Yang & Kitsuregawa, 2005), freespan (Han et al., 2000) and PLWAP (Ezeife, Lu, & Liu, 2005).
1.2.2 Generalized Sequential Pattern (GSP) Algorithm
Generalized Sequential Pattern (GSP) method proposed in (Srikant & Agrawal, 1996), is much faster than ArioriAll (Agrawal & Srikant, 1995). This algorithm nds sequen-tial patterns in a sequensequen-tial database as opposed to a non-sequensequen-tial transactional database in (Agrawal & Srikant, 1995). This algorithm contribution is consisting of using candidate generation, pruning, and support counting algorithms for extracting frequent sequential patterns. GSP algorithm receive input sequential database (Table 4) and minimum support (e.g. 50 percent). This method rst discovers 1-item can-didates (C1) then count support of C1 candidates and those candidates which have
a support higher than minimum support are considered 1-item frequent sequences
(L1). Then in a loop, generate candidateCkby usingLk-1 ./GSP joinLk-1 then in
candi-date pruning step remove any candicandi-dates which have a non-frequent sub-sequence and nally in counting step select candidate withsupporthigher than minimum support
as frequent sequence Lk. Continue this loop until there is not any new frequent
se-quence. This algorithm return F1∪F2∪..∪Fn as output frequent sequences. In
this section, all steps of this algorithm are described in detail with examples.
Table 4: Sample input sequential database Id Sequence
1 <(A)(BD)(C)(E)> 2 <(B)(C)(A)> 3 <(A)(CD)(B)> 4 <(AB)(E)(BD)>
Output: All sequences that have support greater or equal to minimum support
(e.g. <(A)(C)(B)>).
Algorithm: GSP algorithm receives a sequential database and discovers frequent sequential patterns by using the following steps.
Step 1. Discovering all 1-item candidates (C1). In this step, read all sequences
to determine all items (C1). For example, items in the previous example (1-itemset
candidates) are C1 = (A), (B), (C), (D), (E).
Step 2. Find 1-item frequent sequences (L1). Counting support of candidates
and return frequent candidates. We pass through input sequences to count the num-ber of sequences that include that item. In previous example, support of items are <(A),4>, <(B),4>, <(C),3> ,<(D),3>, <(E),2>. Then select candidates which have a support value higher than user-specied minimum support as frequent 1-sequences. For example, If minimum support is 50% then each item must be in at least two input sequences. In this example, support of all items is more than two. As a result, 1-item frequent sequential patterns are L1 = <(A),4>, <(B),4>, <(C),3> ,<(D),3>, <(E),2>
Step 3. Generate 2-element candidates (C2). First, like Apriori algorithm, create
example (AB) indicates that user purchase item A and B together.
Step 4. Find frequent L2. Counting support of 2-element candidates and return
frequent candidates. In this step rst count number of sequences which contain can-didates from the previous step. Then save the cancan-didates that have a support higher than minimum support. In this example there are 7 candidates which have a support higher than minimum support which are: <(A)(B),3>, <(A)(C),2>, <(A)(D),3>, <(A)(E),2>, <(B)(C),2>, <(BD),2>, <(B)(E),2>.
Repeat step 5 to 7 until there is not any new frequent itemset. In each loop we use previous Lk-1 sequences to create new candidates (Ck) by using GSP join. Then
after pruning and support counting, we nd the next frequent sequences (Lk+1).
Step 5. Candidate Generation. Use (Lk-1 ./GSP join Lk-1) to generate candidates.
For generating k-sequence candidates in GSP join, we receive two Lk-1 sequences.
Then remove the rst and last item in the sequences. Then, we select sequences that their sequence-1 is equal to sequence-Last. Then we add the last item of the second sequence to the end of the rst sequence. If the last item is part of the last element of the second sequence, then we add it to the last itemset of the rst sequence. If it is a separate element in sequence2, then we add it to the rst sequence as a
separate element (Table 5). For example, if we merge <(A)(B)> and <(B)(C)> the candidate is <(A)(B)(C)> but if we combine <(A)(B)> and <(BD)> the candidate is <(A)(BD)>.
Table 5: 3-sequence candidate generation
Sequence 1 Sequence1-1st Sequence 2 Sequence2-Last New Candidates
(A)(B) B (B)(C) B (A)(B)(C)
(A)(B) B (B)(E) B (A)(B)(E)
(A)(B) B (BD) B (A)(BD)
(A)(D) D (BD) D (A)(BD)
(BD) B (B)(C) B (BD)(C)
Step 6. Candidate Pruning. Before reading all sequenced to nd the support of each candidate, it is better to prune candidates. We know if a candidate is frequent, then all of its sub-sequences must be frequent too. For example, if <(A)(B)(C)> is frequent then <(A)(B)>, <(A)(C)> and <(B)(C)> are frequent too. Therefore we remove any candidate which has a non-frequent subsequence.
Step 7. Return frequent itemsets (Lk) by counting support of candidates. First,
we read all sequences and counting support of each pruned candidate. For example in previous step we had three pruned candidates and their support are <(A)(B)(C),1>, <(A)(B)(E),1> , <(A)(BD),2>. We keep candidates that their support is higher than minimum support, as new frequent sequences. In the previous example, there is only one candidate with support greater than minimum support <A(BD)>.
Step 8. Repeat step 5 to step 7 until there is not any new frequent sequence. In each step, we found new frequent sequences and return F1∪F2∪..∪Fn as nal
frequent sequences. For example, in the previous sequential dataset, some frequent itemsets and their support are <(A),100%>, <(B)(C),50%> , <(A)(BD),50%>
1.3 E-commerce Recommendation Systems
Evalua-tion
1.3.1 Accuracy
Accuracy is the most important factor for evaluation of e-commerce recommendation systems. Three metrics are widely used for evaluating recommendation accuracy, which are Precision, Recall, and F1 Score. E-commerce recommendation system suggests some products to each user. Some of these products might be actually good, and user buys them. Also, the user might not like some of the recommended products. In general, we can categorize all products into four groups. True Positive (TP) represent purchased products that were also recommended correctly. False Positive (FP) represent products not purchased but which were recommended falsely. False Negative (FN) represent products purchased but which were not recommended falsely. True Negative (TN) represent products not purchased and not recommended correctly.
Table 6: Categories of product recommendation Purchase Reality
Purchased Not Purchased
Recommendation Recommended True Positive (TP) False Positive (FP) Not Recommended False Negative (FN) True Negative (TN)
Precision is calculating by dividing the number of items correctly recommended by the number of all recommendations (Equation 5). Precision shows the percentage of items that are recommended correctly to users. In other words, it is the percentage of recommended items that have been purchased by users.
P recision= T P
T P +F P (5)
For example, if we recommend 10 items to a user and he buys 3 of them, then precision is 0.3 because 3
10 = 0.3.
of items that are recommended and users have purchased them to the number of all items purchased by users.
Recall= T P
T P +F N (6)
For example, if a user buys 10 items and we recommend 4 of them to the user correctly, then recall is 0.4 because 4
10 = 0.4.
F1 score is the weighted average of the precision and recall, where the best score is 1, and the worst score is 0 (Equation 7). F1-score combines both precision and recall so it can be used as an overall utility of the recommendation system.
F1score= 2∗ P recision.Recal
P recision+Recal (7)
For example if precision was 0.3 and recall was 0.4, then F1score is 0.34 because 2∗ 0.3∗0.4
0.3+0.4 = 0.34.
1.4 Existing Hybrid E-commerce Recommendation
Systems of Collaborative Filtering and
Sequen-tial Pattern Mining
ltering and sequential pattern mining and recommend items with the highest rat-ings to the users. Collaborative ltering recommendation system uses the matrix of user-item for predicting next item. But usually, this matrix is very sparse because for many user-items we do not have any purchase information. Historical purchase with clickstream recommendation system (HPCRec) method (Xiao & Ezeife, 2018) uses consequential bond information to compare clickstream and purchase sequences of users for purposes of predicting items for recommendation. Historical Sequential Pattern Recommendation System (HSPRec) (Bhatta, Ezeife, & Butt, 2019) extract sequential patterns of customers' clickstreams and purchases and uses them to en-rich user item matrix. Then, it uses this enen-riched matrix in collaborative ltering to discover unknown ratings and recommend items. In this section, we shortly explain these methods, and their limitations compared to our proposed method, and in the next chapter, we describe them thoroughly with examples.
1.4.1 Hybrid sequential rules and collaborative ltering and
collaborative ltering (D.-R. Liu, Lai, & Lee, 2009)
In this method, rst customers are segmented to 8 groups based on their recency, frequency and monetary. Then combine clusters which have the same recency, fre-quency and monetary patterns. To nd segment-based sequential rules, rst cluster transactions in separate groups based on purchased products. Then nds trans-action cluster changes over period of times and select items in predicted transac-tion cluster as sequential rule recommendatransac-tions. On the other hand, it uses KNN collaborative ltering to discover unknown ratings in user item matrix and recom-mend products in current period. Next, normalize results of these two methods and give a weight to each one. Finally, combine the results with P roductRating = (1−α)∗SequentialRule+α∗CollaborativeF iltering formula and recommend the
1.4.2 Hybrid Online Product rEcommendation (HOPE)
Sys-tem (Choi, Yoo, Kim, & Suh, 2012)
When the explicit rating is not available, collaborative ltering recommendations can not predict users' preferences properly. Authors in this paper improve the perfor-mance of the recommendation system in two ways. First, by using implicit rating because there would be more data about products and users as a result user product matrix of collaborative ltering is less sparse. When a user buys a product, it is con-sidered that he like that product, and when a user buys that product more frequently, it implies that he likes that item more. This way, implicit ratings in e-commerce data can be extracted even when users are not rating products explicitly. This research extract implicit rating from purchase frequency of users. For example, if user1 buys
item1 three times, then the rating value in user item matrix will be three.
HOPE rst derives implicit ratings from purchase frequency of users in transaction data which it uses to create user item rating matrix input to CF. Then, it computes the CFPP, the CF-based predicted preference of each target useru on an itemi as its
output from the CF process. Similarly, it derives sequential patterns from the his-torical purchase database from which it obtains the second output matrix of SPAPP, sequential pattern analysis predicted preference of each user for each item. The nal predicted preference of each user for each item FPP is obtained by integrating these two matrices by giving 90% to SPAPP and 10% to CFPP so it can recommend items with highest ratings to users. A limitation of HOPE system is that in user item matrix of CF, it does not distinguish between purchase frequency and ratings used for CF. Also in SPM, it recommends items, regardless of whether user has purchased that item before or not.
1.4.3 Historical Purchase with with Clickstream based
Rec-ommendation System (HPCRec) (Xiao & Ezeife, 2018)
sparsity problem). This way, in a situation that there is not enough information about a user, we can predict his preference (solving cold start problem). HPCRec algorithm rst creates the user item matrix. In this matrix, each rating is the frequency of itemi,
purchased by the useru, which are normalized. Next, for each user which we do not
have purchase data, nd similarity of click stream data with all other users by using click-stream sequence similarity measurement (CSSM). Then use the transaction-based weighted frequent item (TWFI) to nd the items that he would purchase with their average weight support. If a user has not purchased this item, add this rating to the user item matrix. Finally, use collaborative ltering method to ll up unknown ratings in the user item matrix and recommend items which have the highest ratings. In Table 7, we have summarized the best current systems which are using collab-orative ltering with some sort of sequential pattern mining to recommend items to users in e-commerce dataset.
Year Paper Title Input
Data
Major Contribution Limitation
LiuRec09 (D.-R. Liu, Lai, & Lee, 2009)
A hybrid of sequen-tial rules and col-laborative ltering for product recom-mendation
Historical purchase
This method combines segment-based sequential rule mining with segment-based KNN collaborative ltering to create a hybrid recommendation system
HOPE (Choi, Yoo, Kim, & Suh, 2012)
A hybrid online-product recom-mendation system: Combining implicit rating-based col-laborative ltering and sequential pattern analysis Historical purchase
This research proposed a method for extracting im-plicit rating from purchase data. Also combined col-laborative ltering with sequential pattern analy-sis method
In collaborative ltering, ratings based on purchase frequency and ratings cal-culated based on simi-lar users have the same weight. In sequential pattern mining, recom-mends item regardless of if that item has already pur-chased by that user or not.
HPCRec18 (Xiao & Ezeife, 2018) E-Commerce product recom-mendation using historical purchases and clickstream data Historical purchase, Click-stream data
Improves quality and quantity of rating by nd-ing relationship between click stream data and historical purchase and lling up more elds in user-item matrix
In sequential pattern min-ing only add items to user-item matrix which user has not purchased them. Needs clickstream data. In collaborative ltering, ratings based on purchase frequency and rating cal-culated based on simi-lar users have the same weight. HSPCRec18 (Bhatta, Ezeife, & Butt, 2019) Mining sequential patterns of his-torical purchases for e-commerce recommendation Historical purchase, Click-stream data
Enrich user item matrix with sequential patterns of customer clicks and pur-chases to capture better customer behavior
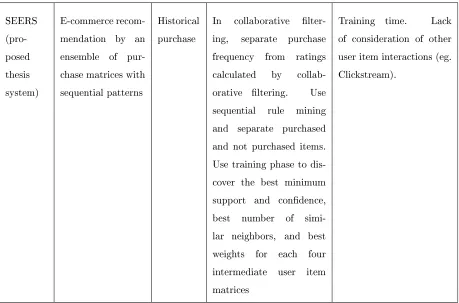
SEERS (pro-posed thesis system) E-commerce recom-mendation by an ensemble of pur-chase matrices with sequential patterns
Historical purchase
In collaborative lter-ing, separate purchase frequency from ratings calculated by collab-orative ltering. Use sequential rule mining and separate purchased and not purchased items. Use training phase to dis-cover the best minimum support and condence, best number of simi-lar neighbors, and best weights for each four intermediate user item matrices
Training time. Lack of consideration of other user item interactions (eg. Clickstream).
Table 7: Comparative features of related works
1.4.4 HOPE versus SEERS
Fig. 1: HOPE Framework
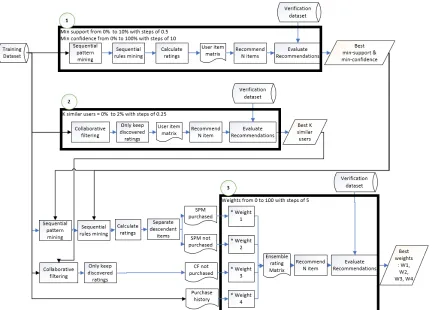
SEERS method consist of two phases: training and recommendation. We also split input purchase history dataset to 3 parts: training dataset, verication dataset, and test dataset. In the training phase, SEERS receives training dataset and nds the best minimum support and minimum condence for sequential rule mining. Then it nds the best number of similar user for collaborative ltering. Next, it uses dis-covered best minimum support and condence in sequential rule mining to create
SP M purchased and SP M notpurchased user item matrices. Also, use best k
sim-ilar users in collaborative ltering to create CF notpurchased. SEERS also create SP M notpurchased from the purchase frequency of users. In the last step of the
training phase, it nds the best weight for each one of these four user item matrices. To discover the best weights, it ensembles four intermediate user item matrices by giving various weight (from 0 to 100 with steps of 5) to each method. Then we eval-uate the F1 score of recommendation over verication dataset. Set of four weights which give us the best F1 score will be selected as the best weight.
highest ratings to each user. Overview of SEERS method is displayed in gure 2.
Fig. 2: Overview of SEERS recommendation phase
Fig. 3: Comparison of SEERS and HOPE
1.5 Observation and Thesis Hypothesis
Table 8 shows a user item matrix. As it is explained in section 1.2 we can use collabo-rative ltering to nd unknown ratings (Table 9). For example, in this matrix, rating of user1 for item3 is unknown, but by using collaborative ltering have discovered
Table 8: User item matrix with unknown ratings
Item1 Item2 Item3 Item4 Item5
User1 3 1 ? 1 3
User2 ? 1 4 1 2
User3 2 2 4 2 1
User4 3 3 3 1 ?
Table 9: User item matrix with discovered ratings
Item1 Item2 Item3 Item4 Item5
User1 3 1 (3.42) 1 3
User2 (2.72) 1 4 1 2
User3 2 2 4 2 1
User4 3 3 3 1 (2.18)
We can use this user item matrix to recommend items to the users by selecting items which have the highest ratings. For example if we want to recommend one item to each user, then item3 will be recommended to user1. As you can see in Table
9, for user1, item3 has the highest rating therefore it will be selected as the best
recommendation. This user has already purchased all other items, but collaborative ltering is recommending the only item which the user has never purchased before. In e-commerce, users mostly prefer to buy products they have already paid money for them and purchased before compared to products they have never purchased. Current researches including (D.-R. Liu, Lai, & Lee, 2009), (Choi, Yoo, Kim, & Suh, 2012) and (Xiao & Ezeife, 2018) are ignoring this problem and treat all the ratings in user item matrix similarly, regardless of if they are calculated by collaborative ltering or they are actual purchase frequency of the user.
Thesis hypothesis: Improve rating quality. In this research, we give less weight to ratings in user item matrix which user has never purchased before and give higher weight to the rating of items which the user has purchased before. This way, we recommend more items which are purchased before compare to not purchased items. For example, if we give weight of 0.8 to purchased items and 0.2 to not purchased items and only use collaborative ltering method, then we have the user item matrix in Table 10. Based on this matrix if we want to recommend two items touser1, then
item1 and item5 will be selected. In this example, user1 has already purchased both
Table 10: Add weights to user item matrix with discovered unknown ratings in collaborative ltering
Item1 Item2 Item3 Item4 Item5
User1 2.4 0.8 (0.68) 0.8 2.4
User2 (0.54) 0.8 3.24 0.8 1.62
User3 1.6 1.6 3.2 1.6 0.8
User4 2.4 2.4 2.4 0.8 (0.44)
On the other hand, we use sequential rule mining to create user item matrix and recommend items. Sequential rules are in the format of A→B, which indicates if a
user has purchased item A then later will buy item B. In some rules, the user has
purchased the consequent item, and in other rules, the user has not purchased the consequent item. Similar to the problem of user item matrix of collaborative ltering, which explained before, these items have dierent values for the user, and we should not treat them equally. In this research, we separate these items and give them proper weights which we nd it in the training phase.
1.6 Thesis Contributions
In this research, we introduce a novel Stacking Ensemble E-commerce Recommenda-tion System (SEERS), which is receiving historical purchases as input and integrate collaborative ltering and sequential rule mining to predict next purchase of users.
1.6.1 Method Contribution
1. Separate the two integrated matrices of CFPP and SPAPP in HOPE to four matrices. Current researches (including HOPE) create the user item matrix based on purchase frequency of users. Then they use collaborative lter-ing to nd unknown ratlter-ings in this user item matrix. In these methods, ratlter-ings based on purchase frequency and rating calculated by collaborative ltering have the same weight. But when we create user item matrix from purchase history, rating extracted from purchase frequency of users are much more im-portant. By separating them and giving more weight to items that the user has purchased before, we recommend more purchased items to the user.
Dividing sequential rules based on if the user has already bought the consequent item or not. A sequential rule (A→B) indicates that if user purchase item A,
later would buy item B. But in discovered sequential rules, sometimes a user
has already bought the consequent item. By separating these items from other consequent items that the user has not purchased yet, and discovering the best weight for each group, we improve the accuracy of the recommendation system. 2. Finding best parameters. We use stacking ensemble learning method (Wolpert,
1992) for nding the best weights for each intermediate user item matrix. HOPE gives static weights to each recommendation method (90% to sequential pattern mining and 10% to collaborative ltering) (Choi, Yoo, Kim, & Suh, 2012), but these weights might be dierent on various datasets. We discover the best four weights for intermediate user item matrices in each dataset. Also we nd the best support and condence for sequential rules, best number of similar users in collaborative ltering before sing these methods.
1.6.2 Feature Contribution
1. Improved recommendation accuracy. In the Training phase, SEERS, rst, trains sequential rule mining to nd best minimum support and condence which leads to the highest accuracy (best F1 score). Then it trains collaborative ltering to nd the best number of similar users, which generate the highest F1 score. Also, it trains four intermediate user item matrices to discover four weights to reach the highest accuracy as a hybrid method. Therefore it has better accuracy compared to each method individually.
In the recommendation phase, when SEERS uses collaborative ltering, it sep-arates purchase frequency from ratings calculated by collaborative ltering be-cause these two ratings have dierent importance for users. Also in sequential rule mining, it distinguishes between items which user has purchased consequent items with items which user has never purchased consequent items before. By giving the best weights (which are discovered in the training phase) to each intermediate matrix, SEERS recommends items with higher accuracy.
1.6.3 Thesis Outline
CHAPTER 2
Related Work
Because of increasing e-commerce businesses, the importance of e-commerce recom-mendation systems is rapidly growing too. E-commerce recomrecom-mendation systems allow users to nd what they want very fast and also enable sellers to recommend products to users that are more likely to buy. In this research, sequential pattern mining and collaborative ltering methods are used to recommend best products in e-commerce domain. In hybrid e-commerce recommendation system, we combine two previous methods to improve e-commerce recommendations accuracy. This way, we can use the benets of these methods and also solve or mitigate the disadvantages of each method as much as possible. Therefore, hybrid recommendation systems accuracy is higher than each one of the previous methods separately.
in sequential patterns. Hybrid recommendation systems have been developed to over-come, or at least to mitigate, the limitations of content-based ltering, collaborative ltering, and rule-based recommendation systems. Changes in customers behavior are studied in (Cho, Cho, & Kim, 2005) and they use sequential rule recommen-dation to improve performance of collaborative ltering method, but collaborative ltering methods including the mentioned research do not consider changes in cus-tomers preference or frequent sequences in cuscus-tomers purchase patterns. Authors in (D.-R. Liu, Lai, & Lee, 2009) proposed a hybrid recommendation system which com-bines segment-based sequential rule mining with segment-based KNN collaborative ltering. First, customers are clustered in segments based on their recency, frequency, and monetary. Then, transactions are clustered, and by using sequential rule mining method, transaction cluster changes over periods are found. Also, collaborative lter-ing method is used to nd similar customers to recommend products in the current period. Finally, linear algebra is used to combine the results of these two methods and return items with the highest rating. Another hybrid recommendation system of collaborative ltering and sequential pattern mining was proposed by (Choi, Yoo, Kim, & Suh, 2012). Authors in this paper improve performance of recommendation systems in two ways. First, quality of recommendation system is improved by adding implicit rating to explicit rating because there would be more data about products and users as a result user-product matrix of collaborative ltering is less sparse. On the other hand, authors combined collaborative ltering with sequential pattern analysis. To create a hybrid recommendation system, authors rst run collaborative ltering method and sequential pattern analysis method separately. Then they normalize each one of them because they are in dierent ranges. Finally, integrate them by giving 90 percent weight to sequential pattern mining and 10 percent to collaborative ltering results and recommend items which have the highest rating for the user.
2.1 E-commerce Recommendation Systems based on
Collaborative Filtering and Sequential Pattern
Mining
A hybrid of collaborative ltering and sequential patterns for product recommenda-tion is proposed in (D.-R. Liu, Lai, & Lee, 2009), but this system can only extract purchase cluster changes in sequential pattern mining. In another research, a hybrid online-product recommendation system by combining implicit rating-based collabo-rative ltering and sequential pattern analysis proposed in (Choi, Yoo, Kim, & Suh, 2012). In (Choi, Yoo, Kim, & Suh, 2012), authors extract implicit ratings from pur-chase history, which can be used in collaborative ltering even when the explicit rating is not available. When a user buys a product, it is considered that he like that item and when a user buys that item more frequently, it implies that he likes that item more. This way, implicit ratings in e-commerce data can be extracted even when users are not rating products explicitly. Also, the authors claim they have improved recommendation quality by integrating collaborative ltering and sequential pattern analysis. To create a hybrid recommendation system, authors rst run collaborative ltering method and sequential pattern analysis method separately. Then they nor-malize each one of them to become in the same range. Finally, they give weight to each one of these two recommendation methods (10% for collaborative ltering and 90% for sequential pattern analysis) to integrate the result and recommend items. In this section me explain these methods with example.
2.1.1 Hybrid Sequential Rules and Collaborative Filtering for
Product Recommendation (D.-R. Liu, Lai, & Lee, 2009)
Output: Recommended products to each user.
Algorithm: The proposed method in this paper uses a combination of collabo-rative ltering and sequential rule mining. This method is explained in the following ve steps:
Step 1: Customer clustering. Customers who had similar historical purchase patterns, usually have similar RFM (Recency, Frequency, Monetary) values. In this step, customers are segmented to dierent groups based on their RFM, so later col-laborative ltering method only works on similar customers. To accomplish this task, rst, RFM value for each customer is calculated. Then all the values are normalized. K-mean clustering method is used to segment all customers based on their normalized RFM. User's RFM is consists of values which are recency, frequency, and monetary. Then for each one of these three values, if it is higher than average, then "up" is assigned to its pattern and if it is less than average then "down" is assigned to its pattern. There are two possible results for each value; therefore, there are eight pos-sible groups based on three parameters. Each customer is assigned to one of these groups. An example of clustering customers based on RFM is demonstrated in Table 11.
Table 11: Cluster of customers based on FRM
Customers Recency Frequency Monetary Recency Pattern
Frequency Pattern
Monetary Pattern
Cluster 1 104 72 19 40797 Up Up Up
Cluster 2 43 119 3 7342 Up Down Down
Cluster 3 17 64 67 147315 Down Up Up
Cluster 4 214 56 19 40279 Down Up Up
Cluster 5 78 57 37 74045 Down Up Up
Cluster 6 367 58 9 18677 Down Down Down
Cluster 7 126 92 7 14853 Up Down Down
Cluster 8 24 73 8 16106 Up Down Down
the same RFM patterns, because in all of them, recency is lower than average, and frequency and monetary are higher than average. So, they can be combined to form a new segmentation. In Table 12, customer segmentation in four groups is shown.
Table 12: Final segmentation of customers based of RFM patterns
Segments Customers Recency Pattern
Frequency Pattern
Monetary
Pattern Recency Frequency Monetary
Loyal 309 Down Up Up 57 26 54691
Potential 104 Up Up Up 72 19 40797
Uncertain 367 Down Down Down 58 9 18677
Valueless 409 Up Down Down 84 7 14801
Step 2: Segmentation-based sequential rule mining. Cluster transactions to dif-ferent groups. This clustering is based on similar product purchased. First, for each customer make a bit vector. For example, if user1 buys product1 and product3 but
did not buy product2 and product4 then it's bit vector is (1,0,1,0). A sample bit
vector for all customers is shown in Table 13. In this Table, products are displayed as Pro1 to Pro8. Then customers' transactions have clustered in groups by using the clustering method.
Table 13: Customers bit vector and clustering of customers
Customer Date Pro1 Pro2 Pro3 Pro4 Pro5 Pro6 Pro7 Pro8 Cluster
C1 20040416 1 0 0 0 0 0 0 0 C
C2 20031127 0 0 1 0 0 0 0 0 A
C2 20031127 0 1 0 0 0 0 1 1 B
C2 20040202 0 0 0 1 1 1 0 0 E
C3 20030820 0 1 0 0 0 1 0 1 B
The same method is used in every period to nd customer's cluster in that period. For example, a customer might be in clusterAin the rst period but in another cluster
(e.g. clusterB) in the next period. Also, a customer might be in multiple transaction
sample change of customers transactions in three periods are displayed in Table 14. Table 14: Changes of customers transactions in multiple periods
Period 1 Period 2 Period 3
Customer 1 C
Customer 2 AB E
Customer 3 B D
Customer 4 A E
Customer 5 F
Now sequential rule mining method is used to predict the next pattern in the next period. For example, in Table 14 we can discover (Ap2 → Ep3) rule with support
of 40 percent and condence of 100 percent. It means when a customer transaction pattern in period 2 is A, then his transaction pattern might be E in period 3 with
support of0.4and condence of1. In the same way, if a customer transaction pattern
in period 2 is B, then his transaction pattern might be E in period 3 with support
of 0.2and condence of 1. Finally, similarity method is used to nd sequential rules
that are more similar to users' transactions. For example, if transaction behavior of a user is in cluster A in the rst period, and it is in cluster B in the second period,
then we nd similarity of (A⇒B) with all sequential rules that belong to that user
segment. Then two rules with the highest similarity will be returned to recommend products. For example, when these two rules are (A ⇒ E) and (B ⇒ D) then we
predict user's next purchase will be in transaction cluster of D or E. Finally, we
count the frequency of each item in predicted transaction cluster (e.g. transaction cluster E) and return top N items with the highest frequency count.
and then recommend products that have the highest purchase frequency.
Step 4: Linear combination of sequential rule mining and KNN collaborative l-tering. For each product, we have a sequential rule rating and a collaborative ltering rating. Now we combine them linearly. Give weight of α to collaborative ltering
method and (1- α) to sequential rule method. This value denes the importance of
each method. Then nal value can be calculated by giving weight to each method in Equation 1.
P roductRating= (1−α)∗SequentialRule+α∗CollaborativeF iltering (1)
Step 5: Recommend top N products. In the previous step, ratings for each product are already calculated. Now we select top N products which have the highest ratings and recommend them to the customer.
LiuRec09 method limitations: This method does not recommend previously purchased items by that user although there is a high chance, he bought that item again. Also, this method only nds transaction cluster changes, which is usually dierent from items discovered using sequential rule mining. When this method uses collaborative ltering, ratings based on purchase frequency, and ratings calculated based on similar users have the same weight.
2.1.2 Hybrid Online Product rEcommendation (HOPE)
Sys-tem (Choi, Yoo, Kim, & Suh, 2012)
Fig. 4: HOPE Framework
Input: Historical purchase data in e-commerce dataset. Output: Recommended products to each user.
Algorithm: This algorithm is explained in the following ve steps..
Step 1: Calculate collaborative ltering predictions. First, extract ratings of users item matrix from the purchased frequency in historical purchase data. Sometimes there are not enough explicit data, or it is dicult to receive explicit ratings from users. This method uses historical purchase data of customers to extract implicit ratings. Then we use collaborative ltering in the next ve steps to discover rating for each user item.
Step 1.1: Calculate absolute preference. To nd the implicit rating for user item, count number of transactions that the user has purchased that item. Then divide that to the number of user's transactions and add one to the nal result. So, for useru
and producti following formula can be used for calculating absolute preference.
AP(u, i) = Number of tranactionsuseru has purchased itemi
Total number of useru transactions
+ 1 (2)
For example, if a user purchases a product 4 times in his 10 transactions, then absolute preference is 1.4 because by using Equation 2 we have: AP(u, i) = 104 + 1 = 1.4
pur-transactions out of total ten pur-transactions, then we might think that this user does not like that product enough. Since the frequency of each item is dierent for users, it is better to normalize the values by using relative preference. For useru anditemi,
relative preference is calculated in Equation 3. In this equation, U denote users
who purchase itemi. AP(u,i) denote absolute preference of useru for itemi which is
calculated in previous step.
RP(u, i) = AP(u, i) max
cU AP(c, i)
(3)
For example, in the previous step, user1 has purchased item1 4 time out of 10
transactions. If no other user buys that product in more than 40 percent of his transactions, then the relative preference of user1 and item1 is equal to one because
RP(user1, item1) = 11..44 = 1. Similarly, if a user buys that item in 10 percent of his
transactions, then its relative preference is 0.785 because RP(user2, item1) = 11..14 =
0.785.
Step 1.3: Multiply rating by ve. In explicit ratings, users usually give a rate between 1 to 5 to products. To produce similar values, the relative value from the previous step is multiplied by 5, and then it is round up. For example, in previous step RP(user1, item1) = 1 and RP(user1, item1) = 0.0.785 so if we multiply them
by 5 then we haveImplicitRating(user1, item1) =Roundup(5∗RP(user1, item1)) =
Roundup(5∗1) = 5andImplicitRating(user2, item1) = Roundup(5∗RP(user2, item1)) =
Roundup(5∗0.785) = 4.
Step 1.4:. Find k nearest neighbors of each user by using Pearson similarity method (Equation 4). In this equation, u and v are two users that we want to nd
their similarity. R¯u and R¯v are average ratings of user u and v.
P earsonSimilarity(u, v) =
n
P
i=1
(Rui−R¯u)(Rvi−R¯v)
r n P
i=1
(Rui−R¯u)2
r n P
i=1
(Rvi−R¯v)2
(4)
neighbors. Use Equation 5 to calculate unknown ratings for each user item. New rating for each user item, is only based on K most similar users that found in this step.
CF(a, i) = ¯Ra+ n
P
b=1
Sim(a, b)∗(Rbi−R¯b) n
P
b=1
|Sim(a, b)|
(5)
Step 2: Calculate sequential pattern analysis-based predictions. Performs the following three sub-steps to nd the rating of each user item by using sequential pattern mining.
Step 2.1. Find sequential pattern from all users' transaction sequences except target user.
Step 2.2. Find all subsequences of the user transactions. For example, when user purchase sequence is <item1, item2, item3> then its subsequences are <item1>, <item2>, <item3>, <item1, item2>, <item1, item3>, <item2, item3>, <item1, item2, item3>.
Step 2.3. Compare subsequences from step 2.2 with discovered frequent sequen-tial patterns of all users in step 2.1. If it is matched with starting part of a frequent sequence, then next item in the frequent sequence is a candidate for recommendation. Finally, calculate support value of the recommended product which is total support of the item in all subsequences of user's transactions (Equation 6) and return those who have a support value, higher than predened minimum support.
SP AP rediction(a, i) = X
sSU B
Supportis (6)
Step 3: Normalize results of collaborative ltering and sequential pattern anal-ysis. Range of ratings in sequential pattern mining and collaborative ltering are dierent. For example, extracted implicit rating in collaborative ltering is between one to ve, so before combining two methods, it should be normalized to the same range.
predic-and collaborative ltering method. To combine these two values, give a weight (α) to
sequential pattern analysis value and (1−α) weight to collaborative ltering rating.
(α) has a range between zero and one. Integration of two methods' prediction is
displayed in Table 15.
Table 15: Integrating collaborative ltering and sequential pattern mining
Item Collaborative Filtering
Sequential Pattern
Normalized Collaborative
Filtering
Normalized Sequential
Pattern
Fianl Rating
Item1 4.7 0 0 0 0.5
Item2 3.5 0 0.5463 0 0.273
Item3 3.2 1.25 0.4504 0.833 0.641
Item4 2 1.5 1 1 0.5
Item5 3 0.5 0.3333 0.33 0.348
Step 5: Recommend items. For each user, the HOPE system, recommends those items which have the highest rating in the previous step. For example, in Table 15, if we want to recommend two items, then item3 and item4 will be recommended
because they have the highest values.
ChoiRec12 method limitations: In collaborative ltering, ratings based on purchase frequency and rating calculated based on similar users have the same weight. When this method uses sequential pattern mining, it recommends item regardless of if that item has already purchased by that user or not.
2.1.3 Historical Purchase with Clickstream based
Recommen-dation System (HPCRec) (Xiao & Ezeife, 2018)
(solving sparsity problem).
Input: Consequential matrix (Table 16a) which shows items that user clicked on them plus product that he had bought. Also, user item frequency matrix (Table 16b) which shows the frequency of buying each item by each user. This matrix is created based on purchase frequencies in table 16a.
Table 16: (a) Consequential matrix (b) user-item purchase frequency matrix
SessionId UserId Clicks Purchase
1 1 1,2 2
2 1 3,5,2,3 2,3
3 2 2,1,4 1,2,4
4 2 4,4,1,2 2,4,4,
5 3 1,2,1 1
6 3 3,5,2
Item 1 Item 2 Item 3 Item 4
User 1 ? 2 1 ?
User 2 1 2 ? 3
User 3 1 ? ? ?
Output: User item rating matrix with predicted ratings (Table 17). Table 17: User-item rating with predicted rarings
Item 1 Item 2 Item 3 Item 4 User 1 0.63 0.89 0.45 0.49 User 2 0.27 0.53 0.35 0.8 User 3 1 0.74 0.27 0.33
Algorithm:
Step 1. Normalizing user item purchase frequency matrix. In Table 16b we have a user item matrix which shows frequency of buying each item by a user. In this step, we use unit vector formula to normalize all ratings in Tables 16b to values between 0 and 1. Equation 7 shows the normalization formula. In this equation, xui shows
frequency of buying itemi by the useru and x0ui is the normalized rating. For each
x0ui = p xui x2
u1+x2u2+x2u3+...+x2un
(7) For example, in Table 16,user1purchased items are(2,3)and purchase frequencies
are (2,1). Therefore, normalized rating for item2 is calculating by Equation 7:
x0u1i2 = √ 2 22+ 12 =
2 √
5 = 2
2.2360 = 0.89 (8)
Table 18: Normalized user-item purchased frequency Item 1 Item 2 Item 3 Item 4 User 1 ? 0.89 0.45 ? User 2 0.27 0.53 ? 0.8
User 3 1 ? ? ?
Step 2: For each session in the consequential matrix (Table 16a) which does not have a purchase value, we use clickstream sequence similarity measurement (CSSM) to nd similar sessions with purchase value. For example, in Table 16a, session six does not have purchase value, so we compare its clickstream with sessions 1,2,3,4,5. CSSM method receives two clickstreams to nd similarity between them in three steps.
Step 2.1: For two sequence, we nd the longest common subsequence rate (LCSR). This value is calculated by diving the longest common subsequence(LCS) divided by the maximum length of two sequences (Equation 9). For example, longest common subsequence between (3,5,2) and (3,5,2,3) is 3. Length of the rst sequence is 3, and the second one is 4, so the maximum length is 4. Now we use the equation 9 to nd longest common subsequence rate (LCSR) of two sequences.
LCSR(x, y) = LCS(x, y)
max(x, y) (9)
LCSR(<3,5,2>, < 3,5,2,3>) = LCS(<3,5,2>, <3,5,2,3>)
max(3,4) =
3
Step 2.2: First, create an itemset which contains all distinct items in both se-quences (in the previous example <2,3,5>). Then create a vector from the frequency of items in itemset. In previous example, vector for rst sequence<3,5,2> is <1,1,1> and for second sequence <3,5,2,3> is <1,2,1>. Now we nd cosine similarity between these two vectors to nd frequency similarity. In this example, frequency similarity (FS) is 0.94.
Step 2.3: Use Similarity =α∗LCSR+β∗F S equation to nd nal similarity
between to sequences. Values of α and β are used for giving weight to each one of
similarity and longest common subsequence. These two weights must have a value between 0 and 1. Also, their sum must be 1. For example, if we set each one of them 0.5 then for previous example, we have0.5∗0.75 + 0.5 + 0.94 = 0.845. Similarly if we
compare (3,5,2) with rst sequence then we have CSSM((3, 5, 2),(1, 2)) = 0.37. Now we can create weighted transaction record, which is <(2):0.37>. Other clickstreams comparisons are demonstrated in Table 19.
Table 19: Click stream similarity with session <3,5,2> Clickstream CSSM Purchase
1,2 0.37 2 3,5,2,3 0.845 2,3
2,1,4 0.33 1,2,4 4,4,1,2 0.245 2,4,4
1,2,1 0.295 1
Step 3: Generating purchase predictions. After receiving weighted transaction values (Table 19) we use transaction-based weighted frequent item (TWFI) method to produce weighted frequent items (E.g. <2:1><3:0.189><4:0.167>). This method has three steps:
calculate average weight support (AWS).
AW S =sum(weight) (10)
For example, item4 has been purchased one time in the third sequence and two
times in the fourth sequence, so the sum of the weights is 0.82:
AW S(4) = 0.33 + 0.245 + 0.245 = 0.82
Step 3.3: Using feature scaling formula to normalize weighted support (Equation 11).
x0 = x−min
max−min (11)
for example, normalized rating for item3 is0.189:
x0 = x−min
max−min =
0.845−0.625
1.79−0.625 = 0.189
Step 3.4: Returning all of these items that have a normalized weighted support greater than minimum weighted support (e.g. (2:1),(3:0.189),(4:0.167)). In this ex-ample, minimum weighted support is 0.15. Then for each one of these items, if user has not purchased it, add the weight into the normalized user-item matrix (Table 19) to generate new user-item matrix (Table 20) which is less sparse now.
Table 20: Normalized user-item matrix with predicted weights Item 1 Item 2 Item 3 Item 4
User 1 ? 0.89 0.45 ? User 2 0.27 0.53 ? 0.8 User 3 1 1 0.189 0.167
Repeat step 2 and 3 until there is not any session without purchase.
(Table 17)
Table 21: Final user matrix with all of predictions Item 1 Item 2 Item 3 Item 4 User 1 0.63 0.89 0.45 0.49 User 2 0.27 0.53 0.35 0.8 User 3 1 0.74 0.27 0.33
CHAPTER 3
The Proposed Stacking Ensemble
E-commerce Recommendation
System (SEERS)
In this chapter, we introduce stacking ensemble e-commerce recommendation system (SEERS) which receives historical purchases of customers and uses a combination of collaborative ltering and sequential rule mining to recommend the best product to each user in an e-commerce dataset. All of the contributions, including steps and tasks required in each part will be explained in this section. Then we compare this proposed method with HOPE (Choi, Yoo, Kim, & Suh, 2012) e-commerce recommendation system through example. In the next chapter, precision, recall, and f1-score of the proposed method and its comparison with previous methods, including HOPE, are analyzed.
3.1 Input
The input of this method is a list of <CustomerId,P urchasedItem,T ransactiondate>