University of Windsor University of Windsor
Scholarship at UWindsor
Scholarship at UWindsor
Electronic Theses and Dissertations Theses, Dissertations, and Major Papers
8-15-2019
Investigation of Engine Coolant Loop Flow Modelling from a
Investigation of Engine Coolant Loop Flow Modelling from a
System Simulation Perspective
System Simulation Perspective
Elle Mistruzzi University of Windsor
Follow this and additional works at: https://scholar.uwindsor.ca/etd
Recommended Citation Recommended Citation
Mistruzzi, Elle, "Investigation of Engine Coolant Loop Flow Modelling from a System Simulation Perspective" (2019). Electronic Theses and Dissertations. 7822.
https://scholar.uwindsor.ca/etd/7822
This online database contains the full-text of PhD dissertations and Masters’ theses of University of Windsor students from 1954 forward. These documents are made available for personal study and research purposes only, in accordance with the Canadian Copyright Act and the Creative Commons license—CC BY-NC-ND (Attribution, Non-Commercial, No Derivative Works). Under this license, works must always be attributed to the copyright holder (original author), cannot be used for any commercial purposes, and may not be altered. Any other use would require the permission of the copyright holder. Students may inquire about withdrawing their dissertation and/or thesis from this database. For additional inquiries, please contact the repository administrator via email
Investigation of Engine Coolant Loop Flow Modelling
from a System Simulation Perspective
By
Elle Mistruzzi
A Thesis
Submitted to the Faculty of Graduate Studies
through the Department of Mechanical, Automotive & Materials Engineering
in Partial Fulfillment of the Requirements for
the Degree of Master of Applied Science
at the University of Windsor
Windsor, Ontario, Canada
Investigation of Engine Coolant Loop Flow Modelling
from a System Simulation Perspective
By
Elle Mistruzzi
Approved by
S. Natarajan FCA Canada Inc.
R. Carriveau
Department of Civil & Environmental Engineering
V. Roussinova
Department of Mechanical, Automotive & Materials Engineering
R. Balachandar, Co-Advisor
Department of Mechanical, Automotive & Materials Engineering
R. Barron, Co-Advisor
Department of Mechanical, Automotive & Materials Engineering
III
Declaration of Originality
I hereby certify that I am the sole author of this thesis and that no part of this thesis has been
published or submitted for publication.
I certify that, to the best of my knowledge, my thesis does not infringe upon anyone’s copyright
nor violate any proprietary rights and that any ideas, techniques, quotations, or any other
material from the work of other people included in my thesis, published or otherwise, are fully
acknowledged in accordance with the standard referencing practices. Furthermore, to the extent
that I have included copyrighted material that surpasses the bounds of fair dealing within the
meaning of the Canada Copyright Act, I certify that I have obtained a written permission from the
copyright owner(s) to include such material(s) in my thesis and have included copies of such
copyright clearances to my appendix.
I declare that this is a true copy of my thesis, including any final revisions, as approved by my
thesis committee and the Graduate Studies office, and that this thesis has not been submitted
IV
Abstract
The engine cooling system in a vehicle ensures that the engine runs at its most efficient
temperature under a variety of operating conditions. The system includes heat exchangers, a
thermostat, pump, plumbing lines and a cooling water jacket. Each branch of the system and its
different components need to receive adequate coolant flow. A system simulation (1D) model of
the coolant loop is generated with components of the system individually characterized using
geometry and/or performance data. Accurately modelling and capturing the flow behaviour of
the coolant through the entire system, including the complex water jacket, poses a particular
challenge. This thesis explores the use of experimental flow benches to support the research into
converting a physical engine cooling system into a robust 1D system model. GT-SUITE software
is used as the system simulation modelling platform, and its built-in application GEM3D is used
to convert the 3D CAD geometry. A detailed investigation is performed by carefully splitting the
plumbing and water jacket into multiple flow components. Non-dimensional pressure loss and
Reynolds number are calculated based on pressure drop and flow rate data, for a wide range of
temperatures including extreme cold conditions. Outcomes of this thesis include an in-depth and
improved modelling process, well validated component and system level models, and an overall
V
Acknowledgements
I would like to thank my advisors from the University of Windsor, Dr. Ronald Barron & Dr. Ram
Balachandar, for all of their support, patience and understanding over the past two years.
From FCA Canada I would like to thank Steve Simic & Kevin Studman for their support with my
experimental work, Shankar Natarajan for his support with my simulation work, and Mohammed
Malik & Marie Mills for being there whenever I needed help.
Finally, I could not have done any of this without the unconditional love and support of my
VI
Table of Contents
Declaration of Originality ... III
Abstract ... IV
Acknowledgements... V
List of Figures ... IX
List of Tables ... XII
List of Symbols, Nomenclature and Abbreviations ... XIII
1. Introduction ...1
1.1 Thesis Objectives ...4
1.2 Thesis Organization ...5
2. Literature Review ...6
2.1 Engine Cooling ...6
2.1.1 Design Process ...6
2.1.2 System Breakdown ...7
2.1.3 Literature Review of Previous Experimental Studies ... 13
2.2 System Simulation ... 16
2.2.1 System Design Principles ... 16
2.2.2 System Simulation Background ... 17
2.2.3 Governing Equations ... 18
2.2.3 Project Specific Equations ... 20
2.2.4 Literature Review of Previous Simulation Work ... 21
3. Experimental Flow Benches ... 24
3.1 Instrumentation ... 26
3.1.1 Pressure Sensors ... 26
3.1.2 Flow Meters ... 27
3.1.3 Thermocouples ... 27
3.1.4 Custom Fittings ... 28
3.2 Data Collection ... 29
3.2.1 Wiring and Connections ... 29
3.2.2 Data Programming Software... 31
3.3 Single Component Flow Bench ... 32
3.3.1 Flow Schematic ... 33
VII
3.3.3 Single Component Data Collection ... 34
3.4 System Level Flow Bench ... 36
3.4.1 Flow Schematic ... 36
3.4.2 Run Set Up ... 37
3.4.3 Detailed Engine Block Instrumentation ... 40
3.4.4 Hot Testing ... 43
3.4.5 Cold Testing ... 44
3.4.6 System Level Data Collection ... 45
4. Component Level Investigation ... 47
4.1 Radiator and Heater Core ... 48
4.2 Engine Oil Cooler and Transmission Oil Heater ... 50
4.3 Exhaust Gas Recirculation Cooler ... 52
4.4 Hot Bottle ... 54
4.5 Water Pump ... 56
4.6 Component Summary ... 57
5. System Level Investigation ... 58
5.1 Plumbing ... 59
5.2 Water Jacket Study... 62
5.2.1 Water Jacket Data ... 62
5.2.2 Water Jacket Geometry ... 64
5.2.3 Water Jacket 1D Model ... 67
5.3 Thermostat ... 71
5.4 System Model Build ... 74
5.5 System Model Run Process ... 76
5.6 System Model Correlation ... 78
5.6.1 Flow Correlation ... 78
5.6.2 Friction and Pressure Drop Effects ... 81
5.6.3 Model Over Prediction ... 83
5.7 Limitations of System Simulation ... 87
6. Conclusions ... 88
6.1 Summary ... 88
6.2 Conclusions ... 89
VIII
References ... 91
Appendix A: Uncertainty Analysis ... 93
Appendix B: DOE Study ... 94
IX
List of Figures
Figure 1. 1 – Engine heat rejection breakdown [1]. ... 1
Figure 1. 2 – 1D Coolant loop example [2]. ... 3
Figure 2. 1 – Onset of flow instability in engine cooling system [4]. ... 7
Figure 2. 2 – Radiator exterior and internal geometry [6]. ... 8
Figure 2. 3 – General schematic for EGRc exhaust and coolant sides [8]. ... 9
Figure 2. 4 – Engine oil cooler showing coolant supply and return lines [9]. ... 9
Figure 2. 5 – Hot bottle internal coolant distribution [10]. ... 10
Figure 2. 6 – Pump coolant side with two scroll exits [11]. ... 11
Figure 2. 7 – Thermostat wax pellet valve system [1]. ... 11
Figure 2. 8 – Plumbing assembly example [14]. ... 12
Figure 2. 9 – Water jacket block, gasket holes and head [15]. ... 13
Figure 2. 10 – Example of instrumented engine cooling test bench [16]. ... 14
Figure 2. 11 – Automotive product design tree [4]. ... 16
Figure 2. 12 – Computational domain for system simulation set up [15]. ... 17
Figure 2. 13 – Data exchange between 1D network model and 3D CFD model [19]. ... 18
Figure 2. 14 – Schematic of staggered grid discretization [2]. ... 19
Figure 2. 15 – Simple 1D engine cooling model [20]. ... 23
Figure 3. 1 – Isometric view of engine cooling system flow bench. ... 24
Figure 3. 2 – Side view of engine cooling system flow bench. ... 25
Figure 3. 3 – Pressure sensor, before and after bench installation. ... 26
Figure 3. 4 – Flow meter, front and cross-section views. ... 27
Figure 3. 5 – Thermocouple, before and after bench installation. ... 28
Figure 3. 6 – Custom fittings with variable diameter ends. ... 28
Figure 3. 7 – Bench mounted tachometer display and data logger. ... 29
Figure 3. 8 – Laser tachometer aimed at water pump. ... 29
Figure 3. 9 – Bench mounted terminal blocks and flow transmitter. ... 30
Figure 3. 10 – Plumbing clamps, water tight grommet, and Amphenol mating connector. ... 30
Figure 3. 11 – Single component flow bench itemization... 32
Figure 3. 12 – Single component flow bench scehmatic. ... 33
Figure 3. 13 – Single component flow bench reservoir and pump. ... 34
Figure 3. 14 – Heater core data collected on the single component flow bench. ... 35
Figure 3. 15 – TOH data collected on the single component flow bench. ... 35
Figure 3. 16 – System level flow bench itemization... 36
Figure 3. 17 – System level flow bench schematic. ... 37
Figure 3. 18 – Engine and radiator mounting angle diagram. ... 38
Figure 3. 19 – 3D engine cooling system CAD compared to physical flow bench. ... 38
Figure 3. 20 – Motor, pulley and belt system used to drive the water pump. ... 39
X
Figure 3. 22 – Cylinder block inlet CAD to bench instrumentation comparison... 40
Figure 3. 23 – Cylinder block outlet CAD to bench instrumentation comparison. ... 41
Figure 3. 24 – Head outlet CAD to bench instrumentation comparison. ... 41
Figure 3. 25 – Pump outlet CAD to bench instrumentation comparison. ... 41
Figure 3. 26 – Bypass CAD to bench instrumentation comparison. ... 42
Figure 3. 27 – Thermostat housing CAD to bench instrumentation comparison. ... 42
Figure 3. 28 – Water jacket instrumentation cluster mounted on engine exterior. ... 43
Figure 3. 29 – Insulated system level bench chamber. ... 43
Figure 3. 30 – Engine block cylinder bore heaters. ... 44
Figure 3. 31 – Port holes on insulated chamber for cold testing. ... 44
Figure 3. 32 – Remote conditioning unit fitted to insulated chamber. ... 45
Figure 3. 33 – EGRc data collected on the system level flow bench, closed thermostat. ... 46
Figure 3. 34 – Radiator data collected on the system level flow bench, open thermostat. ... 46
Figure 4. 1 – 1D radiator component model... 48
Figure 4. 2 – Dissected radiator and heater core for detailed geometry investigation. ... 49
Figure 4. 3 – Radiator component bench data to model correlation. ... 49
Figure 4. 4 – 1D TOH component model... 50
Figure 4. 5 – Dissected TOH for detailed geometry investigation. ... 51
Figure 4. 6 – TOH component bench data to model correlation. ... 51
Figure 4. 7 – 1D EGRc component model. ... 52
Figure 4. 8 – Dissected EGRc for detailed geometry investigation. ... 53
Figure 4. 9 – EGRc component bench data to model correlation. ... 53
Figure 4. 10 – 1D hot bottle component model. ... 54
Figure 4. 11 – Dissected bottle CAD for detailed geometry investigation. ... 55
Figure 4. 12 – Hot bottle component bench data to model correlation. ... 55
Figure 4. 13 – 1D pump component model. ... 56
Figure 4. 14 – Pump component supplier data to model correlation. ... 57
Figure 5.1 – Cutting plane location diameter and bend angle. ... 60
Figure 5. 2 – Discretized coolant loop plumbing. ... 61
Figure 5. 3 – Discretized water jacket. ... 62
Figure 5. 4 – Water jacket CFD result schematic. ... 63
Figure 5. 5 – Water jacket geometry with data locations. ... 63
Figure 5. 6 – Flow split cutting plane. ... 64
Figure 5. 7 – Cylinder block flow splits. ... 65
Figure 5. 8 – Port hole numbering in GEM3D. ... 65
Figure 5. 9 – Gasket hole connection between block and head flow splits. ... 66
Figure 5. 10 – Gasket hole numbering on head subassembly. ... 66
Figure 5. 11 – Gasket hole numbering on block subassembly. ... 66
Figure 5. 12 – Head subassembly 1D model. ... 67
Figure 5. 13 – Block subassembly 1D model. ... 67
XI
Figure 5. 15 – Left head 1D model correlation. ... 69
Figure 5. 16 – Gasket hole flow rate results. ... 70
Figure 5. 17 – Thermostat CFD result schematic. ... 71
Figure 5. 18 – 1D thermostat model. ... 73
Figure 5. 19 – Thermostat closed 1D model correlation. ... 73
Figure 5. 20 – 1D system level model, with flow component view. ... 75
Figure 5. 21 – 1D system level model, with pipe view. ... 75
Figure 5. 22 – Post processing temperature values, in degrees Celsius. ... 77
Figure 5. 23 – Post processing pressure values, in psi. ... 77
Figure 5. 24 – Heater core correlation within system level model. ... 79
Figure 5. 25 – TOH correlation within system level model. ... 79
Figure 5. 26 – System pressure drop at ambient condition based on thermostat position. ... 80
Figure 5. 27 - Reynolds number at locations throughout the engine cooling system. ... 82
Figure 5. 28 - Pressure drop points in the system model. ... 83
Figure 5. 29 - Virtual mass correction for pressure drop calculation. ... 84
Figure 5. 30 – Extreme cold component model correlation. ... 84
Figure 5. 31 – Extreme cold system model overprediction. ... 85
Figure 5. 32 – Extreme cold system model correlation. ... 86
Figure A. 1 – DOE parameter set-up and experiment number definition. ... 94
Figure A. 2 – Temperature parameter range. ... 94
Figure A. 3 – Result display selection for pressure drop across each heat exchanger. ... 95
Figure A. 4 – DOE study results for pressure drop across heat exchangers, at 1000 RPM pump speed. ... 95
XII
List of Tables
Table 2. 1 – Coolant freezing point by antifreeze percentage [5]. ... 8
Table 4. 1 – Radiator/heater core model inputs. ... 49
Table 4. 2 – Oil cooler/heater model inputs. ... 50
Table 4. 3 – EGRc model inputs. ... 53
Table 4. 4 – Hot bottle model inputs. ... 54
Table 5. 1 – List of coolant loop plumbing lines. ... 59
Table 5. 2 – 3D to 1D conversion inputs. ... 60
Table 5. 3 – Thermostat vs. bypass lift values. ... 72
XIII
List of Symbols, Nomenclature and Abbreviations
1D One-dimensional
3D Three-dimensional
A Amps
AWG American wire gauge
C Celsius
CAD Computer aided design
CFD Computational fluid dynamics
DOE Design of experiments
EGRc Exhaust gas recirculation cooler
EOC Engine oil cooler
GFM Global friction multiplier
GPM Gallons per minute
HVAC Heating, ventilation and air conditioning
kPa Kilopascals
LPM Litres per minute
mm Millimeter
NPT National pipe thread
OFI Onset of flow instability
PDM Pressure drop multiplier
PID Proportional integral derivative
psi Pounds per square inch
Re Reynolds number
RPM Revolutions per minute
TOH Transmission oil heater
V Volts
VFD Variable frequency drive
VTMS Vehicle thermal management system
1
1.
Introduction
Since the conception of automobiles in the early 20th century, a number of advancements
have been made in the field of internal combustion engines to improve overall vehicle
performance and efficiency. Although many improvements have been made, these engines still
lack the ability to harness all the chemical energy produced by fuel combustion into mechanical
power needed to propel the vehicle. Some energy produced by the engine is dissipated as waste
heat, and therefore an engine cooling system is critical for maintaining an optimum temperature.
Figure 1.1 highlights an engine cooling loop with a typical breakdown for engine heat rejection
post combustion, indicating coolant is responsible for absorbing 30% of the heat produced.
Effective engine cooling ensures a vehicle reaches an efficient operating temperature as quickly
as possible and works to maintain this temperature under a wide range of operating conditions
and engine loads. At optimum engine operating temperature, the combustion chamber is
adequately heated to vapourize fuel, to ensure that oil maintains a lower viscosity to move more
freely (thereby wasting less power to move parts), and metal parts undergo reduced wear.
2
Most current production vehicles rely on liquid coolant to flow through the engine cooling loop
via plumbing lines, to reach a number of components within the system. Typically, this coolant is
a mixture of water and antifreeze, which characteristically has a higher boiling point and lower
freezing point than water alone. In addition, while working to regulate the system temperature,
the ideal coolant should neither cause nor promote corrosion throughout the system. The
components of the system include a number of heat exchangers with passages for coolant to
flow through, that either absorb or dissipate the heat, generally in exchange with air or oil.
The complete engine cooling system incorporates plumbing lines, which connect and provide
channels for coolant flow to and from components, a thermostat which controls when coolant
flows to peripheral components of the system based on coolant temperature, and the water
jacket, which provides an intricate geometry of passages for coolant to flow through the engine.
A summary of the system coolant flow path is given below:
1. Coolant leaves the water pump and passes through the water jacket.
2. Before reaching operating temperature, cold coolant leaves the water jacket and flows
past the closed thermostat via the bypass pipe to recirculate through the water jacket.
3. Once at operating temperature, hot coolant leaves the water jacket to flow through the
open thermostat into a network of plumbing lines.
4. The plumbing lines supply coolant to pass through the tubes, plates or shells of each heat
exchanger.
5. Plumbing lines return coolant from each heat exchanger back to the pump to repeat the
loop over again.
In reality, this path is quite complicated with a variety of geometries, materials and
subassemblies, all relying on each other to function correctly. For example, if a plumbing line
diameter is too small, inadequate coolant flow will reach the heat exchanger, or if a water jacket
gasket hole is misplaced, engine overheating can occur. This is why establishing a robust coolant
circuit is so critical as a first step to designing a fully functioning engine cooling system which
3
Predicting the engine cooling requirements of various vehicles, and how to sufficiently satisfy
them, poses a particular challenge for automakers. A prior estimation of component
requirements, how they interact during vehicle operation and an estimation of flow
requirements are all crucial to designing an acceptable coolant loop. In recent decades,
advancements in computational modelling tools have greatly increased industry capabilities for
solving these fluid flow problems. System simulation is a comprehensive tool that can be used to
model a number of vehicle systems (i.e. lubrication system, HVAC system, engine cooling system
etc.). Each system is made up of many components, and a system simulation model characterizes
each component by geometry, and/or performance data across an inlet and outlet. The
interactions of these individual components are simulated with appropriate physics, referred to
as 1D simulation. Figure 1.2 shows an example of a 1D system simulation model, including several
heat exchangers and coolant plumbing lines. System simulation is a useful tool early on in vehicle
development when limited information or data is available. In addition, system simulation saves
time to reach preliminary results and overall cost for the automaker.
4
1.1Thesis Objectives
The objective of this thesis is to accurately capture and characterize the flow behaviour of
engine coolant in a vehicle engine cooling system, using a 1D system level model. The system
includes heat exchangers, a thermostat, a pump, plumbing lines, and a cooling water jacket.
Before the complex heat transfer phenomena occurring in the system can be analyzed, the flow
behavior needs to be understood correctly. Capturing the pressure drop through the various
components of the cooling system, viscous effects of working fluids due to extreme cold
conditions, and appropriate representation of plumbing line and water jacket pressure drop
characteristics are all important to modelling the flow behaviour. An accurate flow model is the
first step towards developing a robust transient thermal model. With a good predictive model, it
is possible to shorten the overall vehicle design cycle.
For both the experimental and modelling portions of this project, the engine cooling system is
referred to as adiabatic. Although in reality heat exchange is always occurring between fluids and
components, as that is the fundamental purpose of the engine cooling system, this work is
focused strictly on the flow behaviour of coolant at a constant temperature. No external effects
(i.e. air flow across the radiator, heat generated from combustion etc.) are imposed or
considered.
The first part of this project involves characterizing components individually. This includes the
radiator, heater core, transmission oil heater, engine oil cooler, exhaust gas recirculation cooler,
coolant hot bottle, thermostat, and pump. Each component presents a unique challenge when it
comes to modelling the flow behaviour. Generally, limited supplier data is available, if at all, for
each component. Therefore, a component level experimental flow bench was developed to
collect pressure and flow data across one component at a time, and validate component models.
The second part of this project involves modelling the full engine coolant loop. To accomplish
this, the plumbing lines require meticulous discretization to be converted into 1D flow
components. The complex 3D water jacket geometry poses a particular challenge for 1D
conversion, and existing CFD data aided in validating the flow splits generated in the 1D software.
In addition, a system level experimental flow bench was developed to collect data across the
5
conditions. Furthermore, the system level bench testing capabilities were expanded to collect
data at extreme cold conditions to aid in better predicting engine coolant flow behaviour at
extreme cold correctly, which is essential during the development phase of the vehicle. This was
a significant development not only for experimental capabilities, but for the support it provided
in validating the modelling process.
1.2Thesis Organization
This thesis is organized into several chapters outlined below.
Chapter 2 – Literature Review: This chapter presents the background research done
during the first phase of the project. It details engine cooling design background, relevant
formulae, flow theory and software tools used throughout the project to give the reader
an overall understanding of the topic.
Chapter 3 – Experimental Flow Benches: This chapter describes the experimental test
setup for both the single component flow bench and system level flow bench, including
the extreme cold condition testing. Flow and pressure instrumentation, data logging, data
collection, test procedure and physical testing are explained in detail.
Chapter 4 – Component Level Investigation: This chapter explains the detailed
investigation done at the component level for each of the heat exchangers and pump
including all part dissection, modelling and model validation.
Chapter 5 – System Level Investigation: This chapter explains the detailed investigation
done at the system level including conversion of the 3D plumbing geometry into 1D flow
components, complex water jacket study, thermostat operation, system modelling and
model validation. Results and analysis on how to achieve model correlation for extreme
cold condition are discussed.
Chapter 6 – Conclusions: The final chapter expresses the conclusions of the project and
recommendations for future work. Important factors that affect flow in 1D modelling are
described and a confidence interval on results between experiments and modelling is
6
2.
Literature Review
This project involves research on a mid-size internal combustion engine, and more specifically
its coolant loop. All background information on the components associated with the coolant loop,
as well as the coolant itself, is discussed in this literature review. Past work on engine cooling
design and performance is highlighted. Furthermore, a background on system simulation and
how this tool can be used in engine cooling is outlined in detail.
2.1Engine Cooling
Automakers introduced engine cooling to control and mitigate the heat rejection of an internal
combustion engine. Many variables need to be considered in the design process, such as boiling
point of the coolant, specific heat, inlet air velocity and heat rejection values, and the relationship
between all these variables must be carefully weighed. Research shows that an adequate flow
rate of coolant is essential for the avoidance of hot spots in the engine and acceptable heat
dissipation performance by the engine cooling system [3].
2.1.1 Design Process
Engineers have successfully designed and built vehicles for both commercial and personal use
for over 100 years, and as time progressed the dimensions and specifications of individual
components became standardized, allowing parts to fit together without adjustment. Ultimately
this led to mass production and, although vehicles have been refined by performance
improvements and shape changes, the fundamental function of vehicles has never changed [4].
Engine internal flow requirements dictate the internal flow subsystem parameters. Under all
engine operating conditions, the local coolant flow rate should always be greater than the flow
rate at which the onset of flow instability due to vapourization occurs. Moreover, engine coolant
flow rate should be less than the flow rate which causes measureable erosion, and sufficient to
purge any accumulated air or vapour, under all operating conditions [4]. The pump
characteristic/supply curve plots the pressure rise across the pump versus flow rate and
illustrates the possible flow rate/pressure rise combinations that a given pump at a single RPM
can supply. The possible combinations of flow rates and pressure rise required by a system is
7
upward because the frictional losses increase as the flow rate increases. The operating point
where these two curves meet is the point at which the flow rate and pressure rise provided by
the pump is equal to that which is required by the system [4]. Onset of flow instability (OFI) is the
point at which the flow rate through the coolant plumbing falls below a critical value and vapour
bubbles begin to block the flow; increased pressure becomes necessary to maintain required
minimum flow. The system must be designed to supply a flow rate well above the critical flow
rate to avoid the onset of flow instability and engine overheating [4].
Figure 2. 1 – Onset of flow instability in engine cooling system [4].
2.1.2 System Breakdown
i. Coolant
Engine coolant is a mixture of water and antifreeze. The antifreeze used in the present
study is ethylene glycol, which lowers the freezing point of water-based coolant and increases its
boiling point. A 50-50 water to antifreeze mixture is desirable, to ensure a wide range of
temperatures at which the coolant can remain in liquid phase and for optimal specific heat
capacity. Tables 2.1 lists freezing point for antifreeze, ranked by the percentage of ethylene glycol
contained in the mixture. Antifreeze also includes corrosion inhibitors to protect the engine and
8 Table 2. 1 – Coolant freezing point by antifreeze percentage [5].
ii. Radiator/Heater Core
A radiator is a heat exchanger which aids in keeping the system at the optimal operating
temperature by rejecting excess heat generated by the engine to the ambient air. A tube and fin
heat exchanger is shown in Figure 2.2. Hot coolant flows along the internal passages of the engine
through many thin tubes of the radiator located at the front grille of the vehicle. Airflow passes
perpendicular to these coolant tubes through fins to bring down the coolant temperature. The
airflow is both induced by the moving vehicle, known as ram air, and the cooling fan mounted
underneath the hood of the vehicle [6].
Figure 2. 2 – Radiator exterior and internal geometry [6].
Similarly, a smaller radiator, called a heater core, serves to warm the vehicle interior by use of a
blower fan forcing air across the warm coolant lines into the cabin.
iii. Exhaust Gas Recirculation Cooler
The thermal efficiency of internal combustion engines can be enhanced by increasing the
rate of exhaust gas recirculation (EGR) to help achieve lower temperature combustion. However,
if the EGR rate is too high, the flame speed of ignition becomes unstable and overall engine
efficiency goes down [7]. Therefore, an exhaust gas recirculation cooler (EGRc) is introduced to
9 Figure 2. 3 – General schematic for EGRc exhaust and coolant sides [8].
This is also a tube and fin heat exchanger, in which hot exhaust gas passes through fins in one
channel and is cooled by liquid coolant passing through the opposite channel.
iv. Oil Cooler/Heater
Engine oil and transmission oil are used to lubricate the components of their respective
circuits, to improve overall efficiency and increase their lifespan. Depending on the stage of
engine warm up or load, a heat exchanger is used to cool or heat oil by use of a plate heat
exchanger. In this type of heat exchanger, oil flows between corrugated plates and liquid coolant
flows between alternating passages inside the heat exchanger, to either absorb or give off heat
to the adjacent oil passages [9]. The engine oil cooler is typically mounted directly on the engine
and supplied with inlet coolant flow from the water jacket (Figure 2.4), while the transmission oil
heater is generally an extension of the plumbing connected to the transmission.
10 v. Hot Bottle
A hot bottle (or degas bottle) is used in the engine coolant loop to provide space for
expansion under high heat conditions. Located at the highest point in the system, this bottle is
not for overflow, but rather provides a cushion of air to allow for the coolant to expand, and
contains sufficient coolant to avoid pulling air into the system (in the case of contraction, or liquid
shift) [10]. High flow rates throughout the engine cooling system can cause air bubbles to form,
and these bubbles will naturally migrate to the highest point in the system. Without the hot
bottle, these air bubbles would degrade the coolant heat transfer quality and could ultimately
lead to the engine overheating.
Figure 2. 5 – Hot bottle internal coolant distribution [10].
Although a hot bottle has one inlet and one outlet, there are numerous chambers, baffles and
passages (Figure 2.5) within the bottle that the coolant must flow through to allow for aeration
and prevent system starvation.
vi. Pump
A mechanical, centrifugal pump is mounted to the engine and driven via the crankshaft
by a belt system with a fixed pump-speed to engine-speed ratio. As the engine speed increases,
11 Figure 2. 6 – Pump coolant side with two scroll exits [11].
Coolant leaves the pump through a smoothly curved scroll passage to enter the warm cylinder
block (on two sides in the case of a V style engine block, see Figure 2.6), then circulates through
the hot head passages, out to the radiator where it cools and recirculates back through the engine
cooling system. Ultimately the pump is used to circulate coolant through the entire engine
cooling system and overcome pressure losses [12].
vii. Thermostat
A thermostat is used to control flow of coolant through the engine cooling system. A
wax-pellet valve (Figure 2.7) will open when the engine and the coolant passing through it approach
operating temperature (in the range of 95 to 100ᵒC) [13]. A small bypass passage allows coolant
to flow past the seat of the closed thermostat under cold conditions. Coolant will continue to
cycle through this bypass until the engine heats up sufficiently and the thermostat opens. Upon
opening, the thermostat valve then allows coolant to flow to the peripheral heat exchangers to
begin the process of cooling via the radiator.
12 viii. Plumbing
A variety of pipes and hoses are used to supply coolant to each component in the engine
cooling system, and return the coolant back through the engine block to repeat the cycle. This
plumbing circuit is designed to withstand high and low temperature extremes and be flexible
enough to withstand vibrations that occur under the vehicle hood [14].
Figure 2. 8 – Plumbing assembly example [14].
The geometry and layout of the plumbing circuit is dictated by the availability of space under the
hood of the vehicle. The cross-section of each plumbing section needs to allow for sufficient
coolant flow while mitigating unnecessary pressure losses. Clamps are used to connect multiple
hose sections and to connect hoses to components (Figure 2.8).
ix. Water Jacket
The water jacket includes the internal engine passages through which the coolant flows.
This complex geometry surrounds and/or passes through the pistons, cylinder bores, cylinder
block and head. Its main function is to allow heat generated within the combustion chamber to
be dissipated to the coolant.
The three main sections of the water jacket are the block passages, head passages and the gasket
between these two (Figure 2.9). The gasket is made up of many small holes that act as conduits
between the block and head, and ultimately these holes govern the flow and distribution of
coolant. It is desired to have a well distributed flow of coolant around all engine cylinders,
resulting in more efficient heat transfer from the heated engine surfaces. The gasket hole
dimensions and intricate passage geometry contribute to overall pressure drop. Optimizing these
water jacket features is key to optimizing the system performance. A significant amount of time
13 Figure 2. 9 – Water jacket block, gasket holes and head [15].
2.1.3 Literature Review of Previous Experimental Studies
The behaviour of coolant through an engine cooling system has been experimentally
studied by use of varying test stands and flow bench set-ups. For the purpose of engine cooling
research, the performance of the combined system of components, or individual components, is
typically characterized by one or more of the three following factors: pressure, flow rate and
temperature.
To assess the effect of cooling system configuration, Cehreli [12] compared two different layouts,
particularly alternate plumbing configurations of the oil cooler, by performing experimental tests
which collected pressure and flow data at elevated temperatures of 75ᵒC, 92ᵒC and 100ᵒC across
each heat exchanger (radiator, EOC, heater core and EGRc) in the system. They concluded it was
important to reduce hose bends and increase hose diameters to increase overall flow rate of
coolant, which ultimately led to achieving the minimum coolant system pressure limit and
avoiding cavitation that could occur if the pressure were to fall below the saturated vapor
pressure anywhere in the system. This is an important insight to the significance of plumbing
layout and dimensions, and how this ultimately affects the available coolant flow throughout the
system. A similar style of experimental study was later performed by Krakowski [16], using a test
stand which extended data collection to elevated temperatures up to 120ᵒC, however only
14
was focused on the operation of the cooling intensity control, by varying the degrees to which
the system was filled with coolant (80% through 95%) and how each of these conditions affects
the overall system pressure drop. Ultimately it was concluded that the pressure limit of the
system is best regulated at 90% coolant fill level, with the remaining 10% acting as a pressure
accumulator. This is key to understanding the sensitivity of an engine cooling system relative to
coolant quantity and how to navigate the varying conditions at which the coolant must perform
despite changes in temperatures. Chastain et al. [17] studied the radiator, water jacket and
thermostat interaction, which included the use of an electrically powered fan to replicated the
heat exchange between airflow and coolant flow at the radiator. This study focused exclusively
on the collection of high temperature data and involved instrumenting each component with
thermocouples to determine the distribution of heat throughout the engine. The results are
fundamental in demonstrating how each component in the system affects the next by capturing
the temperature distribution and how it changes when external factors are introduced.
Figure 2. 10 – Example of instrumented engine cooling test bench [16].
Experimental studies specific to one component from an engine cooling system have also been
performed. Mehravaran and Zhang [10] demonstrated the use of a test stand specifically for
investigating coolant flow through a hot bottle, for the purpose of ensuring adequate and even
coolant distribution was achieved. The inlet and outlet were plumbed with coolant lines and the
flow was imposed through the use of an electrically driven pump in controlled increments. The
15
maintain degassed coolant (i.e. limiting the formation of air bubbles and in turn the degradation
of heat transfer). This study shows the importance of establishing adequate coolant flow through
one component before moving on to evaluate coolant flow through the whole system. Saidi et
el. [18] studied radiator performance, through the use of a dynamometer facility which imposed
moving vehicle conditions. In this study, data was collected specific to the air side pressure drop
with the use of pitot tubes, relative to vehicle speed and coolant flow rate. Studies such as this
are performed with the vehicle engine running, to include both fluid sides related to the exchange
of heat for a particular component, however the focus is not on the coolant flow side.
Although engine cooling experiments and flow benches have been developed in the past which
incorporate a limited number of engine cooling components, or incorporate a limited number of
conditions for one component, the literature is lacking to support proof of coolant side specific
data collection, either at component level or for a full system. The aforementioned experimental
work has been focused on elevated coolant temperature ranges, however it is important to also
investigate flow behaviour at extreme cold conditions to better understand coolant flow
behaviour at the full range of temperatures a vehicle cooling system would be required to
perform under, at a component and system level. Kneba and Smieja [20] reinforced that the
temperatures and pressures that a cooling system can maintain are dependent on the viscous
properties of the liquid coolant. Gu and Ni [19] studied heat exchanger performance
experimentally, by replacing the radiator of a simplified vehicle circuit with a generic intensive
heat exchanger and passing cold water over the (traditionally) air side, however the other
components in the system set-up remained at ambient condition. A set up such as this provides
insight into the flow behaviour of coolant at cold temperatures, however it lacks the contribution
of the complicated geometry that the coolant needs to pass through in an actual radiator and the
complicated plumbing network to which it is attached. Furthermore, a detailed study and
collection of data specific to water jacket coolant flow is lacking in existing literature, which is key
to understanding overall cooling system flow behaviour. Meticulous and well thought out
instrumentation of the water jacket is necessary to capture and analyze flow data throughout
16
2.2System Simulation
2.2.1 System Design Principles
Requirements for the design of vehicle cooling systems are developed using system
engineering principles to show how a systematic approach can maximize value, by improving the
function, quality, reliability and production time for an engine cooling system (Figure 2.11).
Traditionally the focus of the engine cooling design has been on the extremes of operation.
However, these extremes don’t represent the typical operating conditions that concern the
vehicle owner. The vehicle owner expects the system to be consistently robust from the day the
vehicle is produced and every subsequent day it is driven. Corporate and commercial
requirements also place constraints on the design of the cooling system. Overall powertrain and
vehicle design dictate the design schedule and details for the cooling system, including the
physical location of components and available space for placement. For engine cooling systems,
the number of functional requirements is considerable. Vehicle requirements, customer
requirements, business requirements, legislative requirements and powertrain requirements all
come into effect [4].
Figure 2. 11 – Automotive product design tree [4].
As far back as 1965 it was recognized that, with a growing awareness of the complexities involved
in the engine cooling design process, the use of a sophisticated computer and powerful software
17
have become more sophisticated for use in the early phase of vehicle development [21]. Specific
to engine cooling, systems simulation (1D) and computational fluid dynamics (CFD) can be used
to determine flow velocities (Figure 2.12). If the simulation indicates that the engine required
minimum flow is close to or greater than the supplied flow rate, then the design must change to
increase the flow rate to the engine [4]. This is the general principle which is applied to all parts
of an engine cooling system during the simulation process.
Figure 2. 12 – Computational domain for system simulation set up [15].
2.2.2 System Simulation Background
Simulation tools have become more prominent in the development phase of a vehicle
design process, as they supersede the need for in-vehicle testing and many expensive resources.
A vehicle thermal management system (VTMS) includes the gas circuit, the cooling circuit, the
lubrication circuit, and the thermal capacitance of the engine under load.
A modern VTMS needs to coordinate the thermal contribution of the engine cooling system, the
passenger compartment, the engine compartment, and external aerodynamics. The first phase
of VTMS involves a cold engine and the need to deliver sufficient heat to the powertrain and
passenger cabin in a timely fashion, while the second phase involves the warm engine and in turn
the need for cooling. There is always the need for heat balance, where the heat released from
the combustion chamber has to be equal to the heat transfer to the surroundings via coolant and
18
provide competitive advantages, with a reduced time for the overall product development cycle
and cost [22].
A flow network is created to represent the interaction between numerous components within a
system. The results derived from 1D simulation of an engine coolant loop can be used for
correlation with experimental results, and as input to additional models that represent
interactions with other systems within a vehicle, including 3D CFD. Figure 2.13 shows a 3D flow
split being modelled using CFD software, with 1D results as inputs for each boundary.
Figure 2. 13 – Data exchange between 1D network model and 3D CFD model [23].
2.2.3 Governing Equations
A 1D flow model involves the solution of the conservation of mass, momentum and
energy equations [2]. These equations are solved in one dimension, meaning all quantities are
averages across the flow direction. The system being modeled is discretized into multiple
volumes and these volumes are connected by boundaries (Figure 2.14). A staggered grid
arrangement is employed wherein scalar variables, such as pressure, are assumed to be uniform
19 Figure 2. 14 – Schematic of staggered grid discretization [2].
The software used for this project is GT-SUITE, a 1D platform with a comprehensive set of
built-in applications which simulate the physics of fluid flow. The conservation equations solved by
GT-SUITE flow problems, in general, are shown below:
Mass: 𝑑𝑚
𝑑𝑡 = ∑ 𝑚̇ (1)
Energy: 𝑑(𝑚𝑒)
𝑑𝑡 = −𝑃
𝑑𝑉
𝑑𝑡 + ∑(𝑚̇𝐻) − ℎ𝐴𝑠(𝑇𝑓𝑙𝑢𝑖𝑑− 𝑇𝑤𝑎𝑙𝑙) (2)
Enthalpy: 𝑑(𝜌𝐻𝑉)
𝑑𝑡 = ∑(𝑚̇𝐻) + 𝑉
𝑑𝑃
𝑑𝑡 − ℎ𝐴𝑠(𝑇𝑓𝑙𝑢𝑖𝑑− 𝑇𝑤𝑎𝑙𝑙) (3)
Momentum: 𝑑𝑚̇
𝑑𝑡 =
𝑑𝑃𝐴 + ∑(𝑚̇𝑢) − 4𝐶𝑓𝜌𝑢|𝑢|2 𝑑𝑥𝐴𝐷 − 𝐾𝑝(12 𝜌𝑢|𝑢|) 𝐴
𝑑𝑥 (4)
where
t Time
𝑚̇ Boundary mass flux into volume
20
𝑉 Volume
𝑃 Pressure
𝜌 Density
𝐴 Cross-sectional flow area
𝐴𝑠 Heat transfer surface area
𝑒 Total specific internal energy
𝐻 Total specific enthalpy
ℎ Heat transfer coefficient
𝑇𝑓𝑙𝑢𝑖𝑑 Fluid temperature
𝑇𝑤𝑎𝑙𝑙 Wall temperature
𝑢 Velocity at the boundary
𝐶𝑓 Fanning friction factor
𝐾𝑝 Pressure loss coefficient
𝐷 Equivalent diameter
𝑑𝑥 Discretization length
𝑑𝑃 Pressure differential acting across 𝑑𝑥
Two different time integration methods are available to choose when setting up a flow simulation
within GT-SUITE. The first is explicit, with primary solution variables of mass flow, density and
internal energy. With the explicit method, the values at the new time step are calculated using
values from the previous time step. The second is implicit, with primary solution variables of mass
flow, pressure and total enthalpy. The implicit method solves the values in all sub-volumes at the
new time step simultaneously, by iteratively solving the non-linear system of algebraic equations
[2].
2.2.3 Project Specific Equations
This project involves the simulation of an adiabatic engine coolant loop with a focus on
pressure and flow data specifically. Based on the pressure drop, flow rate and geometry,
GT-SUITE calculates the non-dimensional pressure loss coefficient and Reynolds number (Re) during
21
𝐾𝑝 = 2Δ𝑃𝜌𝐴𝑟𝑒𝑓
2
𝑚̇12 (5)
𝑅𝑒 = 𝑚̇ 𝐿1 𝑟𝑒𝑓 𝜇𝐴𝑟𝑒𝑓
(6)
where
Δ𝑃 Difference in total pressure
𝜌 Density
𝐴𝑟𝑒𝑓 Reference area
𝑚̇1 Inlet mass flow rate
𝐿𝑟𝑒𝑓 Reference length
𝜇 Dynamic viscosity
During simulation, the flow rate is imposed according to this non-dimensional relationship, and
the pressure drop vs. flow rate output values will respond appropriately based on changes made
to the fluid temperature in the simulation set-up.
2.2.4 Literature Review of Previous Simulation Work
Gu and Ni [19] demonstrated the capability of 1D system simulation software to capture
the coolant flow behaviour and heat transfer of a simple, single heat exchanger circuit by using
experimental results for correlation within 2.4% error, and provided that this simple model can
serve as a platform to optimize a more detailed component or circuit. Furthermore, they
recommend to incorporate the influence of the radiator, thermostat and water pump to further
study the engine cooling performance. A study done by Soloman [6] expands on this by
developing a detailed 1D radiator model, inputting a number of specifics including temperature,
core size, fin thickness, coolant flow rate, and air flow rate, which proved to output a radiator
performance curve that was accurate within 7% of the experimental results, and could be used
to quickly approximate the size of radiator in early product development. Similarly, Liang et al.[7]
continued this detailed component investigation to study the effects of thermochemical
composition on exhaust gas recirculation flow rate, through a dedicated EGR. These studies
22
in the engine cooling modelling process, and acknowledge the complicated flow behaviour that
needs to be captured and calibrated on a component level before the investigation can expand
to include a more intricate system model.
A number of well documented 1D investigations have been done on mechanical systems, such as
a starter motor study by Michelloti and da Silva [22] and an engine power study by De Risi et al.
[24]. However, limited literature is available which details the investigation of the coolant side of
any one cooling component. This contribution is critical to establishing a robust 1D model for the
coolant side flow behaviour, and is essential to draw conclusions on an individual component’s
performance. Furthermore, component level models provide the insight into possible design
change opportunities that would ensure a component can meet the minimum coolant flow
requirements to sufficiently remove or dissipate heat during vehicle operation. By not building a
detailed component model, or simply using a black box approach, the performance and potential
geometry updates cannot be sufficiently evaluated.
From a system perspective, Pathuri and Nagarhalli [25] performed a system simulation for engine
cooling performance, correlated with vehicle level testing data. Their coolant circuit 1D model
was isothermal and included only select plumbing, radiator performance data, and thermostat
and pump characteristic curves. Air flow patterns on the radiator were imported from a 3D CFD
analysis, and an overall system 1D model correlation was achieved within 8% of the experimental
results. Work done by Bolehovsky and Novotny [26] highlights the necessity of including all
components in a 1D engine cooling model before moving on to transient simulations, as their
study attempted to utilize a simplified cooling system and it proved difficult to achieve correlation
when 3D under hood airflow data was introduced.
Watanabe et al. [23] performed an engine cooling system investigation which involved
co-simulation methodology, which involved the communication between 1D and 3D CFD software.
Although detailed internal flow results were gained from the incorporation of 3D component
results, they conclude that uncertainties in boundary conditions were reduced and overall
simulation time was achieved by using a 1D system approach, while conserving overall mass in
23 Figure 2. 15 – Simple 1D engine cooling model [25].
An engine cooling system 1D model should be robust enough to capture all system complexities.
The aforementioned 1D models have been simplified with regards to the engine water jacket.
The complicated 3D block-gasket-head geometry has been modelled as a simple flow split with
one inlet and one outlet (Figure 2.15). This has been driven by the desire to quickly achieve
validated results and generate sufficient data to move on to the next vehicle design phase
However, there is little research investigating the full engine cooling system to include a complex
water jacket and all component interactions at a 1D level. In order to properly build and validate
an engine cooling system level model, it is critical to do a detailed investigation of the flow
behaviour through the engine, as well as through the plumbing and other components discussed
24
3.
Experimental Flow Benches
Experimental flow benches were developed for this project to evaluate coolant flow
behaviour under a variety of conditions, and collect data which can be used to validate a 1D
system simulation model. These conditions include a range of water pump speeds and coolant
temperatures. Flow and pressure data were collected across plumbing branches and heat
exchangers to be analyzed and used in 1D modelling, but also to conform to design requirements
and optimize cooling performance. These flow benches provide the ability to evaluate variable
cooling system design paths, as in plumbing geometry, and a variety of components used within
the cooling system. Each bench is operated by rotating the water pump using a variable
frequency drive electric motor, which provides the ability to induce and control the flow of
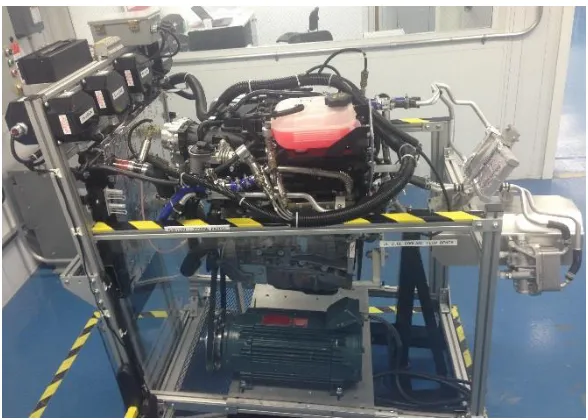
coolant through the plumbing lines. Figures 3.1 & 3.2 show the system level flow bench isometric
and side views, respectively.
Figure 3. 1 – Isometric view of engine cooling system flow bench.
A system level flow bench was built to accurately replicate the cooling system configuration that
would be found in-vehicle, including all plumbing lines and heat exchangers. A single component
25
outlet line. The development and build of the system level flow bench and single component flow
bench involved meticulous planning and attention to detail with regards to placement of
instrumentation for capturing the flow and pressure characteristics. This chapter discusses the
thought process and method behind designing, building, and running each experimental flow
bench.
26
3.1Instrumentation
This section will highlight the instrumentation used to collect pressure and flow data across
the plumbing branches of the experimental flow benches. Uncertainty analysis for this
instrumentation can be found in Appendix A. Also discussed are the thermocouples used to
record coolant temperature and custom fittings created to accommodate all instrumentation.
3.1.1 Pressure Sensors
To collect coolant pressure data, pressure transducers were used at several locations on each
experimental flow bench. Acquired from General Electric Digital Solutions, these pressure
transducers were chosen for their high accuracy and installation feasibility. Relevant
specifications for these sensors are:
- Pressure range: 0 to 50 psi
- Output signal: 0 to 5 V
The transducer comes into contact with the coolant for pressure measurement by screwing the
bottom threaded end into a 1/8” NPT tap, either in an in-line plumbing fitting or directly into the
part (e.g. engine block). The top end then plugs into a 6-pin Amphenol mating connector and
relays information to the data logger via the appropriate wiring. Figure 3.3 shows a transducer
before and after bench installation.
27
3.1.2 Flow Meters
To collect coolant flow data, flow meters were used at several locations on each
experimental flow bench. Acquired from Flow Technology Inc., these turbine flow meters were
chosen for their high accuracy and turbine functionality. Relevant specifications are listed below:
- Flow range(s): 0 to 10 GPM, 0 to 25 GPM, and 0 to 160 GPM
- Output Signal: 0 to 10 V
A flow meter was embedded directly into the plumbing line, and the coolant passes through the
turbine blades for flow measurement. The GPM range is relative to the diameter of the plumbing,
and is thus chosen to best fit the location on the experimental bench. The top end then plugs
into a 4-pin Amphenol mating connector and relays information to the data logger via the
appropriate wiring. Figure 3.4 shows a flow meter front and cross-section views.
Figure 3. 4 – Flow meter, front and cross-section views.
3.1.3 Thermocouples
In order to monitor and collect coolant temperature data, K-type thermocouples were
used on the experimental flow benches, with the male end tapped either into an in-line plumbing
fitting or directly into the part (i.e. engine block) and the female end extended to the data logger.
28 Figure 3. 5 – Thermocouple, before and after bench installation.
3.1.4 Custom Fittings
Custom fitting were machined and embedded in the coolant plumbing lines to provide
space for pressure and thermocouple taps. Furthermore, these individually designed fittings
minimize change in inner diameter throughout the plumbing and ultimately reduce any
obstruction of coolant flow. Figure 3.6 shows examples of custom fittings that were machined to
accommodate a variety of instrumentation and plumbing dimensions.
29
3.2Data Collection
3.2.1 Wiring and Connections
A Campbell Scientific CR5000 data logger was mounted to each flow bench. This data logger
is equipped with 28 single ended channels, (or) 14 differential channels, or a combination of both.
Flow meters and pressure sensors were wired sequentially into single ended channels, using 24
AWG 4 conductor, Belden shielded instrumentation cable. In addition, flow meters were wired
through a transmitter then through a terminal block before the connection was made at the data
logger. Thermocouples were wired into differential channels. Figure 3.7 shows the tachometer
and data logger configuration mounted to the front of the flow bench.
Figure 3. 7 – Bench mounted tachometer display and data logger.
A remote optical tachometer sensor was mounted to the engine front cover by a custom bracket
and its laser aimed appropriately at the water pump (Figure 3.8) using a small piece of reflective
tape. As the pump rotates, a laser signal is fed directly back to the panel tachometer, then to the
data logger, as an RPM read out.
30
In order to supply each sensor with 12V power, terminal blocks were required to be mounted to
the engine stand using din rail (Figure 3.9). For every 10 terminal blocks, 9 can serve as power
supplies for sensors, while 1 needs to provide 12V power from the data logger. The ends of each
terminal block set should be capped with an end cap. In order to tie each set of 10 terminal blocks
together, a jumper screw was used.
Figure 3. 9 – Bench mounted terminal blocks and flow transmitter.
Both flow meters and pressure sensors required Amphenol mating connectors for wiring. The
flow transmitters originally came with two open ended grommets on adjacent sides, however
these were replaced with Grip-Tite grommets to create a barrier from any liquid entering the
transmitter in the case of spill/spray. The coolant lines were fixed with clamps at each component
and engine connection, as well as for each embedded piece of instrumentation and sight glass.
These served to seal the connection and prevent any coolant leaks (Figure 3.10). Hose clamps
should be non-perforated, so as to avoid cutting into the rubber hoses. Varying diameters were
required, depending on the diameter of the lines involved in the cooling circuit.
31
3.2.2 Data Programming Software
The laptop used for testing was equipped with the Campbell Scientific Logger Net
software. A program was written within the Logger Net software, under the built-in editor
function, for each flow bench specific to the number of sensors used during the test. Flow meters
and pressure sensors were wired sequentially into single ended channels. Each sensor comes
calibrated with a specific sensor range, and a scaling factor must be used to calculate the
32
3.3Single Component Flow Bench
The purpose of the single component flow bench is to investigate flow and pressure
characteristics across one component at a time, to cross-reference the data which is given by
suppliers, and validate the individual 1D models. It is important to develop and validate
component level models first before moving on to system level modelling. This flow bench is
equipped with a reservoir, immersion heater, electric motor, horizontal vane pump, inlet and
outlet plumbing, and a variety of mounting brackets to accommodate the specific component
under investigation. The components tested on the single component flow bench are listed
below:
- Radiator
- Heater core
- Transmission oil heater/cooler
- Engine oil heater/cooler
- Exhaust gas recirculation cooler
- Hot bottle
33
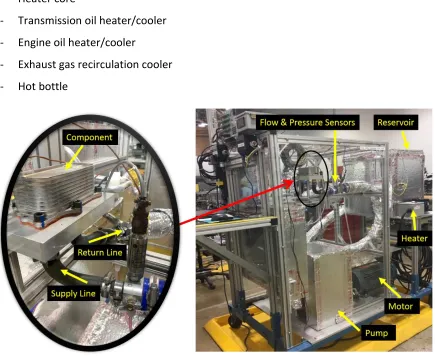
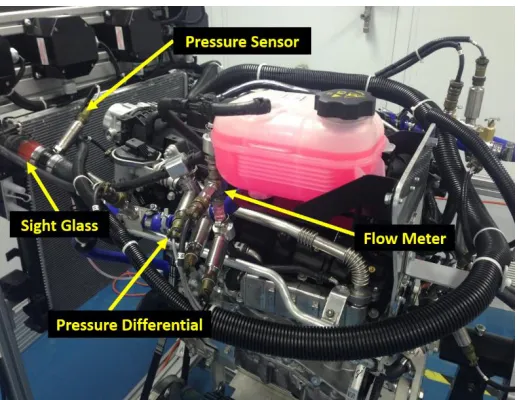
Figure 3.11 shows the single component flow bench, with a close up on a mounted component,
and labels for key parts in the system.
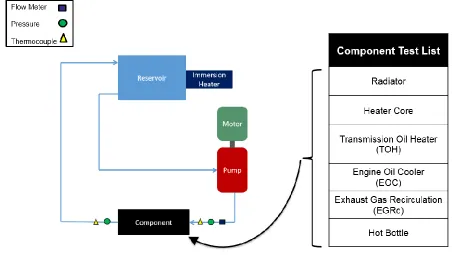
3.3.1 Flow Schematic
This flow schematic indicates the layout of the single component flow bench and direction
of flow through the component (Figure 3.12). A common set of supply/return plumbing lines
were used across all components, however each component has a different inlet/outlet
diameter, and so a custom fitting is used for each to step down the plumbing line geometry. The
supply line was instrumented with a flow meter to record flow data into the component. Both
the supply and return lines are instrumented with pressure sensors to record the pressure drop
across the component, as well as a thermocouple on each line to record temperature and ensure
no heat is being lost.
Figure 3. 12 – Single component flow bench scehmatic.
3.3.2 Run Set Up
The reservoir holds 25 gallons of liquid coolant at ambient temperature, which has been
fitted with an immersion coil heater to raise the temperature for simulating in-vehicle coolant
34
to mitigate heat loss and ensure the work done by the immersion heater is not lost to the ambient
air. This is the reason for the silver foil insulation covering the majority of the bench, to ensure
the heat remains absorbed in the coolant for verifying flow behaviour at elevated temperature.
The horizontal vane pump is powered via an electric motor, which is controlled via a variable
frequency drive (VFD) panel (Figure 3.13).
Figure 3. 13 – Single component flow bench reservoir and pump.
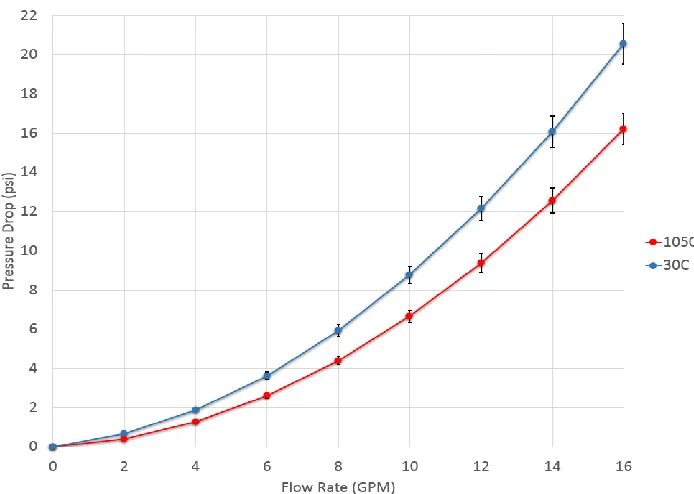
3.3.3 Single Component Data Collection
Data was collected for the following components and corresponding flow ranges to
represent the full sweep of coolant flow the component would experience in-vehicle. Each
component was tested at both 30ᵒC and 105ᵒC.
o Radiator: 0 to 50 GPM
o Heater Core: 0 to 15 GPM
o EOC: 0 to 12 GPM
o TOH: 0 to 16 GPM
o EGRc: 0 to 15 GPM
o Hot Bottle: 0 to 3 GPM
Based on these conditions, below are examples of experimental data collected across the heater
35
independent variable is inlet coolant flow rate, the dependent variable is pressure drop, and a
95% confidence interval is shown for each data point.
Figure 3. 14 – Heater core data collected on the single component flow bench.
![Figure 1. 1 – Engine heat rejection breakdown [1].](https://thumb-us.123doks.com/thumbv2/123dok_us/1341666.1167077/15.612.187.424.418.683/figure-engine-heat-rejection-breakdown.webp)
![Figure 2. 3 – General schematic for EGRc exhaust and coolant sides [8].](https://thumb-us.123doks.com/thumbv2/123dok_us/1341666.1167077/23.612.242.408.570.685/figure-general-schematic-for-egrc-exhaust-coolant-sides.webp)
![Figure 2. 9 – Water jacket block, gasket holes and head [15].](https://thumb-us.123doks.com/thumbv2/123dok_us/1341666.1167077/27.612.224.379.79.258/figure-water-jacket-block-gasket-holes-and-head.webp)
![Figure 2. 13 – Data exchange between 1D network model and 3D CFD model [23].](https://thumb-us.123doks.com/thumbv2/123dok_us/1341666.1167077/32.612.155.452.250.469/figure-data-exchange-d-network-model-cfd-model.webp)
![Figure 2. 15 – Simple 1D engine cooling model [25].](https://thumb-us.123doks.com/thumbv2/123dok_us/1341666.1167077/37.612.137.486.75.315/figure-simple-d-engine-cooling-model.webp)