Effect of Temperature on the Efficient of Solid
Oxide Fuel Cell
S. Jamwal1, H. Kaur2
M.Tech Student, Dept. of Electrical and Electronics Engineering, ARNI University, Himachal, India1 Assistant Professor, Dept. of Electrical and Electronics Engineering, ARNI University, Himachal, India2
ABSTRACT:Solid oxide fuel cells (SOFCs) are gaining prominence as power sources amongst other types of fuel cells due to their high electric energy efficiencies, their ability to integrate with other energy cycles in a hybrid system, fuel choice flexibility and low pollutant emissions. In the research work SIMULINK based dynamic modelling of solid oxide fuel cell is carried out. Various experiments were performed to evaluate the performance of the deigned SOFC model.The result from the developed models shows that the SOFCs give the best cell performance when operated at high temperatures. The study on the effect of integrating the SOFC in a three phase system showed high electrical efficiency.
KEYWORDS: SOFC, Dynamic, Temperature, Power, Current, Voltage.
I.INTRODUCTION
One of Renewable Energy Sources engender a modicum of greenhouse gases, and there is plenty of energy emanating from the sun, rivers or geothermal waters to cover human needs. There are, however, additionally some quandaries and inhibitions connected with these sources – the sun does not shine every day and its vigor is different depending on location, wind does not blow with the same vigor during the year and there is circumscribed accessibility for hydro and geothermal power depending on the location. An energy carrier is needed to store the electricity during excess engenderment so that it is yare to be used when the peak comes [1-5].
Solid oxide fuel cells (SOFC) are electrochemical devices that convert chemical energy of a fuel and oxidant directly into electrical energy. Since SOFCs produce electricity through an electrochemical reaction and not through a combustion process, they are much more efficient and environmentally benign than conventional electric power generation processes. Their inherent characteristics make them uniquely suitable to address the environmental, climate change, and water concerns associated with fossil fuel based electric power generation [7].
A planar SOFC consists of three bonded layers: a cathode, an anode, and an electrolyte separating the electrodes. Each electrode is a thin, porous, electronic (e-) conductor. Electrode porosity is required for gaseous diffusion between the electrode's outer surface and the electrode/electrolyte interface. The electrolyte is a thin, fully dense oxygen ion (O=) conductor, but not an electronic conductor. The electrolyte needs to be fully dense to prevent gaseous fuel from contacting air and burning [8-10].
The SOFC is a high-temperature operating fuel cell which has high potential in stationary applications. The efficiency of SOFC is in the range of 45-50% and when integrated with a gas turbine, it reaches a high efficiency of 70-75%. It is a solid-state device that uses an oxide ion-conducting non-porous ceramic material as an electrolyte. Since the electrolyte is a solid, the cells do not have to be constructed in the plate-like configuration typical of other fuel cell types. Corrosion is less compared to MCFC and no water management problems as in PEMFCs due to the solid electrolyte. High temperature operation removes the need for a precious-metal catalyst, thereby reducing the cost. It also allows SOFCs to reform fuels internally, which enables the use of a variety of fuels and reduces the cost associated with adding a reformer to the system [11-15].
(yttria stabilized zirconia). The anode used is nickel-zirconia cermet and the cathode is a strontium doped lanthanum manganite. The use of ceramic materials increases the cost of SOFCs. High operating temperature requires stringent materials to be used which further drives up the cost. Research is being carried out to reduce the operating temperature and use less stringent materials.
Reduction of temperature improves the starting time, cheaper materials can be used, durability and robustness can be increased. Intermediate-temperature SOFCs cannot be used for all applications. Higher temperature is required for fuel cell micro-turbine hybrid systems. However, for smaller systems intermediate temperature SOFCs would be ideal [57-58].
Since SOFCs have fuel-flexibility, the input to the anode can be hydrogen, carbon monoxide or methane. Hydrogen or carbon monoxide may enter the anode. At the cathode, electrochemical reduction takes place to obtain oxide ions. These ions pass through the electrolyte layer to the anode where hydrogen is oxidized to obtain water. In case of carbon monoxide, it is oxidized to carbon dioxide [16-20].
2
2
4
2
O
e
O
2
2 2
2
H
O
H O
e
2 2 2 2
H
O
CO
H O
CO
Hydrogen is the fuel that has been used in this analysis. Operating voltage (Vfc) ofthe fuel cell at a current I is obtained by applying the Nernst’s equation and taking thelosses into account is shown in equation
fc act conc
V
E V
V
rI
1/ 2 2 2
2
.
(
2
o
RT
pH pO
E
N E
F
pH O
E – Reversible open circuit voltage (V)
Eo – Standard reversible cell potential (V)
pi – Partial pressure of species i (Pa)
Vact – Drop due to activation loss (V)
Vconc – Drop due to concentration loss (V)
r – Internal resistance of stack (Ω)
I – Stack current (A)
N – Number of cells in stack
R – Universal gas constant (J/ mol K)
T – Stack temperature (K)
F – Faraday’s constant (C/mol) 2
2
2
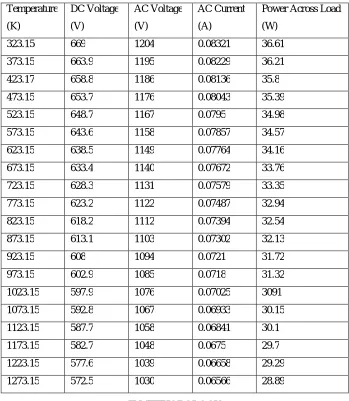
Table 1 Effect of temperature on electrical parameter with RLC type impedance
Temperature
(K)
DC Voltage
(V)
AC Voltage
(V)
AC Current
(A)
Power Across Load
(W)
323.15 669 1204 0.08321 36.61
373.15 663.9 1195 0.08229 36.21
423.17 658.8 1186 0.08136 35.8
473.15 653.7 1176 0.08043 35.39
523.15 648.7 1167 0.0795 34.98
573.15 643.6 1158 0.07857 34.57
623.15 638.5 1149 0.07764 34.16
673.15 633.4 1140 0.07672 33.76
723.15 628.3 1131 0.07579 33.35
773.15 623.2 1122 0.07487 32.94
823.15 618.2 1112 0.07394 32.54
873.15 613.1 1103 0.07302 32.13
923.15 608 1094 0.0721 31.72
973.15 602.9 1085 0.0718 31.32
1023.15 597.9 1076 0.07025 3091
1073.15 592.8 1067 0.06933 30.15
1123.15 587.7 1058 0.06841 30.1
1173.15 582.7 1048 0.0675 29.7
1223.15 577.6 1039 0.06658 29.29
1273.15 572.5 1030 0.06566 28.89
II.METHODOLOGY
connected to the output. In experiment II, temperature of the fuel cell was varied and the output power was measured and finally in experiment III, load was varied and the output current and power were measured.
III.RESULTS AND DISCUSSION
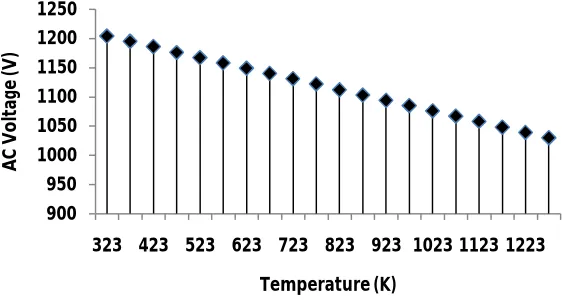
The simulation results consist of the fuel cell and dependencyon temperature of the system.Temperature is an important factor that determines the efficiency of the solid state devices performance. In this experiment temperature was varied with 600 fuel cell stack and contact load at the output. Table 1 shows the tabulated output electrical parameter. Figure 2 to 5 shows the dc output voltage obtained at fuel cell, ac converted voltage, ac current passing through load and power delivered to the load respectively. It can be observed for the tabulated that the trend line in the values of electrical parameters decreases as the temperature is increases. But the deviation in the voltage levels are not that much prominent as the SOFC model is stable at high temperature also which can visualize from the graphs. The maximum value of electrical parameter obtained at 373 K are dc voltage of 669 V, rms ac voltage of 1204 V, rms ac current of 0.08321 A, and output power of 36.61 W. Minimum value of electrical parameter obtained at 1273 K are dc voltage of 572.5 V, rms ac voltage of 1030 V, rms ac current of 0.06566 A, and output power of 28.89 W.
Fig. 2 variation in dc voltage with change in temperature.
Fig. 3 Variation in output RMS ac voltage with change in temperature.
520 540 560 580 600 620 640 660 680
323 423 523 623 723 823 923 1023 1123 1223
D
C
V
o
lt
ag
e
(V
)
Temperature (K)
900 950 1000 1050 1100 1150 1200 1250
323 423 523 623 723 823 923 1023 1123 1223
A
C
V
o
lt
ag
e
(V
)
Fig. 4 Variation in output RMS ac current with change in temperature.
Fig. 5Variation in output power with change in temperature.
IV.CONCLUSION
The main contribution of this thesis to the field of the design and operation of SOFC systems. The presented design and system components demonstrated to be technically feasible and can be utilized in the future to develop commercial systems. Various experiments were carried out to effectively demonstrate the variation in electrical parameters such as dc voltage, ac voltage, ac current, and power with change in system temperature.In second set of experiment effect of temperature was computed on the electrical parameters. Since the semiconductor electronic components depends upon the temperature and with each one degree Celsius rise in temperature voltage also varies thus the output parameters of the system decreases as the temperature is increased.
REFERENCES
[1] C. Wang, and M. H. Nehrir, “Short-time Overloading Capability and DistributedGeneration Applications of Solid Oxide Fuel Cells,” accepted for IEEE Trans.Energy Conversion September 15, 2006.
[2] F. Jurado, J. R. Saenz, and L. Fernandez, “Neural Network Control of Grid-Connected Fuel Cell Plants for Enhancement of Power Quality,” IEEE Proc.Power Tech Conf., vol. 3, Issue 7, June 2003, Bologna, Italy.
[3] M. C. Chandorkar, M. D. Divan, and R. Adapa, “Control of Parallel ConnectedInverters in Standalone AC Supply Systems,” IEEE Trans. Industry Applications,vol. 29, Issue 1, pp. 136-143, January 1993.
[4] K. Ro, and S. Rahman, “Two-Loop Controller for Maximizing Performance of aGrid-Connected Photovoltaic-Fuel cell Hybrid Power Plant,” IEEE Trans. EnergyConversion, vol. 13, Issue 3, pp. 276-281, September 1998.
[5] R. Lasseter, “Dynamic Models for Micro-turbines and Fuel Cells,” IEEE-PESSummer meeting, vol.2, pp. 761-766, July 2001.
[6] C. Wang, and M. H. Nehrir, “Control of PEM Fuel Cell Distributed GenerationSystems,” IEEE Trans. Energy Conversion, vol. 21, Issue 2, pp. 586-595, June2006.
[7] F. Blaabjerg, Z. Chen, and S. B. Kjaer, “Power Electronics as Efficient Interfacein Dispersed Power Generation Systems,” IEEE Trans. Power Electronics, vol.19, Issue 5, September 2004.
[8] G. K. Anderson, C. Klumpner, S. B. Kjaer, and F. Blaabjerg, “A New PowerInverter for Fuel Cells” IEEE Conf. Power Electronics Specialists, vol. 2, Issue 2,pp. 727-733, June 2002.
[9] C. Liu, T. Nergaard, L. Leslie, J. Ferrell, X. Huang, T. Shearer, J. Reichl, J. Lai,and J. Bates, “Power Balance Control and Voltage Conditioning for Fuel CellConverter with Multiple Sources,” IEEE Conf. Power Electronics Specialists, vol.4, pp. 2001-2006, June 2002. [10] N. Mohan, T. M. Undeland, and W. P. Robbins, “Power Electronics, Converters,Applications and Design,” 2nd Edition, John Wiley & Sons. [11] Y. LEE, C. YANG, C. YANG, S. PARK, and S. PARK, “Optimization of Operating Conditions for a 10 kW SOFC System,” Transactions of
the Korean hydrogen and new energy society, vol. 27, no. 1, pp. 49–62, Feb. 2016.
[12] A. Sinha, D. N. Miller, and J. T. S. Irvine, “Development of novel anode material for intermediate temperature SOFC (IT-SOFC),” J. Mater. Chem. A, vol. 4, no. 28, pp. 11117–11123, 2016.
[13] J. Padulles, G. W. Ault, and J. R. McDonald, “An Approach to the Dynamic Modeling of Fuel Cell Characteristics for Distributed Generation Operation,” IEEE- PES Winter Meeting, vol. 1, Issue 1, pp. 134-138, January 2000.
[14] S. Pasricha, and S. R. Shaw, “A Dynamic PEM Fuel Cell Model,” IEEE Trans. Energy Conversion, vol. 21, Issue 2, pp. 484-490, June 2006. [15] P. R. Pathapati, X. Xue, and J. Tang, “A New Dynamic Model for Predicting Transient Phenomena in a PEM Fuel Cell System,” Renewable
Energy, vol. 30, Issue 1, pp. 1-22, January 2005.
[16] C. Wang, and M. H. Nehrir, “Dynamic Models and Model Validation for a PEMFuel Cells Using Electrical Circuits,” IEEE Trans. Energy Conversion, vol. 20,Issue 2, pp. 442-451, June 2005.
[17] D. J. Hall, and R. G. Colclaser, “Transient Modeling and Simulation of a TubularSolid Oxide Fuel Cell,” IEEE Trans. Energy Conversion, vol. 14, Issue 3, pp.749-753, September 1999.
[18] E. Achenbach, “Three-dimensional and Time-dependent Simulation of a PlanarSOFC Stack,” J. Power Sources, vol. 49, Issue 1-3, pp. 333-348, April 1994.
[19] E. Achenbach, “Response of a Solid Oxide Fuel Cell to Load Change,” J. PowerSources, vol. 57, Issue 1, pp. 105-109, September 1995. [20] K. Sedghisigarchi, and A. Feliachi, “Dynamic and Transient Analysis of PowerDistribution Systems with Fuel Cell-Part I: Fuel-Cell Dynamic
Model,” IEEETrans. Energy Conversion, vol. 19, Issue 2, pp. 423-428, June 2004.
[21] C. Wang, and M. H. Nehrir, “A Physically-Based Dynamic Model for Solid OxideFuel Cells,” accepted for IEEE Trans. Energy Conversion September 15, 2006.