O R I G I N A L R E S E A R C H
A Molecular Epidemiological Analysis Of
Programmed Cell Death Ligand-1 (PD-L1) Protein
Expression, Mutations And Survival In Non-Small
Cell Lung Cancer
This article was published in the following Dove Press journal: Cancer Management and Research
Matthew B Schabath, 1,2 Tapashi B Dalvi,3Hongyue A Dai,4 Alan L Crim, 4 Anita Midha,5 Norah Shire,3 Nicholas T Gimbrone,1 Jill Walker,6 Danielle M Greenawalt,7 David Lawrence,8 James R Rigas, 9 Robert Brody,9 Danielle Potter,9 Naveen S Kumar,4 Shane A
Huntsman,4Jhanelle E Gray2
1Department of Cancer Epidemiology, H.
Lee Moffitt Cancer Center and Research
Institute, Tampa, FL, USA;2Department
of Thoracic Oncology, H. Lee Moffitt
Cancer Center and Research Institute,
Tampa, FL, USA;3Oncology R&D,
AstraZeneca, Gaithersburg, MD, USA;
4M2Gen, Tampa, FL, USA;5Department
of Personalised Healthcare and Biomarkers, AstraZeneca, Cambridge,
UK;6Department of Precision Medicine
Oncology, AstraZeneca, Cambridge, UK;
7Department of iMED Oncology
Informatics, AstraZeneca, Waltham, MA,
USA;8Department of Global Medicines
Development, AstraZeneca, Cambridge,
UK;9Department of Global Medical
Affairs Oncology, AstraZeneca, Gaithersburg, MD, USA
Purpose:To characterize programmed cell death ligand-1 (PD-L1) expression in relation to survival and gene mutation status in patients with advanced NSCLC. The study also explored the influence of tumor mutational burden (TMB) on PD-L1 expression and patient characteristics.
Patients and methods: Adult patients with histologically or cytologically documented Stage IIIB/Stage IV/recurrent/progressive NSCLC, Eastern Cooperative Oncology Group performance status 0 to 3, and >2 lines of prior systemic treatment regimens were included in this retrospective analysis. Patients were treated from 1997 to 2015 at H. Lee Moffitt Cancer Center and Research Institute, Tampa, or at 7 community centers across the United States. PD-L1 expression level was determined using the VENTANA PD-L1 (SP263) Assay.EGFR
and KRAS mutation status and ALK rearrangements were determined by targeted DNA sequencing; these were obtained from clinical records where targeted DNA sequencing was not performed. TMB was calculated as the total number of somatic mutations per sample.
Results: From a total of 136 patients included in the study, 23.5% had tumors with high PD-L1 expression (≥25%). There were no significant differences in patient characteristics, overall survival (OS), and progression-free survival (PFS) between patients with high PD-L1 expression (median OS: 39.5 months; median PFS: 15.8 months) vs low PD-L1 expression (<25%; median OS: 38.1 months; median PFS: 18.6 months). PD-L1 expression level correlated (P=0.05) with TMB and was consistent with The Cancer Genome Atlas data.
Conclusion: In this retrospective analysis, survival outcomes of patients with advanced NSCLC were comparable by PD-L1 expression level.EGFRandKRASmutation status were not found to be significantly associated with PD-L1 expression level, while TMB was weakly associated with PD-L1 expression level. Overall, PD-L1 expression level was not observed to be an independent prognostic biomarker in this cohort of patients with advanced NSCLC treated with chemotherapy.
Keywords: non-small cell lung cancer, patient outcomes, tumor mutational burden, prognostic biomarker
Introduction
In the United States (US), lung cancer is the second most common cancer and the
leading cause of cancer-related deaths in both sexes.1 Despite considerable
improvement in patient survival for many cancers over the last decades, there has been little improvement in the 5-year survival rates for lung cancer. The 5-year Correspondence: Matthew B Schabath
H. Lee Moffitt Cancer Center and
Research Institute, Tampa, FL 33612, USA Tel +1 813 745 4150
Fax +1 813 745 6525
Email matthew.schabath@moffitt.org
Cancer Management and Research
Dove
press
open access to scientific and medical research
Open Access Full Text Article
Cancer Management and Research downloaded from https://www.dovepress.com/ by 118.70.13.36 on 20-Aug-2020
relative survival rate for all lung cancers (ie, non-small cell lung cancer [NSCLC] and small cell lung cancer
com-bined) is 18%.1Among NSCLCs, the 5-year relative
sur-vival rates are 26%, 10%, and 1% for Stages IIIB, IVA,
and IVB, respectively.2
Immuno-oncology (IO), especially immune checkpoint inhibition therapy (immunotherapy), an emerging therapeu-tic area, may hold the key to improving patient survival in the early and/or advanced stages of NSCLC in patients with
metastatic disease.3–5Immunotherapy involves recognition
and eradication of tumors by restoration of the host’s
immune system capacity.6 The programmed cell death-1/
programmed cell death ligand-1 (PD-1/PD-L1) pathway is an important checkpoint used by tumor cells to inhibit
antitumor responses.3–9Blocking the PD-1/PD-L1 pathway
has been shown to reverse the formation of immunosup-pressive tumor microenvironment and enhance endogenous
antitumor immune responses.7 Several anti–PD-1/PD-L1
antibodies are approved for the treatment of NSCLC, including nivolumab, pembrolizumab, durvalumab, and atezolizumab.8–10
In addition to PD-L1 expression, NSCLCs are also characterized by genetic alterations in oncogenes and tumor suppressor genes critical to tumor growth and
survival that can be exploited using specific targeted
therapy.11 As many lung cancers harbor somatic
muta-tions and/or alteramuta-tions, targeted therapy is important to
improve outcomes of this disease.10Pro-oncogenic
muta-tions in NSCLC can involve components of the mitogen-activated protein (MAP) kinase pathway, such as Kirsten
rat sarcoma viral oncogene (KRAS) and B-Raf
proto-oncogene (BRAF) mutations.11 Presently, there are US
Food and Drug Administration (FDA)-approved therapies targeting genetic mutations, such as epidermal growth
factor receptor (EGFR) mutations and anaplastic
lym-phoma kinase (ALK) gene rearrangements.11–18 High
tumor mutational burden (TMB) in diverse cancers, including NSCLC, has been associated with a high prob-ability of response to immunotherapy, particularly with PD-1/PD-L1/cytotoxic T-lymphocyte-associated
antigen-4 (CTLA-antigen-4) blockade.19–21 Based on these observations,
future clinical trials will incorporate TMB as a biomarker for single-agent immunotherapies, including checkpoint inhibitors.19
Limited retrospective, noninterventional studies have previously assessed the co-occurrence of PD-L1
expres-sion with somatic mutations and gene alterations.22These
data could provide greater understanding of how genomic
aberrations affect predictive ability for patient prognosis. The aim of this retrospective study was to characterize PD-L1 expression and its relationship to common somatic
mutations and alterations associated with NSCLC (EGFR,
KRAS, and ALK), and to correlate clinical outcomes to
PD-L1 expression levels in patients with advanced
NSCLC treated with≥2 lines of chemotherapy.
Materials And Methods
Patients
This study included 136 patients with NSCLC treated
between 1997 and 2015 at the H. Lee Moffitt Cancer
Center and Research Institute, Tampa, Florida, or from 7 community centers throughout the state of Florida and
across the United States as part of Moffitt’s Total Cancer
Care (TCC®) protocol.23 TCC is a multi-institutional
observational study of patients diagnosed with cancer that prospectively collects patient data and tissue samples for research purposes. The study included adult patients
aged ≥18 years with histologically or cytologically
docu-mented Stage IIIB/Stage IV/recurrent/progressive NSCLC and an Eastern Cooperative Oncology Group (ECOG)
performance status 0 to 3. All patients had formalin-fixed
paraffin-embedded tissue (FFPET) in sufficient amounts to
complete ≥1 test for PD-L1 and gene mutations. All
tumors collected under the TCC protocol are
microscopi-cally evaluated by a qualified Anatomic Pathologist and
subsequently macro-dissected to enrich for percent tumor
nuclei. Specifically, the TCC protocol aims to enrich
per-cent tumor nuclei to ≥60% by removing stromal and
normal tissue and reduce necrotic tissue to <20%.
Patients who received≥2 prior systemic treatment
regi-mens for NSCLC were included in this study. Prior
plati-num-containing adjuvant, neoadjuvant, or definitive
chemoradiation therapy administered for locally advanced
disease was considered first-line therapy only if recurrent
(local or metastatic) disease developed≤6 months of
com-pleting therapy. Additionally, patients who experienced dis-ease progression or recurrence after a platinum-based
chemotherapeutic regimen and patients who received ≥1
additional systemic therapy (maintenance therapy following platinum doublet-based chemotherapy was not considered a separate regimen of therapy) were included for survival analysis. All patients with recurrent disease had disease
progression ≥6 months after a subsequent platinum-based
chemotherapeutic regimen was administered to treat the recurrence. All patients were immunotherapy-naïve. The
Schabath et al Dovepress
Cancer Management and Research downloaded from https://www.dovepress.com/ by 118.70.13.36 on 20-Aug-2020
inclusion/exclusion criteria for the survival analysis cohort
closely matched the ATLANTIC clinical trial.24
The protocol of this study was approved by the Chesapeake Institutional Review Board (Columbia, MD). The study was conducted in accordance with the ethical principles that have their origin in the Declaration of Helsinki and was consistent with Good Clinical Practice guidelines and applicable regulatory requirements. Written informed consent was obtained from all patients for their participation in the study.
PD-L1 Testing
The PD-L1 expression in FFPET samples was assessed by
immunohistochemistry (IHC) performed using the
VENTANA PD-L1 (SP263) Assay (Ventana Medical
Systems, Inc., Tucson, AZ, USA) per the manufacturer’s
guidelines.25,26High expression of PD-L1 was defined as
≥25% of the tumor cells with membrane positivity for
PD-L1 at any intensity. Low expression of PD-L1 was
defined as <25% of the tumor cells with membrane
posi-tivity for PD-L1 at any intensity.
Targeted DNA Sequencing
Targeted DNA sequencing was performed to assessEGFR
and KRAS mutation status and ALK fusion from FFPET
samples of 88 patients. Where DNA sequencing was not
performed, EGFR, KRAS, and ALK status were obtained
from electronic clinical records where available.
DNA was extracted from FFPET using Qiagen
DNeasy® Blood and Tissue Kits (QIAGEN, Valencia,
CA, USA) per manufacturer’s instructions, quantified
using Nanodrop 2000 (Thermo Fisher Scientific,
Wilmington, DE, USA), and its integrity was assessed by electrophoresis. Extracted tumor genomic DNA was
frag-mented into 200 to 300 base pairs (bp) using a Covaris®
M220 focused-ultrasonicator (Covaris, Woburn, MA, USA). In brief, cell-free DNA (cfDNA) or sheared tissue DNA was enriched with end-repairing, A-tailing, adapter
ligation, and size selection using Agencourt® AMPure®
XP beads (Beckman Coulter, Indianapolis, IN, USA). Libraries were then subjected to ligation-mediated
poly-merase chain reaction (LM-PCR) amplification and purifi
-cation and hybridized to the Roche NimbleGen SeqCap®
EZ Exome probe (Roche NimbleGen, Madison, WI,
USA). Targeted DNA profiling was performed using the
TumorCare panel designed by BGI Genomics (Cambridge, MA, USA) and manufactured by Roche NimbleGen (Roche NimbleGen, Madison, WI, USA). The panel
detects genomic alterations at extremely high coverage in 1053 cancer-related genes spanning a 4.6 Mb region of the genome, including base substitutions, insertions and dele-tions, copy number alteradele-tions, and rearrangements (Table S1). Both noncaptured and captured LM-PCR pro-ducts were subjected to quantitative polymerase chain reaction (qPCR) to estimate the magnitude of enrichment. The enriched libraries were sequenced on Illumina HiSeq 4000 (Illumina, San Diego, CA, USA) next-genera-tion sequencing platforms independently to ensure that each sample achieved the desired average fold-coverage. The delivered targeted DNA sequencing had an average
coverage of 512X across all samples. Raw image files
were processed by Illumina base-calling software 1.7 for base calling with default parameters and the sequences for all patients were generated as 100 bp paired-end reads.
FASTQ files were aligned to build 37 genes to reference
sequence Human Genome version 19 (hg19) using
Burrows-Wheeler Aligner (BWA) with optimized
parameters.27 All data processing and secondary analysis
were performed using Bcbio-Nextgen best-practice pipe-line (https://github.com/chapmanb/bcbio-nextgen). Variant
calling was performed using VarDict,28and variant effects
were annotated using SnpEff.29Variants werefiltered at an
allele frequency threshold of 5%, a minimum sequencing depth of 5X, and a minimum variant depth of 3X. Putative sequencing artifacts were removed based on a
cohort frequency <75%, and germline variants were fi
l-tered by removing variants identified in the Single
Nucleotide Polymorphism Database (dbSNP; version138), 1000 Genome project, while keeping variants if they were
found in ClinVar or COSMIC.30–32
Using the resulting processed variant information from the aforementioned pipeline above, TMB was calculated as the total number of somatic mutations per sample, including all nonsynonymous mutations and indels.
Statistical Analysis
The primary covariates were PD-L1 expression and
muta-tion status of EGFR, KRAS, and ALK determined by
tar-geted DNA sequencing. The prevalence of PD-L1
expression ≥25% and <25% was compared in subgroups
based on age, sex, smoking history, race, ethnicity,
histol-ogy, tumor stage, EGFR and KRAS mutation status, and
ALK rearrangements using the χ2/Fisher’s exact test and
Monte-Carlo estimation method. The Wilcoxon 2-sample test was used for testing differences in median age and the
Student’s t-test was used for testing differences in mean
Dovepress Schabath et al
Cancer Management and Research downloaded from https://www.dovepress.com/ by 118.70.13.36 on 20-Aug-2020
age. Analyses were also conducted comparing demo-graphic subgroups by TMB that was dichotomized at the
median value. Overall survival (OS) was defined as the
time from index date (time of diagnosis or time of therapy initiation) to death due to any cause or last follow-up.
Progression-free survival (PFS) was defined as the time
from index date to the date the patient changed therapy
due to first documented disease progression or death due
to any cause. Survival analyses were performed using Kaplan-Meier survival curves and log-rank test statistics.
PD-L1 expression level ≥25% was used as the reference
group.
Results
Patient Characteristics
A total of 136 patients with NSCLC were included in this study (Table 1); the mean (standard deviation [SD]) age of patients at diagnosis was 61.9 (9.3) years, and 52% were male (n=70). The most frequent (>70% incidence) histo-logical diagnosis was adenocarcinoma of the lung (71.3%). Overall, 113 (83.1%) patients were smokers and 17 (12.5%) patients were nonsmokers. Information on smoking history was not available for 6 (4.4%) patients. Overall, 53 (39.0%) patients were diagnosed with Stage IV disease, 29 (21.3%) patients did not have metastatic dis-ease, and 39 (28.7%) patients had received 4 lines of therapy. No patients were treated with immunotherapy. The ECOG performance status was 0 in 72 (52.9%) patients, 1 in 45 (33.1%) patients, 2 in 9 (6.6%) patients, and 3 in 2 (1.5%) patients. Information on performance status was missing for 8 (5.9%) patients.
PD-L1 And Tissue Status
The mean (SD) sample age (number of years of sample storage) was 7.2 (2.8) years. Overall, 84.2% of the tumor samples that were used for PD-L1 testing were collected by surgical resection and 15.8% of the tumor samples were biopsy samples. Moreover, 63.3% of the tumor samples were collected (biopsy or resection) prior to any treatment (ie, chemotherapy-naïve) and 36.7% of the tumor samples were collected (biopsy or resection) post-any treatment
(defined as any chemotherapy following surgical resection
or biopsy); 59% of the tumor samples tested involved primary tissue and 41% of the tumor samples were from
metastatic tissue. There was no significant difference in
PD-L1 expression level by timing of sample collection (prior to any treatment vs post-any treatment; P=0.532)
and no significant difference in PD-L1 expression level by
tissue type (primary vs metastatic; P=0.836).
PD-L1 Expression And Survival
High expression of PD-L1 (≥25%) was observed in 23.5%
of the patients. Overall, there were no statistically signifi
-cant differences in patient characteristics by PD-L1
expression level (Table 1). There was no significant
asso-ciation between PD-L1 expression level and OS (log-rank
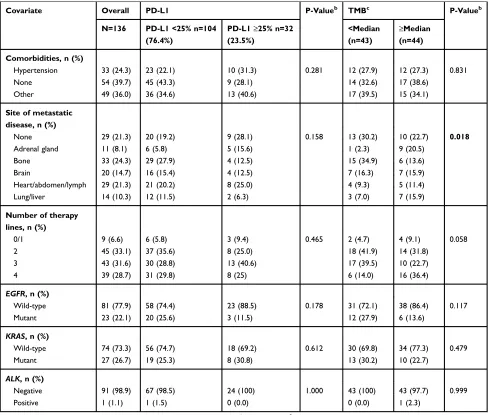
test, P=0.968; Figure 1A) or PFS (log-rank test, P=0.714;
Figure 1B). The percentiles of survival times (third
quar-tile, median, andfirst quartile) and survival rates by PD-L1
expression level at 6, 12, 18, and 24 months were largely similar (Table 2). Median OS was 38.1 months from diagnosis for the PD-L1 <25% group and 39.5 months
for the PD-L1 ≥25% group (Table 2). Median PFS was
18.6 months for the PD-L1 <25% group and 15.8 months
for the PD-L1 ≥25% group (Table 2). Similar OS results
by PD-L1 expression level were observed for patients
receiving second-line (log-rank test, P=0.523; Figure 1C)
and third-line systemic therapies (log-rank test, P=0.607;
Figure 1D). We also utilized a PD-L1 ≥90% cut-off to
examine OS, including OS from the initiation of second-and third-line therapy, second-and PFS by PD-L1 expression level
(Figures S1–S4).
Mutation Analysis And TMB
Targeted DNA sequencing was performed on a 4 Mb region of the genome capturing 1,053 cancer-associated genes, including known fusion events (Table S1). On average, 70 million reads were mapped per sample, with 73% of reads on target; 98% of the targeted regions achieved 50X coverage and 94% achieved 100X coverage.
Our primary analysis focused onEGFR andKRAS
muta-tion status andALK fusion. We identified 18 patient
sam-ples withEGFRmutations; 6 patient samples with L858R
mutations, 7 samples with exon 19 deletions, and 1 tumor
sample with both L858R and T790M mutations. KRAS
mutations were found in 23 tumor samples and were
mutually exclusive of EGFR mutations. An ALK
-echino-derm microtubule-associated protein-like 4 (EML4) fusion
was only identified in 1 sequenced tumor sample and was
mutually exclusive ofEGFR andKRAS mutations. There
were no significant differences in PD-L1 expression for
the distributions ofEGFRandKRASmutations. Given that
only 1ALKfusion was identified, further statistical
analy-sis was not performed for this gene.
Schabath et al Dovepress
Cancer Management and Research downloaded from https://www.dovepress.com/ by 118.70.13.36 on 20-Aug-2020
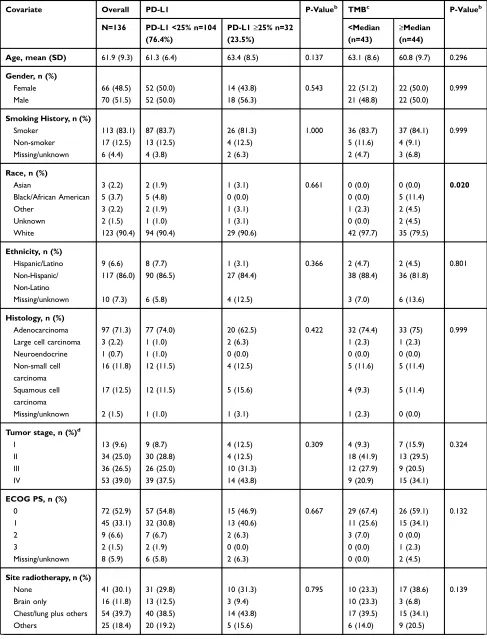
Table 1Patient Characteristics By PD-L1 Expression LevelaAnd By TMB
Covariate Overall PD-L1 P-Valueb TMBc P-Valueb
N=136 PD-L1 <25% n=104 (76.4%)
PD-L1≥25% n=32 (23.5%)
<Median (n=43)
≥Median (n=44)
Age, mean (SD) 61.9 (9.3) 61.3 (6.4) 63.4 (8.5) 0.137 63.1 (8.6) 60.8 (9.7) 0.296
Gender, n (%)
Female 66 (48.5) 52 (50.0) 14 (43.8) 0.543 22 (51.2) 22 (50.0) 0.999
Male 70 (51.5) 52 (50.0) 18 (56.3) 21 (48.8) 22 (50.0)
Smoking History, n (%)
Smoker 113 (83.1) 87 (83.7) 26 (81.3) 1.000 36 (83.7) 37 (84.1) 0.999
Non-smoker 17 (12.5) 13 (12.5) 4 (12.5) 5 (11.6) 4 (9.1)
Missing/unknown 6 (4.4) 4 (3.8) 2 (6.3) 2 (4.7) 3 (6.8)
Race, n (%)
Asian 3 (2.2) 2 (1.9) 1 (3.1) 0.661 0 (0.0) 0 (0.0) 0.020
Black/African American 5 (3.7) 5 (4.8) 0 (0.0) 0 (0.0) 5 (11.4)
Other 3 (2.2) 2 (1.9) 1 (3.1) 1 (2.3) 2 (4.5)
Unknown 2 (1.5) 1 (1.0) 1 (3.1) 0 (0.0) 2 (4.5)
White 123 (90.4) 94 (90.4) 29 (90.6) 42 (97.7) 35 (79.5)
Ethnicity, n (%)
Hispanic/Latino 9 (6.6) 8 (7.7) 1 (3.1) 0.366 2 (4.7) 2 (4.5) 0.801
Non-Hispanic/ Non-Latino
117 (86.0) 90 (86.5) 27 (84.4) 38 (88.4) 36 (81.8)
Missing/unknown 10 (7.3) 6 (5.8) 4 (12.5) 3 (7.0) 6 (13.6)
Histology, n (%)
Adenocarcinoma 97 (71.3) 77 (74.0) 20 (62.5) 0.422 32 (74.4) 33 (75) 0.999
Large cell carcinoma 3 (2.2) 1 (1.0) 2 (6.3) 1 (2.3) 1 (2.3)
Neuroendocrine 1 (0.7) 1 (1.0) 0 (0.0) 0 (0.0) 0 (0.0)
Non-small cell carcinoma
16 (11.8) 12 (11.5) 4 (12.5) 5 (11.6) 5 (11.4)
Squamous cell carcinoma
17 (12.5) 12 (11.5) 5 (15.6) 4 (9.3) 5 (11.4)
Missing/unknown 2 (1.5) 1 (1.0) 1 (3.1) 1 (2.3) 0 (0.0)
Tumor stage, n (%)d
I 13 (9.6) 9 (8.7) 4 (12.5) 0.309 4 (9.3) 7 (15.9) 0.324
II 34 (25.0) 30 (28.8) 4 (12.5) 18 (41.9) 13 (29.5)
III 36 (26.5) 26 (25.0) 10 (31.3) 12 (27.9) 9 (20.5)
IV 53 (39.0) 39 (37.5) 14 (43.8) 9 (20.9) 15 (34.1)
ECOG PS, n (%)
0 72 (52.9) 57 (54.8) 15 (46.9) 0.667 29 (67.4) 26 (59.1) 0.132
1 45 (33.1) 32 (30.8) 13 (40.6) 11 (25.6) 15 (34.1)
2 9 (6.6) 7 (6.7) 2 (6.3) 3 (7.0) 0 (0.0)
3 2 (1.5) 2 (1.9) 0 (0.0) 0 (0.0) 1 (2.3)
Missing/unknown 8 (5.9) 6 (5.8) 2 (6.3) 0 (0.0) 2 (4.5)
Site radiotherapy, n (%)
None 41 (30.1) 31 (29.8) 10 (31.3) 0.795 10 (23.3) 17 (38.6) 0.139
Brain only 16 (11.8) 13 (12.5) 3 (9.4) 10 (23.3) 3 (6.8)
Chest/lung plus others 54 (39.7) 40 (38.5) 14 (43.8) 17 (39.5) 15 (34.1)
Others 25 (18.4) 20 (19.2) 5 (15.6) 6 (14.0) 9 (20.5)
(Continued)
Dovepress Schabath et al
Cancer Management and Research downloaded from https://www.dovepress.com/ by 118.70.13.36 on 20-Aug-2020
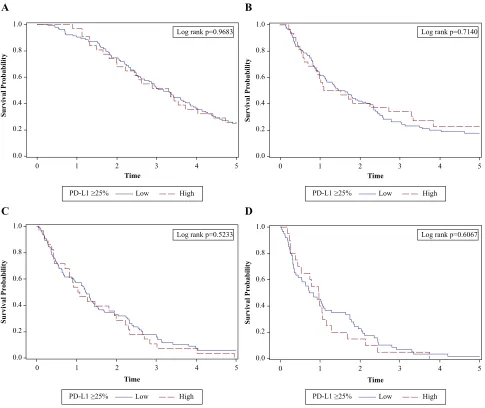
Figure 2Ashows the scatter plot of log TMB and the percentage of tumor cells with PD-L1 expression. PD-L1 expression, as a continuous covariate, was weakly but posi-tively associated with the number of somatic mutations
(Pearson’s correlation coefficient=0.22, P=0.05). Thisfi
nd-ing was replicated (Figure 2B) usnd-ing available data on lung
cancer samples in The Cancer Genome Atlas (TCGA).33
However, no significant difference was observed when
TMB was analyzed by PD-L1 expression ≥25%
(Figure 2C). When TMB was dichotomized at the median
value, it was significantly associated with race (P=0.020)
and site of metastatic disease (P=0.018;Table 1). With an
H-score positivity of >5%, 71.9% (64/89) of the patients
with EGFR mutations were found to have high PD-L1
expression compared with EGFR wild-type (P=0.067). In
patients with EGFRmutations treated with an EGFR–
tyr-osine kinase inhibitor (TKI), high PD-L1 expression did not have an impact on OS compared with patients with low PD-L1 expression (P=0.932).
For genes with a mutation frequency >20%, the distribu-tion of PD-L1 expression by mutadistribu-tion status (wild-type vs mutation) was assessed and survival analyses were per-formed. There were 8 genes with somatic mutation/variants
at a frequency≥20% (Table 3). Among these 8 genes, nuclear
Table 1(Continued).
Covariate Overall PD-L1 P-Valueb TMBc P-Valueb
N=136 PD-L1 <25% n=104 (76.4%)
PD-L1≥25% n=32 (23.5%)
<Median (n=43)
≥Median (n=44)
Comorbidities, n (%)
Hypertension 33 (24.3) 23 (22.1) 10 (31.3) 0.281 12 (27.9) 12 (27.3) 0.831
None 54 (39.7) 45 (43.3) 9 (28.1) 14 (32.6) 17 (38.6)
Other 49 (36.0) 36 (34.6) 13 (40.6) 17 (39.5) 15 (34.1)
Site of metastatic disease, n (%)
None 29 (21.3) 20 (19.2) 9 (28.1) 0.158 13 (30.2) 10 (22.7) 0.018
Adrenal gland 11 (8.1) 6 (5.8) 5 (15.6) 1 (2.3) 9 (20.5)
Bone 33 (24.3) 29 (27.9) 4 (12.5) 15 (34.9) 6 (13.6)
Brain 20 (14.7) 16 (15.4) 4 (12.5) 7 (16.3) 7 (15.9)
Heart/abdomen/lymph 29 (21.3) 21 (20.2) 8 (25.0) 4 (9.3) 5 (11.4)
Lung/liver 14 (10.3) 12 (11.5) 2 (6.3) 3 (7.0) 7 (15.9)
Number of therapy lines, n (%)
0/1 9 (6.6) 6 (5.8) 3 (9.4) 0.465 2 (4.7) 4 (9.1) 0.058
2 45 (33.1) 37 (35.6) 8 (25.0) 18 (41.9) 14 (31.8)
3 43 (31.6) 30 (28.8) 13 (40.6) 17 (39.5) 10 (22.7)
4 39 (28.7) 31 (29.8) 8 (25) 6 (14.0) 16 (36.4)
EGFR, n (%)
Wild-type 81 (77.9) 58 (74.4) 23 (88.5) 0.178 31 (72.1) 38 (86.4) 0.117
Mutant 23 (22.1) 20 (25.6) 3 (11.5) 12 (27.9) 6 (13.6)
KRAS, n (%)
Wild-type 74 (73.3) 56 (74.7) 18 (69.2) 0.612 30 (69.8) 34 (77.3) 0.479
Mutant 27 (26.7) 19 (25.3) 8 (30.8) 13 (30.2) 10 (22.7)
ALK, n (%)
Negative 91 (98.9) 67 (98.5) 24 (100) 1.000 43 (100) 43 (97.7) 0.999
Positive 1 (1.1) 1 (1.5) 0 (0.0) 0 (0.0) 1 (2.3)
Notes:aNot all variables will sum to 136 because of missing or unknown data.bThe Pearson’sχ2test using Monte-Carlo estimation method was used to compare distributions of patient characteristics.c
Median of mutational burden was 325 on original scale (log10 scale=2.512).d
Stage at time of tissue collection. Bold P-values are statistically significant.
Abbreviations:ALK, anaplastic lymphoma kinase; ECOG PS, Eastern Cooperative Oncology Group performance status;EGFR, epidermal growth factor receptor;KRAS, Kirsten rat sarcoma viral oncogene; PD-L1, programmed cell death ligand-1; SD, standard deviation; TMB, tumor mutational burden.
Schabath et al Dovepress
Cancer Management and Research downloaded from https://www.dovepress.com/ by 118.70.13.36 on 20-Aug-2020
receptor corepressor 2 (NCOR2) was mutated in 86 out of 87 samples, which may be an artifact due to a reference genome
issue. None of these genes were significantly associated with
PD-L1 expression level. Tumor protein p53 (TP53)
muta-tions were associated with significantly poorer OS from
primary diagnosis (P=0.002), OS from second-line therapy (P=0.014), PFS from primary diagnosis (P=0.021) and PFS from second-line therapy (P=0.041) (Table 3). RNA-binding
motif protein encoded on the X chromosome (RBMX)
muta-tions was associated with significantly worse OS from
sec-ond-line therapy (P=0.024) and KRAS mutations were
associated with PFS from second-line therapy (P=0.028) (Table 3).
Combinatorial And Strati
fi
ed Analyses By
Mutation Status And Histology
There were no significant associations for the
combinator-ial analyses of PD-L1 and mutation status on OS and PFS
(Figures S5–S8). Further analyses were performed
strati-fied by histology (nonsquamous NSCLC only) and
muta-tion status (EGFR wild-type/ALK non-rearranged, EGFR
mutant/ALK non-rearranged, KRAS wild-type/ALK
non-rearranged, and KRAS mutant/ALK non-rearranged), but
there were no statistically significant differences in
demo-graphics, clinical characteristics, and survival by PD-L1 expression level (data not shown).
1.0
B A
D C
Time 0.8
0.6
0.4
0.2
0.0
0 1 2 3 4 5
Log rank p=0.9683
Survival Pr
obability
Log rank p=0.7140
Log rank p=0.5233 Log rank p=0.6067
PD-L1 ≥25% Low High PD-L1 ≥25% Low High
PD-L1 ≥25% Low High PD-L1 ≥25% Low High
1.0
Time 0.8
0.6
0.4
0.2
0.0
0 1 2 3 4 5
Survival Pr
obability
1.0
Time 0.8
0.6
0.4
0.2
0.0
0 1 2 3 4 5
Survival Pr
obability
1.0
Time 0.8
0.6
0.4
0.2
0.0
0 1 2 3 4 5
Survival Pr
obability
Figure 1OS and PFS by PD-L1 expression level. (A) OS by PD-L1 expression≥25% showing no significant association between PD-L1 expression level and OS (log-rank test, P=0.968). (B) PFS by PD-L1 expression≥25% showing no significant association between PD-L1 expression level and PFS (log-rank test, P=0.714). (C) OS by PD-L1 expression≥25% showing no significant association between PD-L1 expression level and OS for patients receiving second-line therapies (log-rank test, P=0.523). (D) OS from third-line therapy by PD-L1 expression≥25% showing no significant association between PD-L1 expression level and OS for patients receiving third-line systemic therapies (log-rank test, P=0.607). X-axis is in years. The analyses are censored at 5 years.
Abbreviations:OS, overall survival; PD-L1, programmed cell death ligand-1; PFS, progression-free survival.
Dovepress Schabath et al
Cancer Management and Research downloaded from https://www.dovepress.com/ by 118.70.13.36 on 20-Aug-2020
Discussion
The current retrospective study revealed no significant
differences between patient characteristics or survival out-comes with low vs high PD-L1 expression level (<25% vs
≥25%). Moreover,EGFR, KRAS, andALKstatus were not
significantly associated with PD-L1 expression level;
how-ever, TMB was weakly but positively associated with PD-L1 expression level. As described by Shukuya and
Carbone,34 the response rates (RRs) of patients treated
with anti-PD-1/PD-L1 antibodies were low and averaged approximately 20% in unselected patients with NSCLC. Since patients in the current analysis were not treated with anti-PD-1/PD-L1 antibodies, conclusions about the predic-tive capabilities of the assay could not be substantiated.
To date, studies of various anti-PD-1/PD-L1 antibodies have utilized different companion diagnostic kits and algo-rithms to determine PD-L1 expression in tumor samples of patients with NSCLC. Durvalumab studies have utilized the VENTANA PD-L1 (SP263) Assay for PD-L1 detec-tion (25% cut-off), nivolumab studies have utilized the
Dako PD-L1 IHC 28–8 pharmDx to quantitate PD-L1
expression on tumor cell surface (1% cut-off), pembroli-zumab studies have utilized the Dako PD-L1 IHC 22C3 pharmDx (1% off for nonsquamous NSCLC, 50% cut-off for NSCLC), and atezolizumab studies have utilized the VENTANA PD-L1 (SP142) Assay (1% cut-off for
urothelial carcinoma and 50% for metastatic NSCLC).35
Furthermore, the Blueprint PD-L1 assay comparison pro-ject demonstrated that the VENTANA PD-L1 (SP263) Assay, Dako PD-L1 IHC 22C3 pharmDx, and Dako
PD-L1 IHC 28–8 pharmDx stained tumor cells in a highly
consistent manner, while the VENTANA PD-L1 (SP142)
Assay identified fewer tumor cells with PD-L1
expression.36 The current study utilized the VENTANA
Table 2OS And PFS By PD-L1 Expression Levela
Covariateb PD-L1 <25% PD-L1≥25%
OS
Total number of deaths 93 31
Median survival time, months 38.1 39.5
% survival at 6 months 0.98 1
% survival at 12 months 0.9 0.97
% survival at 18 months 0.87 0.81
% survival at 24 months 0.75 0.71
OS from initiation of second line
Total number of deaths 88 28
Median survival time, months 14.7 13
% survival at 6 months 0.72 0.72
% survival at 12 months 0.57 0.54
% survival at 18 months 0.39 0.4
% survival at 24 months 0.33 0.29
OS from initiation of third line
Total number of deaths 59 20
Median survival time, months 10 11.5
% survival at 6 months 0.62 0.71
% survival at 12 months 0.45 0.4
% survival at 18 months 0.35 0.2
% survival at 24 months 0.23 0.15
OS from initiation of fourth line
Total number of deaths 30 8
Median survival time, months 8.8 8.8
% survival at 6 months 0.68 0.63
% survival at 12 months 0.45 0.38
% survival at 18 months 0.38 0.38
% survival at 24 months 0.31 0.13
PFS
Total number of events 102 32
Median survival time, months 18.6 15.8
% survival at 6 months 0.83 0.81
% survival at 12 months 0.63 0.59
% survival at 18 months 0.5 0.5
% survival at 24 months 0.41 0.41
PFS from initiation of second line
Total number of events 90 29
Median survival time, months 5.3 3.6
% survival at 6 months 0.47 0.38
% survival at 12 months 0.21 0.24
% survival at 18 months 0.13 0.14
% survival at 24 months 0.11 0.07
PFS from initiation of third line
Total number of events 60 20
Median survival time, months 4.2 5.6
% survival at 6 months 0.39 0.51
% survival at 12 months 0.24 0.2
(Continued)
Table 2(Continued).
Covariateb PD-L1 <25% PD-L1≥25%
% survival at 18 months 0.08 0
% survival at 24 months 0.03 Not calculable
Notes:a
OS was defined as the time from index date to death due to any cause or last follow-up, whichever was later. PFS was defined as the time from index date to the date the patient changed therapy due tofirst documented disease progression or death due to any cause, whichever occurred earliest. Those who did not have an event during follow-up were censored at the date of last follow-up.b
Three index dates were utilized: i) date of initiation of third-line therapy (for the subset that received third line), ii) date of initiation of second-line therapy, and iii) date of diagnosis.
Abbreviations:OS, overall survival; PD-L1, programmed cell death ligand-1; PFS, progression-free survival.
Schabath et al Dovepress
Cancer Management and Research downloaded from https://www.dovepress.com/ by 118.70.13.36 on 20-Aug-2020
PD-L1 (SP263) Assay and demonstrated that PD-L1 expression level was not associated with survival in patients with advanced NSCLC. A recent systematic lit-erature review assessed the association of PD-L1 expres-sion level and disease characteristics in patients with
advanced NSCLC to determine its prognostic significance
as a predictive biomarker of response to anti-PD-1/PD-L1
antibodies.22 It demonstrated no association between
PD-L1 expression level and demographic characteristics such as gender, age, smoking history, tumor histology (adeno-carcinoma vs squamous cell (adeno-carcinoma), performance
sta-tus, pathologic tumor grade, orEGFR/KRAS/ALKstatus.22
The study also suggested that considerable research links PD-L1 expression level in tumors to shorter survival in advanced/metastatic NSCLC; however, its use as a
prog-nostic factor requires more research.22
From a clinical decision-making standpoint, it is inter-esting to note that trials evaluating the prognostic capabil-ities of the 22C3 PD-L1 antibody have reported disparate results.37,38Sorensen et al evaluated the tissue specimens of 204 patients with advanced NSCLC treated in Denmark
with a cut-off traceable to the“clinical trial version of the
assay”and found no significant association between PD-L1
expression and survival.37In a multivariate analysis of 678
Australian patients with Stage I-III NSCLC treated with chemotherapy, Cooper et al found that high expression of
PD-L1 (≥50%) was associated with significantly longer OS
(P<0.05). There were no associations with sex, stage, and
EGFRor KRASmutation status.38 The retrospective study
design, different demographic characteristics of patients, antibodies, and cut-offs used make cross-study comparisons challenging. Nevertheless, there is clearly variability in the prognostic potential of PD-L1 expression level testing.
The relationship between PD-L1 expression level and response to immunotherapy has been demonstrated in multiple clinical studies, with increased enrichment of response with higher levels of PD-L1 expression; how-ever, responses are also observed (to a lesser degree) in
PD-L1 low/negative patient subgroups.25,39,40 While
tumor heterogeneity may play a role in these observations, other mechanisms are likely involved in response to immunotherapy/evasion of immune response.
Smoking (ie, current and former smoker status)39 and
TMB21 have previously been associated with response to
nivolumab. In the current analysis, smoking history was not associated with PD-L1 expression level. Interestingly, a weak positive association between TMB and PD-L1 expression
2.8
PD-L1 staining (%)
2.7
2.6
2.5
2.4
0 20 40 60 80
Correlation = 0.22, p = 0.05
log10 (Mutation Load)
a
b
c 3.5
3.0
2.5
2.0
1.5
1.0
PD-L1 Protein
-2 -1 0 1 2 3 4
R = 0.27; p = 1.85 e-05
log10 (Mutation Load)
3.2
3
2.8
2.6
2.4
PD-L1 ≥25% PD-L1 <25%
p = 0.343
log10 (Mutation Load)
Figure 2Mutational load vs PD-L1 expression level. (A) Scatter plot of log TMB and the percentage of tumor cells with PD-L1 expression demonstrating correlation between mutational load and % PD-L1 staining. PD-L1 expression, as a continuous covariate, was weakly but positively associated with the number of somatic muta-tions (Pearson’s correlation coefficient=0.22, P=0.05). (B) Correlation between mutational load and % PD-L1 staining in the TCGA demonstrating similar results as in Figure 2A. (C) Mutational load by high vs low PD-L1 expression level demonstrating no significant difference observed when TMB was analyzed by PD-L1 expression≥25%.
Abbreviations: PD-L1, programmed cell death ligand-1; TCGA, The Cancer Genome Atlas; TMB, tumor mutational burden.
Dovepress Schabath et al
Cancer Management and Research downloaded from https://www.dovepress.com/ by 118.70.13.36 on 20-Aug-2020
level was observed in this study and this was validated using
data on lung cancer from TCGA.33The positive correlation
between PD-L1 expression level and TMB is consistent with the expectation that more somatic mutations lead to a higher probability of neo-antigens, which is likely to attract more
infiltrating immune cells to the tumor and drive increased
PD-L1 expression in tumor cells for survival advantage.41
The weak correlation between PD-L1 expression level and TMB may also indicate that there are many other factors
influencing PD-L1 levels. TMB has been further explored in
anti-PD-1/PD-L1/CTLA-4–treated cohorts of patients with
NSCLC for predictive abilities, with promising results.19–21
Whether TMB is a superior predictor of response to anti-PD-1/ PD-L1 therapy is yet to be established prospectively. Currently, its most promising clinical applicability may be in PD-L1 low/negative patients (<25%). Given the complexities of intra-tumoral heterogeneity and the interplay with host immune response, it is likely that multiple biomarkers may be required to accurately predict response to immunotherapy. Such analyses are beyond the scope of this retrospective study. Molecular testing is a standard aspect to the work-up of
patients with NSCLC, especially nonsquamous NSCLC.42
Key molecular markers of NSCLC includeEGFRandKRAS
mutations, andALKrearrangements, which are expressed in
several patients with NSCLC and are mutually exclusive. In this study, in addition to TMB, we also evaluated these
indivi-dual mutations. WhileKRASmutations were not significantly
associated with PD-L1 expression levels, patients withEGFR
mutations demonstrated high PD-L1 expression compared
withEGFRwild-type. In a subset analysis of the KEYNOTE
001 trial (Phase I trial of single-agent pembrolizumab for
treatment of advanced NSCLC; Dako PD-L1 IHC 22C3
pharmDx), 35% of the patients with EGFR mutations had
high PD-L1 expression (tumor proportion score [TPS]
≥50%) and 43% of the patients withKRASmutations had a
TPS≥50%. Interestingly, those withEGFRmutations and a
TPS <1% had a 0% RR, while those withKRASmutations and
a TPS ranging from 1% to 49% had a 0% RR.43Due to the
small sample size of this study, the results must be interpreted with caution.44
Limitations of this study include its retrospective design. Furthermore, approximately 75% of the patients with NSCLC in this analysis were derived from a single institution and patients were mostly white. Hence, the results may not be generalizable to community practices or other cancer centers that treat patients with different ethnicities. Additionally, the
significant association observed between TMB and race should
be interpreted with caution as it may be an artifact of the analysis method, as opposed to a true measure of biological differences in TMB between ethnicities. Further, the covariates were largely limited to cancer registry data, which do not include a systematic assessment of lung cancer risk factors such as detailed smoking history, family history of cancer, comorbidities, and medical history. Another potential limita-tion is the sample size of this patient cohort. Regarding the 3 co-primary endpoints, if we assume approximately 40% of the patients have high PD-L1 expression, with different number of
samples tested, the 95% confidence intervals (CIs) are as
follows: 300 samples, 95% CI (32%–49%); 170 samples,
95% CI (30–53%); 100 samples, 95% CI (28–58%).
However, the actual sample size was very low, which may limit our power to detect statistically significant results in
sub-Table 3High-Frequency Mutations And PD-L1 Expression
Gene No. Of Variants
Log-rank P-Values
P-Valuea P-Valueb OS From Primary Diagnosis
OS From Second-Line Therapy
OS From Third-Line Therapy
PFS From Primary Diagnosis
PFS From Second-Line Therapy
PFS From Third-Line Therapy
CFTR 33 1.000 0.538 0.150 0.799 0.889 0.072 0.484 0.084
CRIPAK 67 0.223 0.051 0.682 0.834 0.370 0.479 0.286 0.700
DDHD1 43 0.205 0.290 0.580 0.195 0.235 0.167 0.664 0.331
DEFB126 68 1.000 0.763 0.766 0.636 0.774 0.380 0.681 0.048
KRAS 22 1.000 0.789 0.742 0.573 0.473 0.337 0.028 0.687
NCOR2 86 1.000 0.826 0.344 0.959 0.497 0.195 0.775 0.201
RBMX 21 1.000 0.899 0.403 0.024 0.480 0.833 0.089 0.077
TP53 37 0.308 0.745 0.002c 0.014 0.536 0.021 0.041 0.367
Notes:a
Fisher’s exact test P-value for PD-L1 positivity/negativity vs mutation/wild-type.b
One-way ANOVA test P-value for PD-L1 IHC level vs mutation/wild-type.c
P<0.01. Bold P-values are statistically significant.
Abbreviations:ANOVA, analysis of variance; IHC, immunohistochemistry;KRAS, Kirsten rat sarcoma viral oncogene; OS, overall survival; PD-L1, programmed cell death ligand-1; PFS, progression-free survival;TP53, tumor protein p53.
Schabath et al Dovepress
Cancer Management and Research downloaded from https://www.dovepress.com/ by 118.70.13.36 on 20-Aug-2020
strata analyses. As the analyses were performed in an immu-notherapy-naïve population with NSCLC, the predictive value of the IHC assay is beyond the scope of this study but can be
found in the ATLANTIC trial publication.45Thefinal
limita-tion is that details such as testing procedure and localimita-tion of
testing were not available for the patients whereEGFR, KRAS,
andALKstatus was abstracted from medical records.
Conclusion
In this retrospective analysis conducted in
immunotherapy-naïve patients with advanced NSCLC treated with≥2 lines of
chemotherapy, survival outcomes based on standard of care chemotherapy were comparable in patients with high and low
levels of PD-L1 expression.EGFRandKRASmutation status
was not found to be significantly associated with PD-L1
expression level, while TMB was weakly associated with PD-L1 expression level. Overall, PD-L1 expression level was not observed to be an independent prognostic biomarker in patients with advanced NSCLC treated with chemotherapy.
Ethics Approval And Informed
Consent
The protocol of this study was approved by the Chesapeake Institutional Review Board (Columbia, MD). The study was conducted in accordance with the ethical principles that have their origin in the Declaration of Helsinki and was consistent with Good Clinical Practice guidelines and applicable reg-ulatory requirements. Written informed consent was obtained from all patients for their participation in the study.
Data Availability
Data underlying the findings described in this manuscript
may be obtained in accordance with AstraZeneca’s data
sharing policy described at https://astrazenecagrouptrials.
pharmacm.com/ST/Submission/Disclosure.
Acknowledgments
The authors thank Liam Gillies PhD, of Cactus
Communications Pvt. Ltd. for editorial and submission sup-port, which was in accordance with Good Publication Practice (GPP3) guidelines and funded by AstraZeneca. The authors also thank Suzanne Booth and Noolie Gregory for their work on the study. M2Gen received funding from AstraZeneca to manage this study and to perform data analyses.
Funding
The study was funded by AstraZeneca. The sponsor was involved in the study design; collection, analysis, and
interpretation of data; report writing; and the decision to submit.
Disclosure
Dr. Gray receives research grants and personal fees from AstraZeneca; research grants from Merck, Bristol Myers Squibb, and Genentech, during the conduct of the study. She is an advisor for AstraZeneca. She also reports research grants and personal fees from AstraZeneca and Genentech; research grants from Array, Merck, Epic Sciences, Bristol Myers Squibb, Boehringer Ingelheim, Trovagene, and Novartis; personal fees from Takeda, Eli Lilly, Celgene, and Janssen, outside of the submitted work. Drs. Dalvi, Midha, Shire, Walker, and Rigas are employees of AstraZeneca and hold stock in the company. Dr Brody is now a retiree and was an employee of AstraZeneca at the time of the study. Dr Potter was an employee of AstraZeneca at the time of the study and currently an AstraZeneca stock-holder. Drs. Greenawalt and Lawrence were employees of AstraZeneca at the time of the study and are currently employed with Bristol-Myers Squibb, USA, and Novartis, Switzerland, respectively. Drs Dai and Crim are employees of M2Gen. Drs Kumar and Huntsman were employees of M2Gen at the time of the study. The authors report no other conflicts of interest in this work.
References
1. American Cancer Society. Cancer Facts & Figures 2018. Atlanta:
American Cancer Society;2018.
2. American Cancer Society. Non-small cell lung cancer survival rates,
by stage.2018. Available from:
https://www.cancer.org/cancer/non-small-cell-lung-cancer/detection-diagnosis-staging/survival-rates.html. Accessed April 2018.
3. Santarpia M, Giovannetti E, Rolfo C, et al. Recent developments in the
use of immunotherapy in non-small cell lung cancer.Expert Rev Respir
Med.2016;10(7):781–798. doi:10.1080/17476348.2016.1182866
4. Tchekmedyian N, Gray JE, Creelan BC, et al. Propelling immunotherapy
combinations into the clinic. Oncology (Williston Park). 2015;29
(12):990–1002.
5. Brahmer JR. Harnessing the immune system for the treatment of
non-small-cell lung cancer.J Clin Oncol.2013;31(8):1021–1028. doi:10.
1200/JCO.2012.45.8703
6. Jing W, Li M, Zhang Y, et al. PD-1/PD-L1 blockades in non-small-cell lung
cancer therapy.Onco Targets Ther.2016;9:489–502. doi:10.2147/OTT
7. He J, Hu Y, Hu M, Li B. Development of PD-1/PD-L1 pathway in tumor immune microenvironment and treatment for non-small cell
lung cancer.Sci Rep.2015;5:13110. doi:10.1038/srep13110
8. Antonia SJ, Villegas A, Daniel D, et al. Durvalumab after
chemora-diotherapy in stage III non-small-cell lung cancer.N Engl J Med.
2017;377(20):1919–1929. doi:10.1056/NEJMoa1709937
9. Seetharamu N, Preeshagul IR, Sullivan KM. New PD-L1 inhibitors in
non-small cell lung cancer - impact of atezolizumab.Lung Cancer
(Auckl).2017;8:67–78. doi:10.2147/LCTT.S113177
Dovepress Schabath et al
Cancer Management and Research downloaded from https://www.dovepress.com/ by 118.70.13.36 on 20-Aug-2020
10. Politi K, Herbst RS. Lung cancer in the era of precision medicine. Clin Cancer Res. 2015;21(10):2213–2220. doi:10.1158/1078-0432. CCR-14-2748
11. Pao W, Girard N. New driver mutations in non-small-cell lung
cancer.Lancet Oncol.2011;12(2):175–180. doi:10.1016/S1470-2045
(10)70087-5
12. Shaw AT, Kim DW, Mehra R, et al. Ceritinib in ALK-rearranged
non-small-cell lung cancer.N Engl J Med.2014;370(13):1189–1197.
doi:10.1056/NEJMoa1311107
13. Soria JC, Ohe Y, Vansteenkiste J, et al. Osimertinib in untreated
EGFR-mutated advanced non-small-cell lung cancer.N Engl J Med.
2018;378(2):113–125. doi:10.1056/NEJMoa1713137
14. Zhou C, Wu YL, Chen G, et al. Erlotinib versus chemotherapy as
first-line treatment for patients with advanced EGFR
mutation-posi-tive non-small-cell lung cancer (OPTIMAL, CTONG-0802): a
multi-centre, open-label, randomised, phase 3 study.Lancet Oncol.2011;12
(8):735–742. doi:10.1016/S1470-2045(11)70184-X
15. Rosell R, Carcereny E, Gervais R, et al. Erlotinib versus standard
che-motherapy asfirst-line treatment for European patients with advanced
EGFR mutation-positive non-small-cell lung cancer (EURTAC): a
multi-centre, open-label, randomised phase 3 trial. Lancet Oncol. 2012;13
(3):239–246. doi:10.1016/S1470-2045(11)70393-X
16. Sequist LV, Yang JC, Yamamoto N, et al. Phase III study of afatinib or cisplatin plus pemetrexed in patients with metastatic lung
adeno-carcinoma with EGFR mutations.J Clin Oncol.2013;31(27):3327–
3334. doi:10.1200/JCO.2012.44.2806
17. Lilenbaum RA, Horn LA. Management of EGFR mutation-positive
non-small cell lung cancer. J Natl Compr Canc Netw. 2016;14(5
Suppl):S672–S674. doi:10.6004/jnccn.2016.0189
18. Horn L. Targeted/emerging therapies for metastatic non-small cell
lung cancer.J Natl Compr Canc Netw.2015;13(5 Suppl):S676–S678.
doi:10.6004/jnccn.2015.0201
19. Goodman AM, Kato S, Bazhenova L, et al. Tumor mutational burden as an independent predictor of response to immunotherapy in diverse
cancers. Mol Cancer Ther. 2017;16(11):2598–2608. doi:10.1158/
1535-7163.MCT-17-0386
20. Hellmann MD, Ciuleanu TE, Pluzanski A, et al. Nivolumab plus
ipilimumab in lung cancer with a high tumor mutational burden.N
Engl J Med. 2018;378(22):2093–2104. doi:10.1056/NEJMoa18 01946
21. Carbone DP, Reck M, Paz-Ares L, et al. First-line nivolumab in stage
IV or recurrent non-small-cell lung cancer.N Engl J Med.2017;376
(25):2415–2426. doi:10.1056/NEJMoa1613493
22. Brody R, Zhang Y, Ballas M, et al. PD-L1 expression in advanced
NSCLC: insights into risk stratification and treatment selection from
a systematic literature review. Lung Cancer. 2017;112:200–215.
doi:10.1016/j.lungcan.2017.08.005
23. Fenstermacher DA, Wenham RM, Rollison DE, Dalton WS.
Implementing personalized medicine in a cancer center.Cancer J.
2011;17(6):528–536. doi:10.1097/PPO.0b013e318238216e
24. AstraZeneca. A global study to assess the effects of MEDI4736 in patients with locally advanced or metastatic non small cell lung cancer
(ATLANTIC). NLM identifier: NCT02087423. Available from:https://
clinicaltrials.gov/ct2/show/NCT02087423. Accessed July 2018. 25. Garon EB, Rizvi NA, Hui R, et al. Pembrolizumab for the treatment
of non-small-cell lung cancer. N Engl J Med.2015;372(21):2018–
2028. doi:10.1056/NEJMoa1501824
26. Rebelatto MC, Mistry A, Sabalos C, et al. An immunohistochemical PD-L1 companion diagnostic assay for treatment with durvalumab (MEDI4736) in NSCLC patients [abstract]. Proceedings of the CRI-CIMT-EATI-AACR Inaugural International Cancer Immunotherapy Conference: Translating Science into Survival; September 16-19; 2015; New York, NY. Philadelphia (PA): AACR; Cancer Immunol
Res.2016;4(1Suppl): Abstract B005. Available from:http://cancerim
munolres.aacrjournals.org/content/4/1_Supplement/B005.short.
27. Li H, Durbin R. Fast and accurate short read alignment with
Burrows-Wheeler transform. Bioinformatics. 2009;25(14):1754–
1760. doi:10.1093/bioinformatics/btp324
28. Lai Z, Markovets A, Ahdesmaki M, et al. VarDict: a novel and versatile variant caller for next-generation sequencing in cancer
research.Nucleic Acids Res.2016;44(11):e108. doi:10.1093/nar/gkw
227
29. Cingolani P, Platts A, Wang LL, et al. A program for annotating and predicting the effects of single nucleotide polymorphisms, SnpEff: sNPs in the genome of Drosophila melanogaster strain w1118; iso-2;
iso-3.Fly (Austin).2012;6(2):80–92. doi:10.4161/fly.19695
30. Forbes SA, Beare D, Gunasekaran P, et al. COSMIC: exploring the
world’s knowledge of somatic mutations in human cancer.Nucleic Acids
Res.2015;43(Databaseissue):D805–D811. doi:10.1093/nar/gku1075
31. Landrum MJ, Lee JM, Benson M, et al. ClinVar: public archive of
interpretations of clinically relevant variants. Nucleic Acids Res.
2016;44(D1):D862–D868. doi:10.1093/nar/gkv1222
32. Sherry ST, Ward MH, Kholodov M, et al. dbSNP: the NCBI database
of genetic variation.Nucleic Acids Res.2001;29(1):308–311. doi:10.
1093/nar/29.1.308
33. The Cancer Genome Atlas (TCGA) - cancer genome. Available from: https://cancergenome.nih.gov/. Accessed July 2018.
34. Shukuya T, Carbone DP. Predictive markers for the efficacy of
anti-PD-1/PD-L1 antibodies in lung cancer. J Thorac Oncol. 2016;11
(7):976–988. doi:10.1016/j.jtho.2016.02.015
35. Diggs LP, Hsueh EC. Utility of PD-L1 immunohistochemistry assays
for predicting PD-1/PD-L1 inhibitor response. Biomarker Res.
2017;5:12. doi:10.1186/s40364-017-0093-8
36. Hirsch FR, McElhinny A, Stanforth D, et al. PD-L1 immunohisto-chemistry assays for lung cancer: results from phase 1 of the
Blueprint PD-L1 IHC Assay Comparison Project.J Thorac Oncol.
2018;12(2):208–222. doi:10.1016/j.jtho.2016.11.2228
37. Sorensen SF, Zhou W, Dolled-Filhart M, et al. PD-L1 expression and survival among patients with advanced non-small cell lung cancer
treated with chemotherapy.Transl Oncol.2016;9(1):64–69. doi:10.10
16/j.tranon.2016.01.003
38. Cooper WA, Tran T, Vilain RE, et al. PD-L1 expression is a favorable
prognostic factor in early stage non-small cell carcinoma. Lung
Cancer.2015;89(2):181–188. doi:10.1016/j.lungcan.2015.05.007 39. Borghaei H, Paz-Ares L, Horn L, et al. Nivolumab versus docetaxel
in advanced nonsquamous non-small-cell lung cancer.N Engl J Med.
2015;373(17):1627–1639. doi:10.1056/NEJMoa1507643
40. Gettinger S, Rizvi NA, Chow LQ, et al. Nivolumab monotherapy for
first-line treatment of advanced non–small-cell lung cancer.J Clin
Oncol.2016;34:2980–2987. doi:10.1200/JCO.2016.66.9929 41. Wirth TC, Kühnel F. Neoantigen targeting-dawn of a new era in
cancer immunotherapy?Front Immunol.2017;8:1848. doi:10.3389/
fimmu.2017.01848
42. Lindeman NI, Cagle PT, Aisner DL, et al. Updated molecular testing guideline for the selection of lung cancer patients for treatment with targeted tyrosine kinase inhibitors: guideline from the College of American Pathologists, the International Association for the Study of
Lung Cancer, and the Association for Molecular Pathology.Arch Pathol
Lab Med.2018;142(3):321–346. doi:10.5858/arpa.2017-0388-CP 43. Leighl NB, Hellmann MD, Hui R, et al. KEYNOTE-001: 3-year
overall survival for patients with advanced NSCLC treated with
pembrolizumab. J Clin Oncol. 2017;35(15 Suppl):9011. doi:10.12
00/JCO.2017.35.15_suppl.9011
44. Rizvi NA, Hellmann MD, Snyder A, et al. Cancer immunology. Mutational landscape determines sensitivity to PD-1 blockade in
non-small cell lung cancer.Science.2015;348(6230):124–128. doi:10.1126/
science.aaa1348
45. Garassino MC, Cho B-C, Kim J-H, et al. Durvalumab as third-line or
later treatment for advanced non-small-cell lung cancer
(ATLANTIC): an open-label, single-arm, phase 2 study. Lancet
Oncol.2018;19(4):521–536. doi:10.1016/S1470-2045(18)30144-X
Schabath et al Dovepress
Cancer Management and Research downloaded from https://www.dovepress.com/ by 118.70.13.36 on 20-Aug-2020
Cancer Management and Research
Dove
press
Publish your work in this journal
Cancer Management and Research is an international, peer-reviewed open access journal focusing on cancer research and the optimal use of preventative and integrated treatment interventions to achieve improved outcomes, enhanced survival and quality of life for the cancer patient.
The manuscript management system is completely online and includes a very quick and fair peer-review system, which is all easy to use. Visit http://www.dovepress.com/testimonials.php to read real quotes from published authors.
Submit your manuscript here:https://www.dovepress.com/cancer-management-and-research-journal
Dovepress Schabath et al
Cancer Management and Research downloaded from https://www.dovepress.com/ by 118.70.13.36 on 20-Aug-2020