International Journal of Sciences
Research Article
(ISSN 2305-3925)
Volume 2, Issue July 2013
http://www.ijSciences.com
Malgorzata Malodobra-Mazur (Correspondence)
[email protected]
+48 71 784 15 95
The Association of Functional Single
Nucleotide Polymorphisms of the RBP4
Gene with Gene Expression and Insulin
Resistance Risk
Malgorzata Malodobra-Mazur
1
, Dorota
Bednarska-Chabowska
2
, Robert Olewinski
3
, Zygmunt Chmielecki
4
,
Rajmund Adamiec
2
, Tadeusz Dobosz
1
1
Department of Forensic Medicine, Molecular Technique Unit, Wroclaw Medical University, Sklodowskiej-Curie 52, 50-369 Wroclaw, Poland
2
Department of Angiology, Hypertension and Diabetology, Wroclaw Medical University, Borowska 213, 50-556 Wroclaw, Poland
3
First Department and Clinic of General, Gastroenterological and Endocrinological Surgery, Wroclaw Medical University, M. Curie-Skłodowskiej 66, 50-369 Wroclaw, Poland
4
Provincial Specialist Hospital in Wroclaw, Kamieńskiego 73 a, 51-124 Wroclaw, Poland
Abstract:
Aims/Introduction: The RBP4 level has been found to correlate positively with risk of insulin resistance and type 2 diabetes. However, the exact mechanism linking RBP4 with metabolic disorders is not clear. In presented study the associations of two single nucleotide polymorphisms located in promoter region of the RBP4 gene rs3758538 (-1265A>C) and rs3758539 (-803 G>A) with insulin resistance risk, RBP4 mRNA level and biochemical parameters were analyzed.
Material and methods: Two polymorphisms were genotyped by multiplex minisequencing with the use of ABI PRISM® SNaPshot Multiplex Kit. RBP4 gene expression analysis was done by Relative Real-Time PCR and normalized to β-actin and GUS-β genes. Insulin and cytokines were measured using commercial ELISA kits.
Results:IR patients were characterized by increased RBP4 mRNA level in adipose tissue comparing to IS patients and control subjects, what correlated positively with insulin resistance. Polymorphism rs3758539 showed no differences in genotype frequencies between tested groups. The rs3758538 displayed higher number of C allele within type 2 diabetes patients. There was no relationship between genotype and RBP4 gene expression level. Furthermore, no relationship of investigated SNPs with insulin resistant phenotype has been noticed.
Conclusions: Present results link the RBP4 gene expression level with insulin resistance pathogenesis. However, there is lack of association between analyzed SNPs with insulin resistant phenotype, RBP4 gene expression level and inflammatory state.
Keywords: RBP4, Insulin resistance, SNP
Introduction
Obesity is considered as the strongest risk factor for metabolic syndrome (MS), insulin resistance (IR) and type 2 diabetes mellitus (T2DM) [1,2]. In deed, numerous studies demonstrated that visceral adipose tissue correlated stronger with insulin resistance than subcutaneous adipose tissue [3,4]. Obesity leads to adipocytes hyperplasia and hypertrophy that impairs their metabolism and function [3,5]. On the other hand physical activity and body mass reduction
improve the whole body response to insulin and insulin sensitivity [6,7].
http://www.ijSciences.com Volume 2, Issue July 2013
106
MCP-1 (monocyte chemotactic protein-1). The levels of secreted inflammatory cytokines and adipocytokines are correlated with body mass index (BMI) [8,9], impairment of insulin action and insulin resistance [10].
The RBP4 is a principal retinol (Vitamin A) transporter and is secreted by adipose tissue and liver [11]. Increased circulating RBP4 level has been found in obese subjects. Interestingly, the increased RBP4 level correlated positively with risk of IR and type 2 diabetes [12]. According to Klöting et al. [13] the level of RBP4 gene expression rate was higher in visceral comparing to subcutaneous adipose tissue, what positively correlated with BMI value. These findings link RBP4 with metabolic disorders; however, the exact mechanism linking RBP4 with metabolic disorders is not clear. There are several possible mechanisms implicating RBP4 with impairments in insulin sensitivity. It has been shown that circulating RBP4 level negatively correlated with GLUT4 level in adipose tissue [12,14], what might suggest influence on SLC2A4 gene expression. RBP4 also seems to affect the phosphorylation of IRS-1 serine residues [15]. Furthermore numerous polymorphisms of the RBP4 gene were associated with BMI, hypertriglicerydemia or risk of type 2 diabetes [16,17,18]. Kovacs et al. [19] displayed the relationship of six SNPs haplotypes with the RBP4
gene mRNA level and increased risk of insulin resistance. Similar relationship of rare haplotypes has been seen by Hu et al. [20]. Additionally, they revealed associations with circulating RBP4 level and serum C-peptide level at fasting state and after OGTT.
In presented study the associations of RBP4 gene expression with insulin resistance was assessed. Furthermore the mechanisms by which RBP4 might influence the insulin action were investigated. The
RBP4 gene expression level, the SLC2A4 gene expression level and inflammatory cytokines were correlated. Two single nucleotide polymorphisms located in promoter region of the RBP4 gene were genotyped and the genotype distribution was correlated with mRNA level, biochemical parameters and insulin resistance risk.
Material and Methods
The experimental protocols were approved by ethical review boards at Wroclaw Medical University.
Population characterization
130 unrelated diabetic patients (68 men and 62 women) and 98 healthy controls (39 men and 59 women) were genotyped. Type 2 diabetes patients were inpatients of the Department of Angiology,
Hypertension and Diabetology of Wroclaw Medical University. Adipose tissue biopsies both form type 2 diabetes patients and control subjects were taken during abdominal surgery performed in the First Department and Clinic of General, Gastroenterological and Endocrinological Surgery, Wroclaw Medical University and in the Regional Specialist Hospital, Kaminskiego Street in Wroclaw. The adipose tissue samples were collected from 15 patients with type 2 diabetes and from 24 control (without type 2 diabetes and insulin resistance) subjects. The aims of abdominal surgeries were mainly cholecystectomy, surgery of abdominal hernia or gastric surgery. The mean age of diabetic patients was 55±7 years. The mean age of healthy subjects was similar and equaled 50±10 years. Control subjects were selected based on fast glucose level below 100 mg/dl, lack of diabetes in family history, additionally for women no gestational diabetes in the past. All materials were taken after obtaining written consent. Diabetic patients were divided into two subgroups depending on the insulin sensitivity: IS – insulin sensitive and IR – insulin resistant.
BMI and insulin resistance ratios
BMI was calculated as weight in kilograms divided by square of height in meters [kg/m2]. Insulin resistance ratios were calculated as follow [21]: 1) HOMA-IR [(glucose [mmol/l] * insulin [µU/ml])/22.5],
2) QUICKI [1/ (log glucose [mg/dl] + log insulin [µU/ml])].
Genotyping
The whole venous blood was taken on anticoagulant at fasten state both from healthy control and diabetic patients after obtaining written consent. The blood samples were centrifuged and plasma samples were taken for adipocytokines and insulin levels measurements. DNA was isolated with the use of EZNA Total DNA Kit (Omega Bio Tek.). Two polymorphisms were genotyped: rs3758538 (-1265A>C) and rs3758539 (-803 G>A). Amplified in multiplex PCR (QIAGEN® Multiplex PCR Kit, Qiagen), polymorphic fragments were genotyped by multiplex minisequencing (ABI PRISM® SNaPshot Multiplex Kit, Applied Biosystems) according to manufactured protocols. The minisequencing products were separated in capillary electrophoresis together with GeneScan™120LIZ® Size Standard (Applied Biosystems) on ABI PRISM 3130 Genetic Analyzer (Applied Biosytems) and analyzed with the use of GeneMapper ID v3.2 (Applied Biosystems).
Insulin, adipocytokines and inflammatory cytokines measurements
http://www.ijSciences.com Volume 2, Issue July 2013
107
measured using commercial kits: Human Adiponectin ELISA Kit (Millipore) and Human Insulin ELISA Kit (Millipore). IL-6 and TNF-α concentrations were measured using ELISA kits: PeliKine Human IL-6 ELISA Kit (Sanquin) and PeliKine Human TNF-alpha ELISA Kit (Sanquin) according to manufactured protocols.
Gene expression analysis
Visceral adipose tissue biopsies were taken during abdominal surgery. Samples were preserved in RNALater (Ambion) and stored at -70°C until analysis. RNA was isolated using TriPure Reagent (Roche). cDNA was synthesized with the use of High Capacity cDNA Reverse Transcription Kit (Applied Biosystems). The gene expression analysis was done by Relative Real-Time PCR using TaqMan Gene Expression Assay (Applied Biosystems) and normalized to β-actin and GUS-β genes as reference controls (housekeeping genes).
Adipocytes measurements
Adipose tissue biopsies taken from lean patients (BMI < 25 kg/m2) and from obese patients (BMI > 30 kg/m2) were fixed in 10% formalin and stained by hematoxylin-eosin (H&E). Adipocytes size was assessed by ImageJ and analyzed statistically by Student-T test.
Statistical analysis
Statistical analyses were done using STATISTICA software. Statistical significance was considered with p < 0.05. Differences between clinical features of tested groups were assessed by Student’s T-Test. Association of SNPs with clinical parameters and
RBP4 gene expression level were done with use of one way variance analysis ANOVA. Correlation between gene expression and biochemical parameters were assessed by coefficient of correlation. Differences in SNP’s frequencies were tested using
CHI2 test. Hardy-Weinberg Equilibrium (HWE) was established by CHI2 test using following formula p2+2pq+q2=1. Linkage disequilibrium (LD) was assessed using formula D=hf – pi x qi, (hf-haplotype frequencies, pi, qi- alleles frequencies). The gene expression level was analyzed using relative quantification delta-delta (ΔΔCt) model [22].
Results
Characterization of analyzed groups
The anthropometrical and biochemical characterizations of type 2 diabetes patients and healthy controls are presented in table 1. 67.5% of all diabetic patients were insulin resistant (IR), whilst 32.5% diabetic patients displayed proper insulin sensitivity (IS). The IR patients were characterized by
increased BMI value (p=0.0203) and fasting insulin level (p=0.0000) as well as insulin resistance ratios (p=0.0000 both for HOMA-IR and QUICKI) in comparison to IS patients. Furthermore insulin resistance positively correlated with BMI (R=0.44, p=0.000 (HOMA-IR) and R=-0.53, p=0.000 (QUICKI)). Furthermore, IR patients manifested higher hypertension and increased TG level. The glucose level did not show statistical difference between groups of patients with a slight increase in the IR group (p=0.0538).
Hardy- Weinberg Equilibrium and linkage disequilibrium analyses
Both genotyped SNPs did not show any divergences from Hardy-Weinberg Equilibrium. For both polymorphisms the p values were higher than 0.99 (CHI2). There was no linkage disequilibrium between two analyzed SNPs in the RBP4 gene.
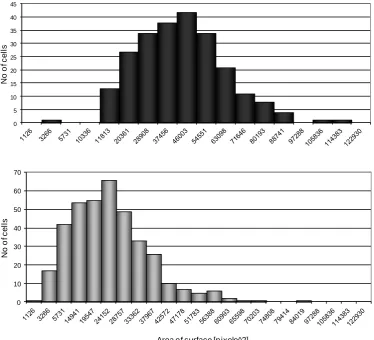
Adipocytes measurements
The adipocytes sizes differed significantly between investigated groups (lean: BMI < 25 kg/m2 and obese: BMI > 35 kg/m2) (p=0.0000). The histograms showed that obese subjects were characterized by increased adipocytes size, on the other hand histogram of lean subjects was shifted towards smaller cells (Figure 1).
Adipocytokines and inflammatory cytokines measurements analysis
There had been significant increase in IL-6 (p=0.0157) level but only slight increase in TNF-α level (p=0.8859) in type 2 diabetic patients with no differences between IS and IR groups. Furthermore IL-6 correlated positively with BMI values (R=0.36, p=0.055). However there was no correlation between IL-6 and insulin resistance ratios. On the other hand we observed strong negative correlation between TNF-α and QUICKI (R=(-0.49), p=0.046), but there was no correlation with BMI. Adiponectin level was significantly lower in type 2 diabetes patients (p=0.0293) with no differences between IS and IR
groups. More, the adiponectin showed slight negative correlation with BMI (R=(-0.30), p=0.0639). There was however no correlation between adiponectin level and insulin resistance rate.
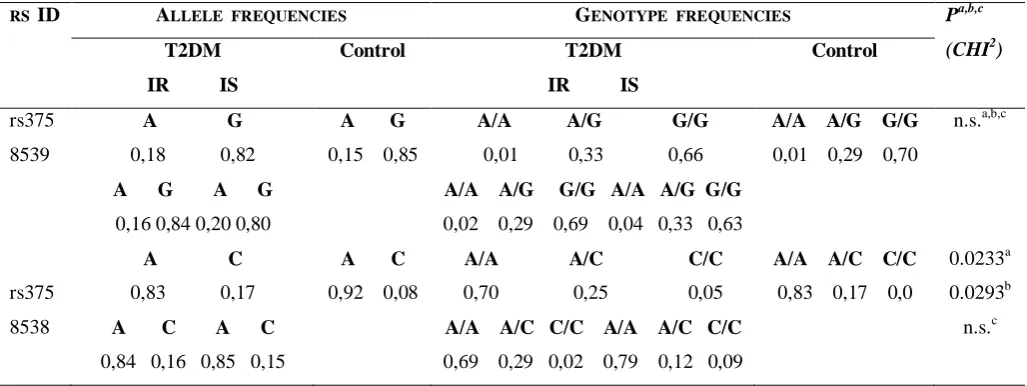
Genotype frequencies analysis
http://www.ijSciences.com Volume 2, Issue July 2013
108
within type 2 diabetes patients (p=0.0233, CHI2). However there was no statistical difference in genotype frequencies between IR and IS patients. The genotype and allele frequencies are presented in table 2.
Gene expression analysis
IR patients were characterized by increased RBP4
mRNA level in adipose tissue comparing to IS
patients and control subjects (p=0,0277 normalized to
β-actin and p=0,0105 normalized to GUS-β, ANOVA) (figure 2). There was a slight positive correlation between RBP4 gene mRNA level with HOMA-IR (RBP4_G R=0.36, p=0.1, RBP4_B R=0.49, p=0.05) and slight negative correlation with QUICKI (RBP4_G R= (-0.20), n.s., RBP4_B R= (-0.37), p=0.1, figure 3). The SLC2A4 gene expression level (encoding GLUT4) was slightly lower within type 2 diabetes patients, both in insulin resistant patients and in patients with proper insulin sensitivity comparing to healthy controls, however without statistically significance. Similar results have been obtained normalized to two housekeeping genes:
β-actin and GUS-β (figure 3A). There was however no correlation between the RBP4 and SLC2A4 genes expression levels (figure 3B and 3C). Furthermore any associations between the expression of RBP4
gene and adiponectin and inflammatory cytokines concentrations have been displayed.
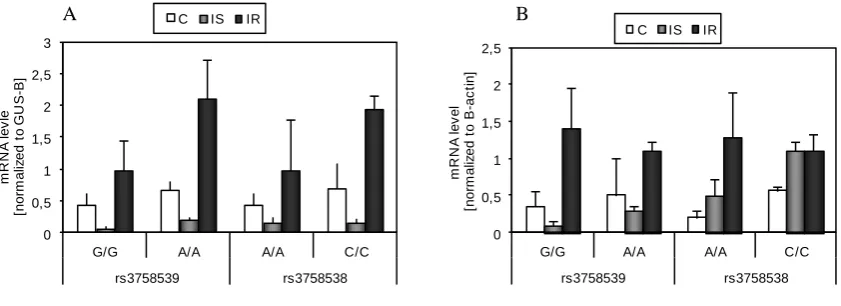
Genotype association with the RBP4 gene expression and insulin resistant phenotype
There was no relationship between genotypes of investigated SNPs and the RBP4 gene expression levels. The level of RBP4 gene mRNA did not differ depending on genotype. High level has been seen for
IR patients and very low for IS patients and controls, but at the same level in carriers of all genotypes (figure 4a and b). Furthermore, no relationship of investigated SNPs with insulin resistant phenotype (BMI, HOMA-IR, QUICKI) has been noticed.
Discussion
The RBP4 protein is considered as a principal retinol transporter [11]. It has been recently linked with increased risk for type 2 diabetes and insulin resistance [12]. It belongs to a family of adipocytokines secreted by adipose tissue. The level of secreted RPB4 correlates positively with BMI and is secreted in higher level in obese when compared to lean subjects. It has been shown also that is highly expressed in visceral adipose tissue comparing to subcutaneous [14]. Obesity is accompanied by adipocytes hypertrophy and hyperplasia what favor insulin signaling impairment and induction of low grade inflammatory state by secretion of many cytokines like IL-6 or TNF-α [5]. Similarly, as it was
expected, we have shown significantly increase in adipocytes size within obese subjects. Obesity correlated positively with insulin resistance, what was confirmed by the correlation between BMI value and insulin resistance indexes: HOMA-IR and QUICKI. Furthermore obese subjects were characterized by increased IL-6 and TNF-α levels and lower adiponecin level that correlated either with BMI or with insulin resistant ratios. These data clearly suggest the role of obesity in insulin signaling impairment and insulin resistance pathogenesis. As the RBP4 is one of cytokine secreted by adipose tissue, the possible mechanism mediating insulin resistance induction might involve RBP4 protein.
Klöting et al. [14] showed increased RBP4 gene expression level in visceral adipose tissue, the type of tissue considered as the more important in metabolic syndrome and type 2 diabetes developments. More, the level of RBP4 gene expression positively correlated with BMI. Bajzová et al.[15] however demonstrated lower level of RBP4 mRNA in visceral adipose tissue than in the subcutaneous adipose tissue. In our study we have focused on visceral adipose tissue and we demonstrated that the RBP4
mRNA level was higher in type 2 diabetic patients suffering from insulin resistance. The RBP4 gene expression level did not differ in diabetic patients with proper insulin sensitivity (assessed based on HOMA-IR and QUICKI) comparing to control subjects and was relatively low. Furthermore the
RBP4 gene expression rate correlated positively with insulin resistance (assessed by HOMA-IR and QUICKI). We demonstrated slight positive correlation with HOMA-IR and negative correlation with QUICKI what affirms the relationship of RBP4
gene expression level with IR. Definitely, increasing number of subjects will allow obtaining strong statistically significant correlation. However the was no statistically significant correlation between RBP4
gene expression level and inflammatory cytokines levels (IL-6 and TNF-α). This data might suggest that RBP4 did not impair insulin sensitivity via mediating inflammatory state, but this need to be verified on larger cohort.
According to some authors the circulating RBP4 level negatively correlated with GLUT4 level in adipose tissues [12,14]. To verify this statement we have checked for the SLC2A4 gene expression rate in visceral adipose tissue and correlated it with the
http://www.ijSciences.com Volume 2, Issue July 2013
109
on a protein level, but not on gene expression level.
Numerous studies demonstrated relationship between polymorphisms in the RBP4 gene with increased risk for insulin resistance and type 2 diabetes [16,17,18]. Munkhtulga el al. [16] were the first that displayed the association of genetic variants in this gene with type 2 diabetes. In present study we were trying to evaluate the correlation of RBP4 regulatory SNPs with RBP4 gene expression, BMI and risk of insulin resistance. The both investigated SNPs were very well characterized in previous studies, where they displayed associations mainly with BMI [16], RBP4
mRNA level [19], hypertriglyceridemia [18] and with increased risk of type 2 diabetes [17]. According to Munkhtulga et al. [16] A allele of rs3758539 correlated positively with higher BMI. On the other hand Van Hoek et al. [17] showed relationship of this SNP with type 2 diabetes risk. The bioinformatics analysis showed that the rs3758539 polymorphism is flanked by binding site for the MAZ and the R1/R2/Sp1 transcription factors when G allele is present. On the other hand when G allele is changed for the A allele the binding site is also changed for the c-Ets-2 transcription factor [19]. Thus the change of nucleotide in functional region might influence the gene expression. Despite the fact, in presented study we did not notice statistically significant relationship between genotypes of this SNP with RBP4 gene expression. More, we did not show associations with any parameters like BMI, glucose and insulin levels or insulin resistance ratios. Furthermore there were no significant differences in genotype and allele frequencies between examined groups.
The rs3758358 displayed significant difference in genotype frequencies between tested groups. The C allele seems to occur in higher frequency in type 2 diabetes patients comparing to controls. However, there was no difference between IS and IR patients, what suggests that C allele might predispose to type 2 diabetes, but not seems to be implicated in insulin resistance pathogenesis. Statistical analysis for this polymorphic site revealed lack of association with insulin resistance ratios (neither with HOMA-IR nor with QUICKI). Furthermore we did not observed statistically significant relationship between clinical parameters characterizing metabolic disorders, although some studies provided that data [18]. Finally, we did not display changed RBP4 gene expression profile depending on genotype. The reason for lack of association might be low size of analyzed study cohort or difference in the origin of analyzed population. The previous study was performed on Chinese [18], Japanese [16] and Holland [17]population.
Interesting approach was undertaken by Kovacs el al. [19] and Hu el al. [20] who displayed the relationship of rare haplotypes with increased risk of insulin resistance and with the RBP4 gene mRNA and circulating RBP4 levels. In present study we did not demonstrated strong linkage disequilibrium value between two analyzed SNPs. Thus our results could not be analyzed in terms of hyplotypes and statistic analysis could be irrelevant. In order to obtain more accurately results, present study should be performed on larger sample size and duplicated in distinct populations. However single locus analysis did not revealed statistically significant associations between analyzed SNPs in RBP4 gene with insulin resistant phenotype, lipids deregulations and increased risk of insulin resistance and type 2 diabetes. Our results confirmed results presented by others [19,20], where single locus analysis also did not display mentioned associations.
Concluding, presented results implicate the RBP4 in insulin resistance pathogenesis. The level of RBP4
mRNA in adipose tissue correlated positively with insulin resistant state. Furthermore, the RBP4 gene expression level was highly expressed in IR patients comparing to IS patients and controls subjects. However, the mechanisms linking RBP4 with insulin resistance remain unsolved. We did not reveal any association of analyzed SNPs in the RBP4 gene promoter region with insulin resistant phenotype as well as with the RBP4 gene expression level. Similarly, there was no correlation between RBP4 and SLC2A4 gene expressions rate or inflammatory cytokines. Further investigations on larger number of subjects need to be done to assess the relationship between RBP4 with insulin resistance pathogenesis.
Acknowledgements
The project was supported by Ministry of Science and Higher Education of Poland, Grant No: N N401 009436. No conflict of interest relevant to the article has been reported.
References
1. Karelis AD, St-Pierre DH, Conus F et al. Metabolic and body composition factors in subgroups of obesity: what do we know? J Clin Endocrinol Metab 2004; 89: 2569-2575.
2. Eckel RH, Alberti KG, Grundy SM et al. The metabolic syndrome. Lancet 2005; 365: 1415-1428.
3. Preis SR, Massaro JM, Robins SJ et al. Abdominal subcutaneous and visceral adipose tissue and insulin resistance in the Framingham heart study. Nature 2010; 18: 2191-2198. 4. Alvehus M, Burén J, Sjöström M et al. The human visceral fat depot has a unique inflammatory profile. Obesity 2010; 18: 879-883.
5. Gustafson B, Gogg S, Hedjazifar S et al. Inflammation and impaired adipogenesis in hypertrophic obesity in man. Am J Physiol Endocrinol Metab 2009; 297: 999-1003.
http://www.ijSciences.com Volume 2, Issue July 2013
110
7. Solomon TP, Sistrun SN, Krishnan RK et al. Exerciseand diet enhance fat oxidation and reduce insulin resistance in older obese adults. J Appl Physiol 2008; 104: 1313-1319. 8. Fisher-Posovszky P, Wabitsch M, Zochberg Z. Endocrinology of adipose tissue – An update. Horm. Metab. Res 2007; 39: 314-321.
9. Rasouli N, Kern PA. Adipocytokines and the metabolic complications of obesity. J Clin Endocrinol Metab 93: 64-73. 10. Rabe K, Lehrke M, Parhofer KG, Broedl UC (2008) Adipokines and insulin resistance. Mol. Med 2008; 14: 741-751. 11. Esteve E, Ricart W, Fernandez-Real JM Adipocytiknes and insulin resistance. The possible role of lipocalin-2, reginol binding protein-4 and adiponectin. Diabetes Care 2009; 32: 362-367.
12. Graham TE, Yang Q, Blüher M, et al. Retinol Binding protein 4 and insulin resistance in lean, obese and diabetic subjects. N Engl J Med 2006; 354: 2552-2563.
13. Klöting N, Hraham TE, Berndt J et al. Serum retinol binding protein is more highly expressed in visceral than in subcutaneous adipose tissue and is a marker of intra-abdominal fat mass. Cell Metab 2007; 6: 79-87.
14. Bajzová M, Kováciková, Vĭtková M et al. Retinol-binding protein 4 expression in visceral and subcutaneous fat in human obesity. Physiol Res 2008; 57: 927-934.
15. Ost A, Danielsson A, Lidén M et al. Retinol binding protein 4 attenuates insulin-induced phosphorylation or IRS and
ERK1/2 in primary human adipocytes. FASEB J 2007; 21: 3693-3704.
16. Munkhtulga L, Nagashima S, Nakayama K et al. Regulatory SNP in the RBP4 gene modified the expression in adipocytes and associated with BMI. Obesity 2010; 18: 1006-1014. 17. Van Hoek M, Dehghan A, Zillikens MC et al. An RBP4 promoter polymorphism increases risk of type 2 diabetes. Diabetologia 2008; 51: 1423-1428.
18. Wu Y, Li H, Loos RJ et al. RBP4 variants are significantly associated with plasma RBP4 levels and hypertriglyceridemia risk in Chinese Hans. J Lipid Res 2009; 50: 1479-1486.
19. Kovacs P, Geyer M, Berndt J et al. Effects of genetic variation in the human retinol binding protein-4 gene (RBP4) on insulin resistance and fat depot-specific mRNA expression. Diabetes 2007; 56: 3095-3100.
20. Hu C, Jia W, Zhang R et al. Effect of RBP4 gene variants on circulating RBP4 concentration and type 2 diabetes in a Chinese population. Diabet Med. 2008; 25: 11-18.
21. Ruano M, Silvestre V, Castro R, et al. HOMA, QUICKI and MFfm to measure insulin resistance in morbid obesity. Obes Surg 2006; 16: 549-553.
http://www.ijSciences.com Volume 2, Issue July 2013
111
Table 1. The anthropometrical and biochemical characterization of type 2 diabetic patients and healthy controls. Values represent mean±SD
a
Standard deviation
b
Comparison between IR and control group
c
Comparison between IS and control group
d
Comparison between IR and IS n.s. non significant
Table 2. Allele and genotype frequencies of analyzed SNPs. The analysis was done with and without IR and IS classification.
RS ID ALLELE FREQUENCIES GENOTYPE FREQUENCIES Pa,b,c
(CHI2)
T2DM IR IS
Control T2DM IR IS
Control
rs375
8539
rs375
8538
A G
0,18 0,82
A G A G
0,16 0,84 0,20 0,80
A C
0,83 0,17
A C A C
0,84 0,16 0,85 0,15
A G
0,15 0,85
A C
0,92 0,08
A/A A/G G/G
0,01 0,33 0,66
A/A A/G G/G A/A A/G G/G
0,02 0,29 0,69 0,04 0,33 0,63
A/A A/C C/C
0,70 0,25 0,05
A/A A/C C/C A/A A/C C/C
0,69 0,29 0,02 0,79 0,12 0,09
A/A A/G G/G
0,01 0,29 0,70
A/A A/C C/C
0,83 0,17 0,0
n.s.a,b,c
0.0233a
0.0293b
n.s.c
a
Analysis done with IR and IS classification
b
Analysis done without IR and IS classification
c
Analysis between IR and IS n.s. not significant
Clinical feature Type 2 Diabetic Patients [Mean±SDa] IR IS
Healthy control
P (T Student Test)
IR vs Control. IS vs Control IR vs IS
Age [year] BMI [kg/m2] Glucose [mg/dl] Insulin [µU/ml] HOMA-IR QUICKI TG [mg/dl] IL-6 [pg/ml] TNF-α [pg/ml] Adiponectin [µg/ml]
55±9 33±9 160±50 16±11 5,8±4,14 0,303±0,02 204±145 26,7±44 5,25±1,0 5,35±2,2
53±7 29±6 135±54 4,9±3,3 1,4±0,77 0,378±0,04 142±61 18±8,4 3,6±1,5 5,3±3,8
50±10 24±4 93±13 6,12±6,3 1,52±1,1 0,391±0,04 111±62 22,6±23 4,7±1,7 8,0 ±3,6
0.0015b, n.s.c,d
1.18E-12b, 0.00022c 0.02039d 8.14E-20b, 1.02E-10c 0.05365d 0.00011b, n.s.c 2.1E-05d 2.0E-06b, n.s.c 2.1E-06d 3.3E-18b, n.s.c 1.2E-13d 0.00862b, n.s.c 0.05165d 0.01578b n.s.c,d
http://www.ijSciences.com Volume 2, Issue July 2013
112
0 5 10 15 20 25 30 35 40 45
N
o
o
f c
e
ll
s
Area of surface [pixele^2]
0 10 20 30 40 50 60 70
N
o
o
f c
e
ll
s
Area of surface [pixele^2]
0 0,1 0,2 0,3 0,4 0,5
0 0,5 1 1,5 2 2,5
Q
U
IC
K
I
RBP4 mRNA level RBP4-B RBP4-G
RBP4-B RBP4-G
0 1 2 3 4 5 6 7
0 1 2 3
H
O
M
A
-IR
RBP4mRNA level
RBP4-B RBP4-G
RBP-B RBP-G
0 1 2 3 4 5 6 7
GUS-B B-actin
m
R
N
A
l
e
ve
l
CONTROL IS IR
Figure 1. Comparison of adipocytes size: A – BMI > 35 kg/m2 (obese), B – BMI < 25 kg/m2 (lean).
A B C
Figure 2. A – Comparison of the RBP4 gene expression levels between examined groups normalized to
http://www.ijSciences.com Volume 2, Issue July 2013
113
0 0,5 1 1,5 2
GUS-B B-actin
F
old
of
c
hang
e
C IS IR
0 1 2 3 4 5 6 7
0 2 4 6
R
B
P
4
m
R
N
A
le
v
el
SLC2A4 mRNA level
Normalization to GUS-B
0 1 2 3 4 5 6 7 8
0 2 4 6
R
BP
4
m
R
N
A
le
v
el
SCL2A4 mRNA lev el
Normalization to B -actin
0 0,5 1 1,5 2 2,5 3
G/G A/A A/A C/C
rs3758539 rs3758538
m
R
N
A
lev
le
[norm
ali
zed
to
GU
S
-B]
C IS IR
0 0,5 1 1,5 2 2,5
G/G A/A A/A C/C
rs3758539 rs3758538
m
R
N
A
lev
el
[nor
m
ali
zed
to
B
-ac
tin]
C IS IR
A B C
Figure 3. The SCL2A4 gene expression rate in adipose tissue of tested groups (IS – insulin sensitive, IR – insulin resistant) (A), the correlation between RBP4 and SLC2A4 genes expressions rate normalized to
GUS-β (B) and β-actin (C).
A B