An SVM-Fuzzy Expert System Design For
Diabetes Risk Classification
Thirumalaimuthu Thirumalaiappan Ramanathan , Dharmendra Sharma
Faculty of Education, Science, Technology and Mathematics University of Canberra, Australia
Abstract: Risk classification is a major technical challenge in medical diagnosis and chronic illness management. Various computational techniques have been developed for risk classification in recent years. This paper presents an approach combining support vector machines (SVM) and fuzzy modelling (SVM-Fuzzy). The goal is to evaluate the proposed design for better accuracy in risk classification and to investigate training the machine learning algorithm using sample real world data. A goal is also to determine efficiency in classification by optimizing selection of right sized datasets through experiments. Diagnosis of diabetes mellitus (Type 2 diabetes) is the motivating problem for risk classification. Fuzzy reasoning is used to classify the level of risks from data. SVM is used to design the fuzzy rules. Pima diabetes dataset is used to train the SVM and for testing the fuzzy system. The experiments from the model show promising results.
Keywords: Health informatics, soft computing, fuzzy logic, support vector machines
I. INTRODUCTION
Diabetes Mellitus (DM, Type 2 diabetes) is a chronic condition marked by elevated levels of blood glucose. It is a group of metabolic diseases in which a person has high blood sugar, either because the pancreas does not produce enough insulin, or because cells do not respond to the insulin that is produced. Diabetes is a condition where there is too much glucose, a type of sugar, in the blood. There are two main types of diabetes – Type 1 and Type 2. Type 1 diabetes results from the body's failure to produce insulin, and currently requires the person to inject insulin or wear an insulin pump. Type 2 diabetes results from insulin resistance, a condition in which cells fail to use insulin properly, sometimes combined with an absolute insulin deficiency. The prevalence of diabetes is increasing at a fast pace due to obesity, in particular, central obesity, physical inactivity, and unhealthy dietary habits [1]. In diabetes patients different organ are under stress and are influenced by the altered metabolic condition. Hence the ailment has to be properly managed within stipulated guidelines to minimize other health complications caused by diabetes and to assure longevity of life. In addition to health and social issues, diabetes management also costs individuals significantly. Diabetes costs the Australian Government and Australian taxpayers more than $6 billion per year and it is the fastest growing chronic illness in Australia, with numbers set to more than double from 1.5 million to 3.5 million in the next 20 years if nothing is done to address the burgeoning pandemic [2]. Classification systems have been widely utilized in medical domain to investigate and model patient’s data and extract a predictive
model. They help physicians to improve their prognosis, diagnosis or treatment planning procedures.
Fuzzy expert system differs from machine learning techniques in risk classification by giving approximate reasoning rather than exact. Both attempt to derive insights from data to inform future action or response. The fuzzy sets and rules decide the performance of the fuzzy system. In this paper, support vector machine (SVM) based fuzzy system design is proposed where SVM is used to design the fuzzy rules and the proposed system is able to give better classification in diabetes risks. There may be millions of diabetes data available. An investigation is also done on an optimum sized subset of dataset that is sufficient to train the machine learning algorithm for giving better classification.
II. RISK AND CLASSIFICATION
Risk is an uncertain event or condition that, if it occurs, has an effect on losing something of value [3]. In the terminology of machine learning, classification is considered an instance of supervised learning, i.e. learning where a training set of correctly identified observations is available [4]. Classification is the problem of identifying to which of a set of categories (sub-population) a new observation belongs, on the basis of a training set of data containing observations (or instances) whose category membership is known. Risk classification is the formulation of different premiums for the same coverage based on group characteristics. Risk classification is defined as grouping of different risks according to their estimated cost or likely impact, likelihood of occurrence, countermeasures required, etc. [5].
Type 2 Diabetes Mellitus (T2DM) could be managed by following proper lifestyle guidelines. Computational techniques can help T2DM patients by letting them know their risk level.
III. DATASET
models through machine learning algorithms. The first group contains first 100 people data of the dataset. The second group contains first 400 people data of the dataset. The third group contains 100 people data that were selected randomly from the dataset. The fourth group contains 50 people data from the dataset which are different from the first three group people data. SVM was trained by the first three group of dataset individually and the fourth group dataset was used to test the performance of the system.
IV. SVM-FUZZY SYSTEM
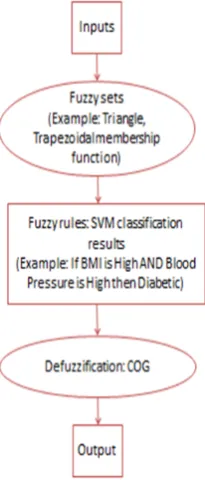
A novel design (see Figure 1) is proposed for the SVM-Fuzzy system (SVM-SVM-Fuzzy). The Mamdani type fuzzy expert system design is followed. SVM is used to design rules in the fuzzy system by using the SVM classification in the rule inference. SVM is trained by Pima Indian diabetes dataset accessible from [6]. Figure 1 show the top level design of the various components of the proposed system. The inputs are fuzzified into fuzzy sets followed by reasoning with the fuzzy sets using rules which are designed using SVM classification results. Then the output fuzzy sets are defuzzified into crisp value.
Figure 1: SVM based Fuzzy expert system architecture
A. SVM -Fuzzy algorithm
The following algorithm captures the SVM-Fuzzy design.
{Inputs: Glucose concentration (GC), serum insulin (SI), blood pressure (BP), body mass index (BMI)
Outputs: Points between 0 and 85, Diabetic (D): (0-50), Non-Diabetic (ND) (35-85)}
For each input and output {Input: GL, SI, BP, BMI; Output: D or ND}
Create fuzzy sets (); {Create fuzzy sets , ,….., using triangular and trapezoidal membership function}
For each input fuzzy set
Evaluate Median_ ; {Median_ : Median value of range in fuzzy set
= Median_ ; { = Input for SVM classifier assigned from fuzzy set }
Train SVM (); {Train SVM using Pima Indian Diabetes dataset}
For each possible combination of binary inputs
SVM-Classify = ( , ); {SVM classification for binary inputs (GC, SI), (GC,B P),(GC, BMI), (SI, BP), (SI, BMI), (BP, BMI)}
Add SVM results to fuzzy rule base ();
Fuzzy rules (); {Apply fuzzy rules to fuzzy sets ( , ,….., ) }
Defuzzification (); {Defuzzify output fuzzy sets to crisp output center of gravity (COG) algorithm}
End
The inputs to the system are 2-hour serum insulin (muU/ml), body mass index (BMI) (kg/m^2), plasma glucose concentration, diastolic blood pressure (mmHg). The output is eitherdiabetic or non-diabetic. For each input fuzzy sets are created (BMI (VLow, Low, Medium, High), plasma glucose level (VLow, Low, Medium, High), blood pressure (VLow, Low, Medium, High), serum insulin (VLow, Low, Medium, High)). The fuzzy sets are calculated using triangular and trapezoidal membership function from SVM. SVM is trained by pima dataset. The SVM classification is used for each fuzzy rule as per the above algorithm. The fuzzy rules are used to give inferences. Defuzzification is done to the fuzzified output to crisp output value using Centre of Gravity (COG) method which is described in Section IV.D. The output value is either the person is diabetic or non-diabetic.
B. Fuzzy sets
The triangular and trapezoidal membership functions are used in the fuzzy sets.
A triangular MF [9] is specified by three parameters {a, b, c} as follows:
A trapezoidal MF [9] is specified by four parameters {a, b, c, d} as follows:
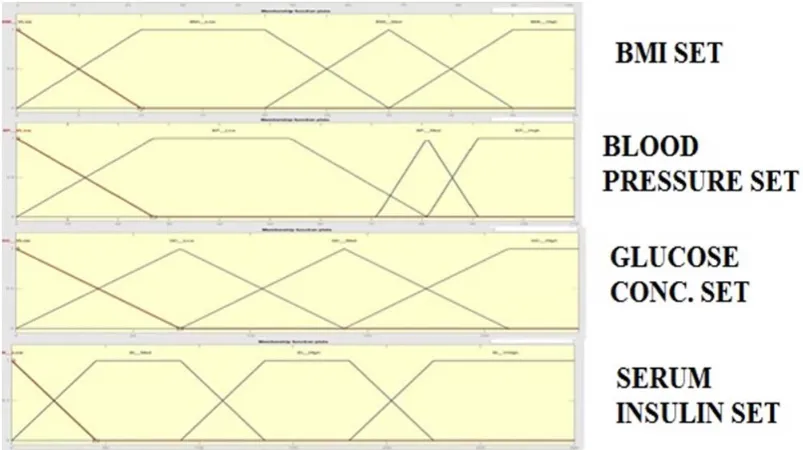
Figure 2: Fuzzy sets for the inputs BMI, BP, glucose conc., serum insulin.
Figure 2 shows the fuzzy sets using triangular and trapezoidal membership functions for the input BMI, blood pressure, glucose level and insulin. Fuzzy sets created for the input BMI are Very Low, Low, Medium, High. The sets Very Low and BMI-Medium are created using triangular membership function. The sets BMI-Low and BMI-High are created using trapezoidal membership function. Fuzzy sets created for the input blood pressure (BP) are BPVery Low, BPLow, BP -Medium, High. The sets Very Low and BP-Medium are created using triangular membership function. The sets BP-Low and BP-High are created using trapezoidal membership function. Fuzzy sets created for the input glucose concentration (GL) are Very Low, Low, Medium, High. The sets Very Low, GL-Low and GL-Medium are created using triangular membership function. The set GL-High is created using trapezoidal membership function. Fuzzy sets created for the input serum insulin (SI) are Very Low, Low, SI-Medium, SI-High. The set SI-Very Low is created using triangular membership function. The sets Low, SI-Medium, SI-High are created using trapezoidal membership function.
Figure 3 Classification fuzzy set
Figure 3 shows the fuzzy sets using trapezoidal membership function for the output classification. Fuzzy sets created for the output are diabetic and non-diabetic.
Below table shows fuzzy sets range of input and output field
Table 1: Fuzzy sets and their ranges
Input and Output field Range Fuzzy sets
I/P: 2-hour serum insulin
(-45) – 45 0 - 130 95 - 230 180 - 350
Very Low Low Medium High
I/P: Body mass index
(-10) – 10 0 - 30 20 - 40 30 – 60
Very Low Low Medium High
I/P: Plasma glucose conc.
(-70) – 70 0 - 130 70 - 210 130 - 330
Very Low Low Medium High
I/P: Diastolic blood pressure
(-25) – 25 0 - 60 70 - 90 80 - 120
Very Low Low Medium High
O/P: Classification 0 – 50 35 - 85
Non-Diabetic Diabetic
Table 1 shows ranges for all the created fuzzy sets. The ranges for these sets are chosen based on medical research papers [7] [8].
C. Fuzzy Rules
Figure 4: Training (a) serum insulin, BMI (b) serum insulin, glucose conc. (c) serum insulin, blood pressure (d) BMI, glucose conc. (e) BMI, blood pressure (f) glucose conc., blood pressure, from first group dataset to group under the output
class
Figure 5: Training (a) serum insulin, BMI (b) serum insulin, glucose conc. (c) serum insulin, blood pressure (d) BMI, glucose conc. (e) BMI, blood pressure (f) glucose conc., blood pressure, from second group dataset to group under the
output class
Figure 6: Training (a) serum insulin, BMI (b) serum insulin, glucose conc. (c) serum insulin, blood pressure (d) BMI, glucose conc. (e) BMI, blood pressure (f) glucose conc., blood pressure, from third group dataset to group under the output
The median value of range for all input fuzzy sets are calculated and given as inputs to the SVM classifier. Based on these training of different sized group of datasets, the SVM performs classification. First SVM classifications were done to the inputs based on training from first group dataset which contains 100 people data. Then SVM classifications were done to the inputs based on training from second group dataset which contains 400 people data. Then SVM classifications were done to the inputs based on training from third group dataset which contains 100 people data which was picked up randomly from the Pima dataset. The SVM classification results were saved and designed as rules in the fuzzy rule base. As the SVM do classification for binary inputs, each fuzzy rule created contains binary inputs and their inference.
For the eighteen input fuzzy sets, totally 96 rules have been used from SVM classification for the fuzzy expert system. An example rule is
SVM is used to classify the inputs glucose level and blood pressure using median value of their fuzzy sets range. Median value of glucose level-High (mf) = 144 {mf: membership function}
Median value of blood pressure-High (mf) = 114 SVM-classification (144, 114) = diabetic
Rule: If glucose level-High AND blood pressure-High then diabetic.
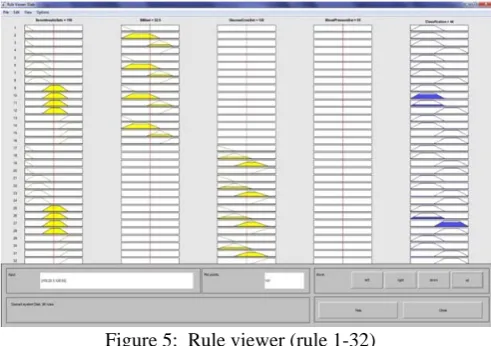
Below figures (Figure 5) shows the sample rule viewer from the MATLAB for the fuzzy system designed from SVM classification trained using first group dataset.
Figure 5: Rule viewer (rule 1-32)
Figure 5 shows the first 32 rules of the total rules which are created using SVM classification results. The first, second, third, fourth column in the figure are inputs serum insulin, BMI, glucose conc., blood pressure respectively. The fifth column is the output classification.
D. Defuzzification
The fuzzified outputs are defuzzified into crisp output values using Centre of Gravity (COG) [10]. Figure 6 illustrates the COG method. The centroid technique appears to provide consistent results. This is a well-balanced method sensitive to the height and width of the total fuzzy region as well as to sparse singletons. In this approach,
each membership function is clipped at the corresponding rule firing strengths. The centroid of the composite area is calculated and the horizontal coordinate is used as the output of the controller [10].
This method is also known as center of gravity or center of area defuzzification. This technique was developed by Sugeno in 1985. This is the most commonly used technique and is very accurate. The centroid defuzzification technique [11] can be expressed as
where x* is the defuzzified output, µi(x) is the aggregated
membership function and x is the output variable.
Figure 6: Center of Gravity method
V. PERFORMANCE
First three group of Pima diabetes dataset were individually used to train SVM. The fourth group of dataset which is different from the first three group data was used to test the proposed model. The proposed system resulted from training of three groups of dataset which contains small and large number of data, showed similar classification. The range for the output fuzzy set was chosen randomly and was divided into two half for diabetic and non-diabetic classification. Then the output fuzzy sets were put in the fuzzy rules based on SVM classification results. The range of output set is 0 to 85 where the non-diabetic fuzzy set is 0-50 and the diabetic fuzzy set is 35-85. To confirm whether the output classification is correct, the outputs were compared with the Pima dataset output class. For example, if the output of a person data is within diabetic fuzzy set range, then the Pima output class must be diabetic for the same data. The outputs are in term of points between 0 and 85. The output which falls between 0 and 50 is taken as diabetic and the output which falls between 35 and 85 is taken as non-diabetic to compare them with Pima output class for correctness.
The classification accuracy is calculated using True positive, False positive [12] and True negative, False negative [13] as below
Classification accuracy = (TP+TN) / (TP+TN+FP+FN) where
prediction is p and the actual value is also p. then it is called a true positive (TP)
True Negative (TN): These are the negative tuples that were correctly labeled by the classifier.
False Positive (FP): These are the negative tuples that were incorrectly labeled as positive. However if the actual value is in then it is said to be false positive (FP).
False Negative (FN): These are the positive tuples that were mislabeled as negative.
The proposed system design showed classification accuracy of 96%. Out of 50 input data, 48 showed correct classification. Some input data falls between the points 35 and 50 which can be taken as both non-diabetic and low risk diabetic. As the fuzzy system output is in terms of points between the given ranges, it is taken as the degree of risks for the person data.
VI. Conclusion and further work
For diabetes risk classification, the machine learning algorithms like Artificial Neural Network [14], Bayesian Network [15] was applied in the recent years. The drawbacks with these machine learning algorithms is their lack of ability for dealing with the input data that are uncertain and incomplete. The fuzzy logic is a technique which is able to handle uncertain input data by approximate reasoning. But the fuzzy logic should also need to make use of the dataset of sample cases in risk classification.
A computational model which combines machine learning algorithm with fuzzy reasoning was designed, implemented and validated. This gave better classification and promising outcomes. Although the Neuro-Fuzzy system [16] has been applied for diabetes risk classification before, the proposed model in this paper which is a combined approach of SVM and fuzzy logic (SVM-Fuzzy) that make use of machine learning algorithm in the fuzzy rule base is able to give better classification accuracy than the neuro-fuzzy system. The newly proposed approach of SVM and fuzzy reasoning (SVM-Fuzzy) shows 96 % accuracy in diabetes risk classification. The fuzzy reasoning performs better when using sample cases extracting through machine learning techniques like SVM and a small proportion of dataset is enough to train the machine learning techniques as shown with this system results. For some data, the solution may be unpredictable and uncertain, here fuzzy reasoning helps by classifying them according to their degree in the output range. Below are the outcomes from this research
Combining approach of SVM of fuzzy reasoning design.
The proposed design showed high accuracy in risk classification.
The degree of risks is classified.
The experiments from the model showed that a relatively small subset of dataset was sufficient to train the machine learning algorithm. The full dataset is very large and would be inefficient. A small subset produced the same outcomes but more efficiently.
Future work will include developing incremental learning using SVM-Fuzzy and applying SVM-Fuzzy to bioinformatics analytics to extract classification pattern from protein structure as another case study.
REFERENCES
[1] M. Uusitupa, “Lifestylematter in prevention of type 2 diabetes,” Diabetes Care, vol. 25, no. 9, pp. 1650–1651, 2002.
[2] Government must act now to stop diabetes. n.d. Available from <http://www.diabetesaustralia.com.au/Documents/DA/Media%20Re leases/Diabetes%20National%20Election%20Agenda%202013-2015%20media%20release.pdf>
[3] A Guide to the Project Management Body of Knowledge (4th Edition) ANSI/PMI 99-001-2008
[4] Alpaydin, Ethem (2010). Introduction to Machine Learning. MIT Press. p. 9. ISBN 978-0-262-01243-0
[5] Business Dictionary. n.d. Available from
<http://www.businessdictionary.com/definition/risk-classification.html>
[6] Frank, A. & Asuncion, A. (2010). UCI Machine Learning Repository [http://archive.ics.uci.edu/ml]. Irvine, CA: University of California, School of Information and Computer Science.
[7] Diagnosis of Diabetes and Prediabetes. n.d. Available from <http://diabetes.niddk.nih.gov/dm/pubs/diagnosis>
[8] Diabetes and High Blood Pressure. n.d. Available from <http://www.patient.co.uk/health/diabetes-and-high-blood-pressure> [9] Zadeh, L.A. (1965). "Fuzzy sets". Information and Control 8 (3):
338–353. doi:10.1016/s0019-9958(65)90241-x
[10] Engelbrecht, Andries P. Computational intelligence: an introduction. John Wiley & Sons, 2007.
[11] Sugeno, M. (1985). An introductory survey of fuzzy control. Inf.
Sci.: 36: 59-83.
[12] Sapna Jain E.M Afshar Aalam3. M.N Doja, “K-Means Clustering
Using Weka Interface”, Proceeding of the 4th National Conference;
INDIA Com-2010 Computing For Nation Development, February 25-26, 2010
[13] Jiawei Han, Micheline Kamber, Jian Pei, “Data Mining Concepts
and Techniques” Third edition.
[14] Rajeeb Dey and Vaibhav Bajpai and Gagan Gandhi and Barnali Dey, ”Application of artificial neural network technique for diagnosing diabetes mellitus”, 2008 IEEE Region 10 Colloquium and the Third ICIIS, Kharagpur, INDIA December 8-10
[15] Mukesh Kumari et al “Prediction of Diabetes Using Bayesian Network” (IJCSIT) Vol.5 (4), 2014, 5174-5178