On the ATM Adaptation Layer
Arne A.
Nilsson
Zhi
Cui
Center for Communications and Signal Processing
Department of Electrical and Computer Engineering
North Carolina State University
TR-92/21
On the ATM Adaptation Layer
Arne A. Nilsson and Zhi Cui
Center for Communications and Signal Processing
Dept. of Electrical
and
Computer Engineering
North Carolina State University
Raleigh, N.C. 27695-7914
Abstract
The impact of the Convergence Sublayer Protocol Data Unit (CSYDU) size on the end-to-end network delay ina B-ISDN environment i$ inuestiqaiedin thu
paper. Cell loss probabilities are assumed to be bur&ty and when a cell loss occur" a retransmission U
(1$-sumed to happen at the CSYD U level. The cell 1066
probability is assumed to be sucb: that there are two different probabilities for cell loss, Typically the cell
10""probability i" very "mall, in a real ATM network
10-9 or better. There are however instances when the cell 10"" probability will be "ignificantly higher due to network conqesiion, such: as buffer overflow, .,ay a cell
10"" probability of 10-3• An ATM network, for sim-plicity consistinq of one ~ingle link, has been simulated and the simulation results indicate that it i., possible to "elect a CSYD U size that will minimize the end-to-end delay. The ATM network has also been ana-lyzed by u&ing mathematical modeling technique. Our fir.,t mathematical analy.,i$ approach assumed naively a Poisson arrival process, The resuliinq closed queue-ing network uias solved approzimately and an ezpres-"ion for the end-to-end delay as a function of the CSYD U size uias obtained. It WtU then shoum that
the delay is optimized for a particular CSYD U size. For high "peed netuiorks, burstiness is a very impor-tant factor for "ystem end-to-end delay and thus a Poisson arrival process is not a reasonable assump-tion, furthermore batch arrivals of CSYD U should also be considered. It i" found that queueing model"
are IBP[2]/GEO/1/K and IBP(z]/D/l/K "y~terru.
Numerical results for queue length distribui ions and "y"tem end-to-end delay6 for both queueing ~y"teffi$
have been obtained and are used to obtain the optimal CSYDU size.
1
Introduction
The Asynchronous Transfer Mode (ATM) has been proposed as a fast packet switching and multiplexing
technique for broadband ISDN. In an ATM network
,
all information ranging' from narrowband voice and data traffic to broadband video traffic is transmitted using a fixed size "cell". The ATM Adaptation Layer (AAL) isolates the higher layers from the specific char-acteristics of the ATM layer by mapping the higher layer Protocol Data Units(PDUs) into the
informa-tion field of the ATM cell and vice versa
[1] [2].
Inhigh speed networks,it is most likely that the traffic
is highly bursty and packet sizes at the transport level
will be fairly large (64KB~tes to a few Megabytes).
Since ATM cells only have a payload of 48 bytes or
44 bytes, this implies a segmentation and reassembly
process involving potentially tens of thousands of cells per packet. For a transport layer protocol, without error correction capabilities which retransmit errored USER-PDUs, significant operational issues arise such as: how to deal with lost cells, how to reduce the
sys-tem end-to-end delay, etc.
[3].
In this paper, we propose an intermediate segmen-tation technique as a method to break up large trans-port layer packets into several sub-packets to reduce
packet end-to-end delay. A critical design issue is to
determine the optimal sub-packet size. In section2,we
describe the system and queueing modelin detail and
present simulation result for the optimal sub-packet
size. For high speed networks, burstiness is a very
im-portant factor for system end-to-end delay and thus a Poisson arrival process is not a reasonable assump-tion, furthermore batch arrivals of CS-PDU should
also be considered. Itisfound that the queueing
mod-els that we need to solve are IBP[z]/GEO/1/K and
IBP(gJ]/D/l/K queues. In Section 3, numerical
re-sults for queue length distributions and system time
2.4
Simulation
Figure 1: ATM Network Architecture.
high and this, of course, happens when the amount of
informationin the networkissignificant.
wrer~
cerrect
NAK
DEST.
A
~
reass2o o DELAY
I prop2
I 0 I
I - J
I I cell IC:J: I I
I
h1gher prlor1ty
Y;~:~:u
Sh'lt2
bufferU
source.1:·
The AAL consists of two sub-layers: Convergence Sub-layer(CS) and Segmentation And Re-assembly
Sublayer(SAR)
[4].
In CS, a big packet is brokenup into several sub-packets so called CS-SDU:s. By adding headers and trailers to the CS-SDU, a CS-PDU
is formed [7]. At the receiving side of the network,
these CSJ>DUs will be reassembled to packets. In the
SAR-sublayer, we segment the CS.J>DU into a size suitable for the information field of an ATM cell, and
reassemble the contents of ATMcellinformation fields
into CS information.
section 4, the analytical results for system end-to-end delay and optimal CS-PDU size are obtained based uponIBP[(lJ]/GEO/1/Kand IBP[(lJJ/D/1/Kqueues.
In this section, we describe in detail the CS-PDU
and network architecture, cell-error probability and simulation result for the end-to-end delay as a function of CS.J>DU size.
2
Model description
2.1
AAL and CS-.PDU
2.2
Queueing Network Architecture.
Based upon the AAL functions, the queueing
net-work structure, as shown in Figure 1, can be
de-rived. At the source, we use queues split1 and split2 to simulate the functions of the CS and SAR-sublayers,
respectively. Cells are transmitted into the
ATM-network which is assumed to have finite capacities and low cell loss probability. At the destination, the cells are reassembled to CS..PDU and packets. IT an error happens either by cell loss or by bit error, the
partic-ular CS.J>DU will be retransmitted.
2.3 Error Probability
Given a cell loss probability behavior as above, we simulate the queueing network [see Figure 1] to find the mean end-to-end delay.and maximum end-to-end
delay in terms of the CSYDU size. The simulation
result is presented in Figure 2, From the simulation
result, we can conclude:
1)
the mean end-to-end delay depends upon theer-ror probability distribution and CSJ>DU size; 2) an optimal CS..PDU size under a given cell loss dis-tribution can be found;
3)
CSJ>DU size has much more influence on themax-imum end-to-end delay than on the mean end-to-end delay.
Inhigh speed networks, fiber optics isoften the
se-lected transmission medium. It iswell known that in a
fiber optic based network, the probability of bit erroris
very low, typically less than 10-9• Therefore it ismore
likely that an ATM cellwillbe lost or destroyed due to
buffer overflow or a lack of some network resource. We have adopted as a model for the probability of cell loss
a simple two state model. In one of the states the cell
loss probabilityis very small, typically negligible, and
this happens when the amount of information in the
network issmaller than the network system capacity.
In the other state the cell loss probabilityis typically
3
IBP[z]/GEO/l/K
and
IBP[:r:]/D/l/K
queues
3.1 Arrival process
0.4
40 eo 80 , ofcustomers In system 20
0.3
--
bukgeop 1.0."--+-- bukgeop1.0.Q
.c
----
buk geo p1•.75tit
c: bukgeop1•.55
..!
.
0.2 j
.
jrr
0.1
• average delay
•
loading=0.40
average packet size = &3950 byte. 20000
o;---,----,--...--~-.__.-__ 2000 3000 4000 5000 6000 7000
cs-pdu size (byte.)
Figure 2: Maximum to-end delay and mean end-to-end delay
Figure
3:
IBP(z] /GEO/1/
K queue lengthdistribu-tion
longer be suitable for describing the network traffic. An Interrupted Bernoulli Process (IBP) captures the burstiness of the arrival process and may therefore be a good candidate for modeling the arrival process. IBP
is a generalization of the Bernoulli process. It is
gov-erned by a discrete time Markov chain with two states,
an active state and an idle state. If the process is in
the idle state (active state), then in the next time slot it remains in the idle state (active state) with
proba-bility q (p), or it will change to the active state (idle
state) with probability l-q (l-p). Inthe idle state, no
arrival occurs. In the active state, arrivals occurin a
Bernoulli fashion with rate cr. Furthermore, because
the big packet is broken up into several CSJ>DUs at CS layer, the arrival process is characterized by IBP
with bulk arrival denoted by IBP[2]. The bulk sizeis
assumed to be geometrically distributed with failure probability pl.
3.2 Queue length distributions for the
IBP[z]jGEOjljK
andIBP[:Z:]/D/l/K
queues
1) a state change between active and idle; this can
only happen at the beginning of the current slot, or, 2) customer arrival; this can only happen after the po-tential active-idle state change point, or,
3)
customer departure, this can only happen at theslot point.
Let us denote by (T the service rate in the
IBP[~]/GEO/1/Kqueue. By solving the Global
Bal-ance Equations of2(K+1)state Markov chain, we
ob-tain the analytical result for queue length
distribu-tion ofIBP[~]/GEO/1/Kqueue. Figure 3shows the
queue length distribution of the IBP(z] /GEO/1/K
queue for the given parameters p, q, a .
When the system service time is constant, i.e.,
(T =1, IBP(z]/GEO/1/K queue can be reduced to
IBP[z]/D/l/K. The result for the queue length
dis-tribution of IBP[z] /
tin]
K queue be obtainedsimi-larly as for the IBP[~]/GEO/l/Kqueue.
4
Analytical
results
In order to get steady state queue length
distribu-tion ofIBP[2]/GEO/l/K queue, we observe the
sys-tem at the slot points and construct the Markov chain.
In this Markov chain, there are 2(K+l) states denoted
by
(m,A)
and(m,I)
(m=O,l, ... ,K), where(m,A)
repre-sents an active state withm customers in the system;
[m.I)represents an idle state with mcustomersin the
system. The state changes can only be caused by:
Having developed a method to solve highly bursty traffic system, we can use the technique obtained above to evaluate the mean end-to-end delay of the
ATMnetwork analytically. We first simplify the
orig-inalnetwork [Fig.
1]
to the queueing model showninFigure 4.
Figure 4: Analytical queueing network model 1000 10000 12000 loading =0.40
average packet aiz8
=
250 Kbyte.!
340000~
330000s
I 320000
c
~ 310000
..
"0 "0
C
!
300000-0
e
.
2iOOoo.
;
> 280000 C8000
A.X
1- Pretx,
Pretx,
(3) 0
"'--- ~O...
-A.X
CS·PDU size (bytes)
It is apparent that P"eTzis a function ofPbloell, and
vice versa. Given an initial value ofP"eT~,P"eTz and
P.,.ob(l"etl"ansmitting a CSJ' DU)
Pbloell
+
Pbit-e,,1'O'rProb( C SJ' DUsal"e blocked at point B)
K
LBj(l- cS-;nU)K_j
j=O
N1+N2+N3
A
avel"age numbe1'0
4
/ -C SY DU8 in netw01'k
A D
(1 - P"eTz)
*
C S-P DU*
J1-p •AX
Pbloell can be obtained iteratively, andwillconverge to certain values. Let D be the mean end-to-end delay
for a message. For an open queueing network [Fig.
4],
according to Little's result
[6]
Figure 5: Analytical result for average end-to-end de-lay
Fig. 5. shows the numerical result for the mean
end-to-end delay as a function ofCS-PDU size, from which
the optimalCS-PDU size is obtained.
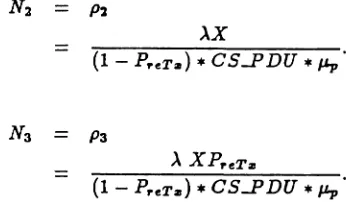
where N, is the average number of CSJ>DUs in
queue i. Nl can be obtained numerically from
Sec.3, by solving the queue length distribution of
IBP[z]/D/l/K with parameters p,q,at. For the
queues 2 and3 the model usedis the M/M/oo
transmission time
/01'
one C S-P DU;=
yropagation delay.K B·
,
1
J.l. 1
J.l.p
1('j,l
where CSJ>DU in this equation indicates the length
of the protocol data unit, and B; is the probability
that an arrival finds j CS-PDU:s in the system;
(1('j,lP
+
1('j,2(1 - q))(2 - p - q).l - q ,
the bu
f
f
er size in CSJ'DU;Pl"ob(j CSYDUs in system, at A state); Pl"ob(j CSYDUs in sylTterp" at I state);
size are Aand X, respectively. The arrival process
to point A is assumed to be IBPlz] with
parame-ters p,q,a; The bulk size is geometrically distributed
with mean X/CS-SDU, where CS-SDU is used to de-note the length of the service data unit. The arrival
process, IBPJz] at point B, is the superposition of
the feedback arrival process and the,IBPlz]. We use
an IBPJ~]/D/l/K to model queue1 approximately,
where the IBPJ~] has the same bulk size distribution
and the same parameters p,q as IBPlz]has, and with
a l
=
a/(l-P"eTz).Furthermore we have
5
Conclusion
In this paper, we have presented results obtained
from a simulation program that permits us to demon-strate the effect of how big packets should be bro-ken up into smaller packets (sub-packets) before be-ing fragmented into ATM cells. For high speed
net-works, the queueing models IBP[a]/GEO/l/K and
IBP[2]/D/l/K were investigated, and numerical
re-sults for queue length distributions and system end-to-end delays for both queueing systems have been
ob-tained. This technique is used to obtain the optimal
CS.J>DU size.
References
[1]
S.E. Minzer, "Broadband ISDN and AsynchronousTransfer Mode (ATM)", IEEE Communications
Magazine, vol.27, no.D, 1989.
[2] M.
J. Rider, "Protocols for ATM Access Net-works", GLOBECOM, vol.1, 1988.[3] "VISTAnet: A Very High Bandwidth Prototype Network for Interactive 3D Medical Imaging",
Research: Plan by Bellsouili Services, GTE Corp., MCNC, UNC-Chapel Hill, 1990.
[4]
CCITT Recommendations Drafted by WorkingParty XVTII/8, no.6, 1988
[5] A. A. Nilsson F.-Y. Lai and H. G. Petros, "An
approximate analysis of a bufferless N
x
Nsyn-chronous Clos ATM switch", Proceeding$,
Cana-dian Conference on Electrical and Computer En-gineering, pp.39.1.1-39.1.4, 1990.
[6] L. Kleinrock, Queueing Sy!tem, Vol. I,John Wiley
&;Sons, Inc, New York, NY, pp.134-136, 1975.
[7] A. A. Nilsson and Zhi Cui, "ATM
Adapta-tion Layer Issues", Proceeding!, The
Twenty-Fourth Southeastern Sympo$ium on Sy!tem
![Figure 3: IBP(z] /GEO/1/K queue length distribu-tion](https://thumb-us.123doks.com/thumbv2/123dok_us/1618121.1200934/4.558.50.249.79.243/figure-ibp-geo-k-queue-length-distribu-tion.webp)