DOI: 10.1534/genetics.106.069658
Neutral Evolution of Multiple Quantitative Characters:
A Genealogical Approach
Cortland K. Griswold,* Benjamin Logsdon
†,1and Richard Gomulkiewicz*
,‡,2*School of Biological Sciences,†School of Molecular Biosciences and‡Department of Mathematics, Washington State University, Pullman, Washington 99164
Manuscript received December 13, 2006 Accepted for publication February 19, 2007
ABSTRACT
TheGmatrix measures the components of phenotypic variation that are genetically heritable. The structure ofG, that is, its principal components and their associated variances, determines, in part, the direction and speed of multivariate trait evolution. In this article we present a framework and results that give the structure ofGunder the assumption of neutrality. We suggest that a neutral expectation of the structure of Gis important because it gives a null expectation for the structure of Gfrom which the unique consequences of selection can be determined. We demonstrate how the processes of mutation, recombination, and drift shape the structure ofG. Furthermore, we demonstrate how shared common ancestry between segregating alleles shapes the structure ofG. Our results show that shared common ancestry, which manifests itself in the form of a gene genealogy, causes the structure of Gto be non-uniform in that the variances associated with the principal components ofGdecline at an approximately exponential rate. Furthermore we show that the extent of the nonuniformity in the structure of Gis enhanced with declines in mutation rates, recombination rates, and numbers of loci and is dependent on the pattern and modality of mutation.
P
HENOTYPIC evolution is channeled through pat-terns of heritable variation. This is exemplified by the breeder’s equation,R ¼h2S, which for a singlequan-titative trait states that the evolutionary response (R) to selection (S) of the trait is proportional to its herita-bility,h2(see,e.g., Falconerand MacKay1996; Lynch
and Walsh 1998). Likewise, the simultaneous
evolu-tionary responses of several potentially correlated quan-titative characters are predicted by the multivariate extension of the breeder’s equation, Dz¼Gb, where
Dzis a vector describing the responses of each character to selection,b—the selection gradient vector—describes the pattern of directional selection applied to the traits, andGis the additive-genetic covariance matrix describ-ing the heritable patterns of variation and covariation of the traits (Lande1979).
Quantitative geneticists and evolutionary biologists alike are particularly interested in the principal compo-nents of theGmatrix, since these indicate independent paths along which evolution can occur, and the variance associated with each principal component, since these modulate the speed of evolution along the direction of each principal component. For instance, the
‘‘evolu-tionary line of least resistance’’ for adaptive radiation (Schluter 1996) is defined by the principal
compo-nent ofGwith the largest variance,i.e., with the greatest amount of heritable variation. At the other extreme, principal components ofGwith the smallest variances represent evolutionary avenues with the greatest de-grees of genetic resistance (Kirkpatrickand Lofsvold
1992; Hineand Blows2006).
Since the Gmatrix itself can evolve, it is natural to consider the influences of evolutionary forces (such as selection, mutation, random genetic drift, and recom-bination) on the patterns of variation associated with the principal components ofG. For example, principal components with the smallest eigenvalues might reflect the strongest patterns of multivariate selection (e.g., Blowset al.2004; Hineet al.2004). Indeed, this is
ex-pected on general theoretical grounds (Lande 1980;
Landeand Arnold1983; Phillipsand Arnold1989)
and has been verified by computer simulations (Jones
et al.2003).
A second force that causes theGmatrix to evolve is random genetic drift. Phillipset al. (2001) showed that
severe inbreeding led to an average reduction in total variation of theGmatrix that was proportional to the theoretical expectation 1F, whereFis the inbreeding coefficient. Furthermore, the principal components of theGmatrices differed (in an apparently random way) among replicated inbred lines, although, on average, the Gmatrices across replicated inbred lines did not 1Present address:Department of Biological Statistics and Computational
Biology, Cornell University, Ithaca, NY 14583.
2Corresponding author:School of Biological Sciences, P.O. Box 644236,
Washington State University, Pullman, WA 99164. E-mail: [email protected]
differ from those of the outbred control population. Subsequent work by Whitlocket al. (2002) on the same
set of inbred lines showed that theG matrix in some lines continued to change over 20 generations of ran-dom mating, but there was no evidence that theG ma-trices were returning to the original state in the outbred control line. On the basis of work by Averyand Hill
(1977) and Zengand Cockerham (1991), Whitlock
et al. (2002) hypothesized that the subsequent changes inGmatrices in the generations following inbreeding were caused, in part, by the decay of linkage disequi-libria that were generated during the inbreeding epi-sode. Besides the force of recombination, theoretical work by Lande(1980) shows that mutational pressure
can also cause theGmatrix to evolve.
At equilibrium the proximate causes of the structure of aGmatrix are linkage disequilibria and the pleiotro-pic and nonpleiotropleiotro-pic effects of segregating mutations. The ultimate forces that contribute to the structure of theGmatrix are recombination, mutation, genetic drift, and selection (e.g., Phillipsand McGuigan2006). To
date, no theoretical work presents a neutral expectation for the structure of theGmatrix when the only forces shaping its evolution are mutation, recombination, and drift, although Lynch and Hill (1986) presented a
neutral model of the evolution of genetic variance for a single character. In the case of multiple characters Lynch (1994) and Phillips and McGuigan (2006)
postulate thatGwill evolve to be proportional toM, the mutational variance–covariance matrix.
The focus of this article is the question of how mu-tation, recombination, and random genetic drift deter-mine the eigenstructure of theGmatrix at equilibrium, where the eigenstructure of theGmatrix is measured according to its eigenvectors and eigenvalues. The ei-genvectors ofGare its principal components and the eigenvalues ofGare the variances associated with each eigenvector. Naı¨vely, for the case of free recombination among loci, one might expect that the eigenvalues ofG
would be proportional to those ofM, with drift-induced linkage disequilibrium and stochastic sampling fromM
causing nondirectional variation around this expecta-tion. Accordingly, if the eigenvalues ofMwere all simi-lar in size, then on average so would the eigenvalues of
G. We explore the validity of this intuitively reasonable expectation.
One of the main insights of this article is that this intuitively reasonable expectation is not valid. A primary reason is that segregating alleles in a population are related to one another due to shared common ancestry or, to put it another way, alleles are related genealogi-cally through shared common descent via reproduction. Patterns of shared common ancestry can be described for a sample from a population using Kingman’s (1982)
coalescent and multilocus extensions such as Griffiths
and Marjoram’s (1997) ancestral-recombination graph.
In this article we use the coalescent and the
ancestral-recombination graph as a framework to investigate neutral evolution ofG.
The neutral expectations developed here aid the in-terpretation and analysis of recent empirical work that showed significant additive genetic variance for 20 wing-shape characters inDrosophila melanogasterand an approx-imately exponential decline in the ordered eigenvalues of theGmatrix for these characters (Mezeyand Houle
2005). The exponential decline in ordered eigenvalues may be interpreted as signatures of either variable se-lection across characters and/or variable mutational heritabilities across characters. Our analyses show that, under the neutral model, the ordered eigenvalues ofG
will evolve toward a regular pattern. Surprisingly, even if the ordered eigenvalues ofMare perfectly uniform and selection is absent, the expected eigenvalues ofGin a sample from a population are predicted to decline at an approximately exponential rate.
METHODS
The model:We consider the evolution of a multivar-iate quantitative trait affected by multiple loci in a diploid population of sizeNwith Wright–Fisher random mating. (For nonideal populations,N¼Ne, the
variance-effective population size.) Evolution is neutral as we assume the trait experiences no selection. Alleles affecting the trait act additively within and across loci (i.e., no dominance, epistasis, or genotype–environment interactions). For example, ifxiandx9iare multivariate effects of maternally and paternally inherited alleles at locusi(e.g., the effects of each allele onmtraits), then the genotypic value g of a typical individual is
g¼P‘i¼1ðxi1x9iÞ, where‘ is the number of loci. The phenotype is z¼g1e, where e is an independent, mean-zero random variable. TheGmatrix is them3m
covariance matrix of additive values,g. We hereafter ig-noreebecause, in the absence of selection, it plays no role in the evolution of G. It is important to note, however, thatecan affect estimates ofG, which may af-fect predictions of the eigenstructure of any particular
G, especially for small samples from a population. We do not address this issue in this article and leave it for further study.
Under neutrality and additivity, three main processes influence G-matrix evolution: spontaneous mutation, recombination, and random genetic drift via stochastic re-production. In this article we focus on the recombination– mutation–drift equilibrium characteristics ofG. For spon-taneous mutation we examined two infinite-allele muta-tion models: the continuum-of-alleles model (Crowand
Kimura 1964; Kimura 1965) and the house-of-cards
model (Kingman1977, 1978). The continuum-of-alleles
mutational distribution. In our simulations we used a zero-mean multivariate normal distribution with covari-ance matrixAfor the distribution of mutational effects. The diagonal elements ofA are the variances in muta-tional effects and the off diagonals are the covariances of mutational effects on different traits. The house-of-cards model (Kingman 1978) assumes that each new
muta-tion completely replaces the current allelic effect at a mutated locus.
Coalescent approaches: Because the alleles contrib-uting togare neutral and every mutation is novel, the alleles at individual loci should follow the distribution expected at equilibrium for the infinite-alleles neutral model (see,e.g., Ewens2004). Rather than sample from
this distribution directly, we used a different but equiv-alent approach for n , N, where n is the sample size—the coalescent. The coalescent is useful in that it retains information about the underlying genealogical history of alleles. Thus it can be used to model how variation in allelic values is determined by patterns of shared common ancestry.
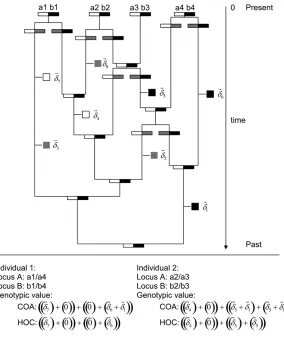
Coalescent with independent loci:Figure 1 illustrates the approach that we used to generate the genotypic values
gof individuals in a sample of sizenbased on the neutral coalescent (Kingman 1982). Loci were treated
inde-pendently. For each locus we generated a tree with 2n
tips and placed mutations on the tree using the standard neutral coalescent approach. (We employed the algo-rithm in the Appendix of Hudson1991.) When 1 unit
of coalescent time is scaled to be 2N generations, co-alescent events occur at a ratekðk1Þ=2 per coalescent time unit using the exponential approximation of a geometric process, wherekis the number of lineages present at a particular time back in history. Once a gene tree is drawn, branch segments in the tree have times associated with them as a result of the coalescent pro-cess. Mutations were randomly placed along branch segments such that the number of mutations along a branch segment of the coalescent tree was Poisson dis-tributed with mean 2Nmti, wheremis the haploid per lo-cus mutation rate andtiis the length (in coalescent time
units) of branch segment i. With each mutation, we then associated a vector of effects drawn from a multivariate normal distribution with mean 0 and covarianceA. A population was generated by randomly assigning two alleles from each locus (without replace-ment) to each of the n individuals. Note that this coalescent approach to generating individual geno-typic values imposes the strict rule that loci are completely independent; i.e., there are no transient linkage disequilibria.
The overall process is illustrated in Figure 1 for a sample of n¼2 individuals, each with two loci. Muta-tions in the coalescent tree are marked with hatch marks and the associated vector of effects is represented by~d. For locus A, allelesa1anda2are unmutated relative to the ancestral allele and, accordingly, have the ancestral value~0. Allele a3 is differentiated from the ancestral allele by one mutation and has the value~01~d3 ¼~d3.
The value of allelea4depends on the mutation model. For the continuum-of-alleles model, the value of a4is
~01~d
11~d2 ¼~d11~d2, but for the house-of-cards model,
the value ofa4is~01~d2¼~d2, since the later mutational
effect~d2 completely replaces the earlier effect~d1. The
allelic effects at locus B are determined similarly. Next, the alleles are randomly assigned two at a time, without replacement, to an individual. In Figure 1, allelesa1anda4at locus A and allelesb3andb4at locus B were assigned to the first individual. On the basis of the alleles sampled and the mutations in the gene tree, the genotypic value of the first individual is g ¼~d11
~d
212~d4 for the continuum-of-alleles model and g ¼
~d
212~d4assuming the house-of-cards.
Ancestral recombination graph: As stated at the outset, linkage disequilibria are also a proximate cause of additive-genetic covariances. Strictly applying indepen-dence among loci may therefore eliminate a factor promoting genetic covariances even when there is free recombination among loci. To allow for physical linkage among loci and for the possibility of linkage disequi-libria we used the ancestral recombination graph co-alescent approach (Griffiths 1981, 1991; Griffiths
Figure 1.—Demonstration of how individual
and Marjoram 1996, 1997; see Nordborg 2001, pp.
195–200, for a useful introduction).
Figure 2 illustrates how a sample of two individuals each consisting of two loci is generated using the ancestral recombination graph. Instead of having two independent loci, the loci are linked. In Figure 2, the rectangles at the top each represent a haplotype in the current generation with the open section correspond-ing to locus A and the solid section correspondcorrespond-ing to locus B. In an ancestral recombination graph, two pro-cesses occur when forming a gene tree, namely recom-bination and coalescent events. Scaling time to be 2N
generations, coalescent events occur as before at rate
kðk1Þ=2, wherekis the number of lineages at a given time. Recombination events occur at the rate 4Nrk/2, where r is the per haplotype recombination rate per generation. The total rate of events is kðk1Þ=21
4Nrk=2, and, given an event, the probability it is a co-alescent isðk1Þ=ðk114NrÞ. Although the rate of recombination is typically much faster than the rate of coalescence, a common ancestor is guaranteed (Griffithsand Marjoram1997).
Proceeding backward in time from the present, a re-combination event is represented by the splitting of a single haplotype lineage into two lineages. For a two-locus model, one two-locus is retained in one ancestral
line-age, whereas the other locus is retained in the second ancestral lineage. In Figure 2, shading corresponds to a locus that is recombined out in the descendant lineage following a recombination event. Often recombination events occur in an ancestral lineage that consists of one locus that is present in the current generation and one that is subsequently recombined out and not present in the current generation. With respect to the coalescence of alleles in the sample, these recombination events are relevant only with respect to incrementing time back-ward in the gene tree, but do not add additional in-formation. Consequently, the splitting of these types of lineages is not recorded in the gene tree, although the time of the event is.
Once an ancestral recombination graph is drawn, there are times associated with each branch segment (in units of 2Ngenerations) and numbers of mutations are modeled to occur along each branch segment according to a Poisson distribution with mean 2N‘mti, wheretiis the time associated with branch segmenti. The per locus mutation rate is assumed to be equal across loci, such that for‘loci and given a mutational event, the probability the mutation occurs at a partic-ular locus is 1=‘. In Figure 2, a hatch mark represents a mutation, the box next to it represents the locus at which the mutation occurred, and~di is the vector of
Figure 2.—Demonstration of how individual
effects of mutation i. To get an allele’s value, simply trace its history back in the gene tree, being careful to follow the correct ancestral lineage at a recombination event.
Because loci can be physically linked, individual ge-notypes are formed by randomly sampling haplotypes as opposed to alleles at independent loci. With a sample consisting of two individuals there are four haplotypes, each individual consisting of two haplotypes. In the example (Figure 2), individual 1 consists of haplotypes 1 and 4. Following the history of the allelea1back in time, only the mutation with effect~d7occurs before reaching the common ancestor of the population so the additive effect ofa1is~01~d7 ¼~d7. Note that the mutation with
effect~d3 occurred in an ancestral allele not present in
the current generation. As with the independent-loci coalescent approach described above, an allele’s addi-tive value is the sum of the effects of mutations in a lineage for the continuum-of-alleles mutation model whereas, for the house-of-cards model, the additive effect is equal to the most recent mutation for the allele. Given the relatively large sample sizes examined in this study combined with a large number of loci and a moderate to fast recombination rate, there were too many possible ancestral haplotypes for computers with 1 GB of memory to simulate the ancestral recombina-tion graph algorithm; hence, there are significant computational limitations when considering recombina-tion while utilizing the coalescent method.
Parameters: Parameters underlying the results pre-sented in this article are cast in terms of 4Nm, 2Nr, the number of loci, andM(see below for a definition ofM). The expression 4Nm=2 gives the expected number of new mutations that enter a population each generation at each locus. In this article, 4Nmranges from 0.1 to 10.0. The expression 2Nr=2 gives the expected number of recombination events per generation during the meiotic phase of the life cycle for an entire population per adjacent pair of loci and it ranges from 0.0 to 1000.0. Numbers of loci vary from 1 to 10 in the results, and it is assumed that each locus has the same value of 4Nm.
In this article, mutations at a locus act either pleio-tropically or nonpleiopleio-tropically. When mutations act pleiotropically, a single mutation potentially affects all characters and the covariance matrix of their effects is given byA. For simplicity, we concentrate on diagonal covariance matrices such thatA¼0:05I, whereIis the identity matrix. When mutations at a locus act non-pleiotropically, the mutations affect only a single char-acter and the variance of their effects is 0.05.
Throughout this article it is assumed that mutation rates and mutational effects are uniform across charac-ters. Thus, the expected eigenvalues of the mutational covariance matrix,M, are uniform, whereM¼UAand
Uis the zygotic mutation rate. We make these simplifying assumptions so that any nonuniformity in the
eigenval-ues ofGarises via factors other than nonuniformity in the eigenvalues of the mutational covariance matrix. In reality, characters of organisms will likely have non-uniform mutational variance and this may be an im-portant factor in determining the ordered eigenvalues of G. But, here we are particularly interested in dem-onstrating that genealogical historyper seis important in shaping the ordered eigenvalues ofG. Furthermore, we do not explore cases in which there is a nonorthogonal transformation between the underlying mutational process and the measured characters of an organism. If the transformation is not orthogonal then this will generally affect the eigenvalues ofG.
RESULTS
All cases we examined were consistent with the pre-diction that, at equilibrium, the average G matrix is equal to 2NMunder neutrality (Phillipsand McGuigan
2006). However, our results revealed two new, consis-tent features of neutral evolution of G matrices at recombination–mutation–drift balance. First, the eigen-values of equilibriumGmatrices are expected to be highly nonuniform—declining in an approximately exponential manner—even when the mutation covariance matrixM
has perfectly uniform eigenvalues (i.e., when M has a single repeated eigenvalue). Second, we found that ge-nealogical ancestry of alleles in a finite population is particularly important in determining the intensity of decay of the ranked eigenvalues of G matrices under neutrality. In the absence of selection, two forces, namely recombination and random genetic drift, generate gene-alogies of alleles, and the genotypic values of alleles in a particular genealogy are determined by the pattern of mutation. In what follows we show in turn how mutation, drift, and recombination shape the ordered eigenvalues ofGmatrices.
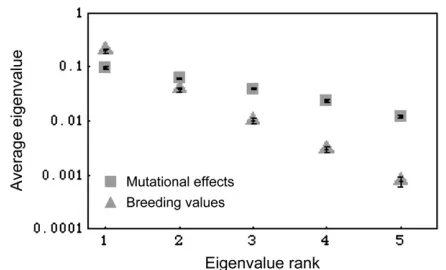
Figure 4 extends the principle illustrated in Figure 3 by replicating the genealogical history of a single locus many times to determine if, on average, there is a greater rate of decline in the eigenvalues associated with breed-ing valuesvs.mutational variation. Furthermore, a larger sample is taken from each population and there are more trait dimensions. The boxes in Figure 4 give the average ordered eigenvalues of mutational variation for a single locus (as was done in Figure 3a, except replicated 500 times). Note that variation is nonuniform across the principal components even though mutation is sampled from a distribution with uniform variance across its principal components. The nonuniformity is the result of stochasticity, in that there are a finite number of mu-tations segregating at a locus and by chance the effects of these mutations are nonuniformly distributed across characters. The triangles in Figure 4 suggest that the eigenvalues associated with the breeding values of individuals decline at a greater rate than the eigenvalues associated with mutational variation. Two processes within the genealogy appear to bring about the en-hanced decline in eigenvalues. One is that genealogy builds up statistical dependence among allelic values due to the pattern of shared common ancestry (branch-ing). The second is that along a single branch multiple mutations may occur, which reduces the number of independently acting mutations. Figure 4 suggests that the point illustrated in Figure 3, namely that genealogy potentially enhances the nonuniformity in the eigen-values associated with variation in breeding eigen-values, is general because, on average, there is a faster decline in eigenvalues associated with variation in breeding values than in mutational effects. On occasion, genealogical ancestry may have no effect on eigenvalues, but, on av-erage, Figure 4 suggests that it enhances the nonuni-formity in their values.
Linkage:Linkage causes the genealogies of alleles at different loci to be correlated. Our results show that tighter linkage between two loci tends to enhance the nonuniformity in the expected eigenvalues ofG(Figure 5). When the loci are completely linked (2Nr¼0) there is greater nonuniformity in eigenvalues than with a higher rate of recombination (2Nr¼1000).
Figure3.—The effect of genealogy at a single
lo-cus on the eigenstructure of allelic variation. (a and b) In the top left corner is an illustration of a genealogy of six alleles with 10 mutations. (a) The bivariate effects of 10 random mutations are plotted assuming normality, where the aver-age effect of a mutation per character is zero and effects are uncorrelated. The shaded arrows represent the principal components of the varia-tion in mutavaria-tional effects with the length of each arrow proportional to the variance explained by each direction. The arrows are similar in length, suggesting that mutational variation is evenly distributed across the two dimensions. (b) The ef-fects of the six alleles at the tips of the genealogy are plotted as solid dots. There are only five dots because two alleles are identical in state. Lines of descent, shaded to aid comparison with the genealogy, connect allelic values. As in a, the shaded arrows indicate the principal components of allelic variation. Comparing a and b suggests that shared common ancestry leads to a reduction in the dimensionality of allelic variation relative to mutational variation. Allelic variation is con-centrated along one principal component axis, whereas mutational variation is distributed relatively evenly over two principal component axes.
Figure4.—The effects of random mutation and genealogy
Other factors influencing eigenstructure: Besides finite mutation, genealogy, and linkage, our results show that several other factors contribute to the pattern of eigenvalues ofG.
Number of loci:Alleles at each locus vary in how they contribute to patterns of additive genetic variance. As more loci are added, the relative contribution of each to the variability inGis reduced. Accordingly, there is more nonuniformity in the eigenvalues ofGwhen there are fewvs.many loci (Figure 6).
Mutation rate and effective population size: The rate of decline in eigenvalues is greater with smaller values of
4Nm(Figure 7). In fact, there is a limit to the expected number of principal components that will have nonzero variance associated with it (Table 1). In Table 1, theM
matrix has 25 dimensions with equal variances across dimensions and no covariance, yet beyond 12 principal components for a sample size of 75 and 15 principal components for a sample size of 300, principal compo-nents are expected to have zero variance associated with them. As the mutation rate or effective population size increases, the number of principal components with nonzero variance will increase (data not shown). Fig-ure 7 illustrates another important point, namely that the decline in eigenvalues is not log linear for high-dimensional cases.
Mutational matrices with variable eigenvalues or nonzero correlations: Until now, we have discussed only cases in which the expected mutational variance–covariance matrix has perfectly uniform eigenvalues with com-pletely uncorrelated mutational effects on different traits. This is clearly a hypothetical extreme. In reality, we expect that the eigenvalues ofMitself will vary and that mutational effects on different traits will be corre-lated (e.g., see Ajieet al.2005; Esteset al.2005). Results
suggest that nonuniformity in the eigenvalues of M
increases nonuniformity in the eigenvalues ofG(data not shown).
We also found that introducing nonuniformity in the eigenvalues of M had an important influence on the eigenvectorsof G. Simulations for two traits show that, whenMhas uniform eigenvalues, the leading eigenvec-tor ofGis uniformly distributed between 0°and 360°. In
Figure5.—The effects of recombination on the
eigenval-ues ofG. A sample of 300 individuals was drawn from a pop-ulation in which 4Nm¼1:0 per locus and four loci were modeled using the ancestral recombination graph. 2Nr is given as the rate of recombination per adjacent pair of loci, and thus the total genomic recombination rate is 6Nr. Muta-tions pleiotropically affected five characters. A total of 500 replicate recombination graphs were simulated. Eigenvalues are on a log scale and error bars represent 95% confidence intervals of the mean eigenvalue. The internal hatch mark within an error bar is the mean eigenvalue.
Figure6.—The effects of varying the number of loci on the
eigenvalues ofG. A sample of 300 individuals was drawn from a population in which 4Nm¼1:0 per locus. For the 10- and 100-loci cases, independent gene trees for each locus were simulated using Hudson’s (1991) algorithm. Mean
eigenval-ues and their confidence intervals are based on 500 repli-cates. Eigenvalues are on a log scale and error bars represent 95% confidence intervals of the mean eigenvalue. The inter-nal hatch mark within an error bar is the mean eigenvalue.
Figure7.—The consequence of varying 4Nm(per locus)
contrast, when the eigenvalues ofMdiffer, the leading eigenvector ofGfollows a unimodal, symmetric distri-bution approximately centered at the leading eigenvec-tor ofM(results not shown). Thus, uneven eigenvalues ofMaffect the entire expected eigenstructure (i.e., ei-genvalues and eigenvectors) ofGunder neutrality.
As for nonzero mutational correlations, their impacts on the eigenstructure ofGare channeled through their effects on the eigenstructure ofM. For example, con-sider a pair of traits each with mutation varianceVmand
mutational correlationr(as in Joneset al.2003). That is, M¼Vm 1r r1
, which has eigenvaluesVmð16rÞ. The
expected eigenvalues ofGgiven thisMare exactly the same as those produced by the mutational covariance
matrix M˜ ¼Vm 1
1r 0
0 1r
, which has the same
ei-genvalues asMbut with uncorrelated mutational effects (results not shown). This suggests that the eigenvalues ofM—and not the specific patterns of mutational var-iances and covarvar-iances—determine the expected eigen-value distribution ofGat equilibrium. Note, however, that the distributions of expected eigenvectors of G
would differ for the two mutational matrices since the eigenvectors ofMandM˜ differ.
Mutational history: We examined two models of mutation: the continuum-of-alleles model (Crowand
Kimura 1964; Kimura 1965) and the house-of-cards
model (Kingman 1977, 1978). The two models
repre-sent opposing extremes of how to model the effects of mutation. With respect to a genealogy of alleles, under the house-of-cards model the genealogy is important only in shaping allele frequencies, whereas in the continuum-of-alleles model the genealogy shapes both allele fre-quencies as well as the genotypic values of alleles. Thus, by comparing results from house-of-cards and continuum-of-alleles models, it is possible to disentan-gle, in part, the effects of variable allele frequency from the historical sequence of mutations on the eigenstruc-ture ofG.
Both the house-of-cards and the continuum-of-alleles models yield, on average, nonuniform eigenvalues at equilibrium (Figure 8). Therefore, it appears that vari-able allele frequencies contribute to the nonuniformity of eigenvalues ofGand the mutational history of alleles further increases this nonuniformity.
Pleiotropic vs. nonpleiotropic mutation:All of the results discussed thus far have assumed universal pleiotropy. For example, if five characters are modeled then each random mutation could potentially affect all five acters. Under universal pleiotropy variation at each char-acter is determined by the same set of gene trees. At the other extreme, when mutations at a locus are not pleio-tropic, each character has a unique set of gene trees underlying its variation, provided that there is some recombination between loci. Figure 9 shows that pleio-tropic mutation enhances nonuniformity in eigenvalues ofG(particularly for lower mutation rates), presumably because the allelic ancestries that underlie variation of different characters overlap. If mutations act nonpleio-tropically, then, to the extent that loci freely recombine, the allelic ancestries underlying each character’s varia-tion will be independent.
Whole-population properties of G: The results have fo-cused on the properties ofGbased on a sample of size
nfrom a population of sizeN, wheren,N. An important question is the extent to which the nonuniformity inG
is the result of taking a sample from a population. In the
appendix, we describe results for the eigenstructure of Gfor an entire population based on individual-based simulations. The results suggest that the eigenvalues of
Gdecline at an approximately exponential rate and that the decline is slightly less than the decline based on taking a subsample from the population to estimate the properties ofG.
DISCUSSION
Our results are consistent with the equilibrium expec-tation ofG, EðGÞ ¼2NM, predicted by Phillips and
McGuigan(2006) under neutral evolution. However,
our results demonstrate that the expected eigenvalues of G at equilibrium and the eigenvalues of E(G) are TABLE 1
Limits to multivariate trait variation
Sample size
Eigenvalue rank 75 300
1 6.41e-163.20e-2 6.22e-162.80e-2 2 3.09e-161.86e-2 3.08e-161.74e-2 3 1.56e-161.25e-2 1.56e-161.17e-2 4 7.37e-267.32e-3 7.67e-267.22e-3 5 3.63e-264.69e-3 3.87e-264.62e-3 6 1.72e-262.71e-3 1.92e-262.78e-3 7 7.85e-361.60e-3 9.48e-361.69e-3 8 3.31e-368.07e-4 4.38e-369.05e-4 9 1.27e-364.42e-4 1.91e-365.04e-4 10 5.23e-462.44e-4 8.12e-462.95e-4 11 2.02e-461.34e-4 3.33e-461.74e-4 12 9.08e-661.78e-5 1.27e-469.90e-5
13 0.0 6.02e-565.00e-5
14 0.0 1.49e-561.60e-5
15 0.0 1.19e-662.34e-6
16 0.0 0.0
highly discordant. For instance, when M has uniform eigenvalues associated with it, then E(G) has uniform eigenvalues, but the expected eigenvalues ofGare non-uniform. The practical consequence of this is that al-thoughE(G) may imply that variation in breeding values is evenly distributed across characters, in fact due to stochasticity, variation in breeding values is never evenly distributed. Some characters by chance will have less genetic variation than others and furthermore, due to stochasticity and the pleiotropic nature of mutation and/ or linkage, breeding values will typically covary among characters even if the expectation is independence. Our results suggest that the nonuniformity in the eigenvalues ofGis not trivial because the nonuniformity is approx-imately exponential. This approximate exponential decline in eigenvalues may lead to potentially strong constraints on the freedom of a multivariate phenotype to respond to selection.
A key factor shaping the nonuniformity in the eigen-values ofGis genealogy. Genealogy causes the effects of alleles at a locus to be dependent. The principle that ge-nealogy causes dependencies is not new and has been a key basis of analyses in phylogenetics (e.g., Piazzaand
Cavalli-Sforza1974 and Felsenstein1985). That
ge-nealogy is important in shaping the eigenstructure of
Ghas been until now unrecognized. Shared common descent enhances the nonuniformity in the eigenvalues ofGdue to dependencies generated by branching pat-terns within the genealogy. In addition, multiple muta-tions may occur within a single branch of a genealogy, and this too can enhance the nonuniformity in the ei-genvalues of Gbecause there are fewer independently acting mutations. The genealogical ancestry of alleles is intrinsic to biology. The only way to partially overcome the covariance in allelic values that is induced by gene-alogy is for the value of an allele to be decoupled from its ancestry. The house-of-cards mutation model is one where the value of an allele is decoupled from its an-cestry and our results show that this causes the decline in eigenvalues to be less than if the value of an allele is cou-pled to its ancestry (such as in the continuum-of-alleles model). Tighter linkage enhances nonuniformity in the eigenvalues ofGbecause alleles at different loci do not segregate independently, thus decreasing the number of independent gene genealogies contributing to the structure ofG.
In general, then, the nonuniformity in the eigenval-ues ofGis exaggerated with more dependency among allelic effects. We found that these dependencies can be affected by a variety of other factors as well. For instance, when there are fewer loci or the per locus mutation rate is lower the observed nonuniformity in the eigenvalues ofGis increased. The degree of pleiotropy of new mu-tations affects the dependency of allelic effects. Under universal pleiotropy all characters are influenced by the same set of gene trees and this overlap increases the observed nonuniformity in the eigenvalues of G. In contrast, in the absence of pleiotropy, each character has a unique set of gene trees (as long as there is some recombination), and this independence decreases cor-relations between genotypic values and reduces non-uniformity in the expected eigenvalues ofG.
Figure 8.—The effect of different
mutational models: house-of-cards vs.
continuum-of-alleles. Three hundred in-dividuals were sampled and 4Nm¼1:0 for each locus. The independent locus co-alescent approach was used. Estimates are based on 500 replicates. Eigenvalues are on a log scale and error bars represent 95% confidence intervals of the mean eigenvalue. The internal hatch mark within an error bar is the mean eigenvalue.
Figure9.—The effects of pleiotropy on the nonuniformity
What leads to the discrepancy between the expected eigenvalues ofGand the eigenvalues of E(G)? Mathe-matically, the discordance traces to the fact that eigen-values are nonlinear functions of the elements ofG, and hence the expectations of the eigenvalues ofGwill not generally be equal to the eigenvalues of the expectation ofG. This can be seen more directly in the following two-trait case. Suppose the expected G matrix is
di-agonal with the repeated eigenvalue ˆl:EðGÞ ¼ lˆ 0 0 lˆ
,
where ˆl.0. A realizedGunder neutral evolution can be viewed as a perturbation of E(G), say, G¼
ˆ
l1e1 e2 e2 lˆ1e3
, where theei’s are random variables with
zero means and variances much smaller than ˆl. If we imagine that the perturbations are drawn, say, from a zero-mean normal distribution with variance s2>lˆ
then it is not hard to show that the expected eigenvalues ofGare not uniform (i.e., not repeated). Indeed, the expected leading eigenvalue ofGexceeds ˆlby at least
spffiffiffiffiffiffiffiffiffi2=pwhereas the smaller eigenvalue ofGis expected to fall below ˆlby at least the same amount. This sug-gests that nonuniformity among the expected eigen-values ofGis driven by the variability of perturbations from E(G). This variability arises from the assorted sources of stochasticity inherent to evolution in finite populations.
That the eigenvalues of random covariance matrices (such as aGmatrix) are nonuniform is not a new result (e.g., see a review by Edelman and Rao 2005 and
Wagner’s1984 random pleiotropy model).
Addition-ally, similar patterns found in this article for the average of ranked eigenvalues are observed if it is assumed that the variances for characters are independently drawn from a chi square for a given degrees of freedom. In particular, a deviation from a purely exponential de-cline occurs as was observed in Figure 7. Broadly, sto-chasticity causes the nonuniformity in eigenvalues, but there are biologically unique processes that contribute to this stochasticity. This article suggests that genealog-ical ancestry is one important process.
Our neutral theoretical predictions for the expected structure of G at recombination–mutation–drift bal-ance form an important set of null expectations for em-pirical studies of multivariate evolution. In particular, our finding that, under neutrality, the eigenvalues ofG
tend to be unequal and decay approximately exponen-tially from largest to smallest is consistent with empirical estimates ofG(e.g., Mezeyand Houle2005). However,
our results also show that the rate of decay is sensitive in predictable ways to numerous factors including pop-ulation size, the number and patterns of linkage among loci, and the rate of and modality of mutation. If one includes selection as well (as in Jones et al. 2003),
current theoretical considerations suggest that infer-ring underlying process from an equilibrium estimate of
G may be difficult because different underlying
pro-cesses have similar effects on the eigenvalues associated withG. For instance, it may be difficult to disentangle mutation rates from numbers of loci and the pattern of recombination among loci. Single-locus expectations and statistics may be developed, but this ignores the likely possibility that more than one locus contributes variation toG. Rather, to infer processes that influence the evolution ofGmay require direct approaches (see Estes et al. 2004) or possibly the study of transient
changes in G (Phillips et al. 2001; Whitlock et al.
2002).
Comments by Ruth Shaw, Joe Felsenstein, and an anonymous re-viewer improved the presentation and content of this article. We thank the anonymous reviewer for suggesting that we examine the case in which the variance for each character is independent and chi-square distributed. We thank P. Phillips and K. McGuigan for allowing us to cite their then unpublished work and the National Science Founda-tion (NSF) (grants DEB 0337582, EF 0328594, and EF 0531870 to RG) for financial support. The Initiative for Bioinformatics and Evolution-ary Studies program at the University of Idaho kindly provided computer resources and they are supported by NSF grant EPS 0080935 and National Institutes of Health grants P20 RR16454 and P20 RR16448 from the Center for Biomedical Research Excellence and Idea Networks of Biomedical Research Excellence programs of the National Center for Research Resources.
LITERATURE CITED
Ajie, B. C., S. Estes, M. Lynchand P. C. Phillips, 2005 Behavioral
degradation under mutation accumulation inCaenorhabditis ele-gans.Genetics170:655–660.
Avery, P. J., and W. G. Hill, 1977 Variability in genetic parameters
among small populations. Genet. Res.29:193–213.
Blows, M. W., S. F. Chenowethand E. Hine, 2004 Orientation of
the genetic variance-covariance matrix and the fitness surface for multiple male sexually selected traits. Am. Nat.163:E329–E340. Crow, J. F., and M. Kimura, 1964 The theory of genetic loads, pp.
495–505 inProceedings of the XI International Congress of Genetics. Pergamon Press, Oxford.
Edelman, A., and N. R. Rao, 2005 Random matrix theory. Acta
Numerica14:233–297.
Estes, S., P. C. Phillips, D. R. Denver, W. K. Thomasand M. Lynch,
2004 Mutation accumulation in populations of varying size: the distribution of mutational effects for fitness correlates in Caeno-rhabditis elegans.Genetics166:1269–1279.
Estes, S., B. C. Ajie, M. Lynchand P. C. Phillips, 2005 Spontaneous
mutational correlations for life-history, morphological and behavioral characters in Caenorhabditis elegans. Genetics 170: 645–653.
Ewens, W. J., 2004 Mathematical Population Genetics. I. Theoretical
Introduction.Springer, New York.
Falconer, D. S., and T. F. C. MacKay, 1996 Introduction to
Quantita-tive Genetics.Longman, Essex, UK.
Griffiths, R. C., 1981 Neutral two-locus multiple allele models with
recombination. Theor. Popul. Biol.22:169–186.
Griffiths, R. C., 1991 The two-locus ancestor graph, pp. 100–117 in
Selected Proceedings of the Symposium of Applied Probability, edited by I. V. Basawaand R. L. Taylor. Institute of Mathematical Statistics,
Hayward, CA.
Griffiths, R. C., and P. Marjoram, 1996 Ancestral inference from
samples of DNA sequences with recombination. J. Comput. Biol. 3:479–502.
Griffiths, R. C., and P. Marjoram, 1997 An ancestral
recombina-tion graph, pp. 257–270 inProgress in Population Genetics and Hu-man Evolution, edited by P. Donnellyand S. Tavare´. Springer
Verlag, New York.
Hine, E., and M. W. Blows, 2006 Determining the effective
Hine, E., S. F. Chenoweth and M. W. Blows, 2004 Multivariate
quantitative genetics and the lek paradox: genetic variance in male sexually selected traits of Drosophila serrata under field conditions. Evolution58:2754–2762.
Hudson, R. R., 1991 Gene genealogies and the coalescent process.
Oxf. Surv. Evol. Biol.7:1–44.
Jones, A. G., S. J. Arnoldand R. Bu¨ rger, 2003 Stability of the
G-matrix in a population experiencing pleiotropic mutation, stabilizing selection, and genetic drift. Evolution 57: 1747– 1760.
Kimura, M., 1965 A stochastic model concerning the maintenance
of genetic variability in quantitative characters. Proc. Natl. Acad. Sci. USA54:731–736.
Kingman, J. F. C., 1977 On the properties of bilinear models for the
balance between genetic mutation and selection. Proc. Camb. Philos. Soc.81:443–453.
Kingman, J. F. C., 1978 A simple model for the balance between
se-lection and mutation. J. Appl. Probab.15:1–12.
Kingman, J. F. C., 1982 The coalescent. Stoch. Proc. Appl. 13:
235–248.
Kirkpatrick, M., and D. Lofsvold, 1992 Measuring selection and
constraint in the evolution of growth. Evolution46:954–971. Lande, R., 1979 Quantitative genetics analysis of multivariate
evolution, applied to brain:body size allometry. Evolution 33: 402–416.
Lande, R., 1980 The genetic covariance between characters
main-tained by pleiotropic mutations. Genetics94:203–215. Lande, R., and S. J. Arnold, 1983 The measurement of selection on
correlated characters. Evolution37:1210–1226.
Lynch, M., and W. G. Hill, 1986 Phenotypic evolution by neutral
mutation. Evolution40:915–935.
Lynch, M., and B. Walsh, 1998 Genetics and Analysis of Quantitative
Traits.Sinauer Associates, Sunderland, MA.
Mezey, J. G., and D. Houle, 2005 The dimensionality of genetic
var-iation for wing shape in Drosophila melanogaster. Evolution59: 1027–1038.
Nordborg, M., 2001 Coalescent theory, pp. 179–212 inHandbook of
Statistical Genetics, edited by D. J. Balding, M. Bishop and
C. Cannings. John Wiley & Sons, Chichester, UK.
Piazza, A., and L. L. Cavalli-Sforza, 1974 Spectral analysis of
patterned covariance matrices and evolutionary relationships, pp. 76–105 inProceedings of the Eighth International Conference on Numerical Taxonomy, edited by G. F. Estabrook. W. H. Freeman,
San Francisco.
Phillips, P. C., and S. J. Arnold, 1989 Visualizing multivariate
se-lection. Evolution43:1209–1222.
Phillips, P. C., and K. L. McGuigan, 2006 Evolution of genetic
variance-covariance structure, pp. 310–325 inEvolutionary Genet-ics: Concepts and Case Studies, edited by C. W. Foxand J. B. Wolf.
Oxford University Press, Oxford.
Phillips, P. C., M. C. Whitlockand K. Fowler, 2001 Inbreeding
changes the shape of the genetic covariance matrix inDrosophila melanogaster.Genetics158:1137–1145.
Schluter, D., 1996 Adaptive radiation along genetic lines of least
resistance. Evolution50:1766–1774.
Wagner, G. P., 1984 On the eigenvalue distribution of genetic and
phe-notypic dispersion matrices: evidence for a nonrandom organiza-tion of quantitative character variaorganiza-tion. J. Math. Biol.21:77–95. Whitlock, M. C., P. C. Phillipsand K. Fowler, 2002 Persistence
of changes in the genetic covariance matrix after a bottleneck. Evolution56:1968–1975.
Zeng, Z.-B., and C. C. Cockerham, 1991 Variance of neutral genetic
variances within and between populations for a quantitative char-acter. Genetics129:535–553.
Communicating editor: M. Nordborg
APPENDIX
Whole-population predictions for G: To investigate neutral evolution ofGfor an entire population we used forward time, individual-based simulations. Our ap-proach is similar to that of Joneset al. (2003) except
for the absence of selection and our use of Wright– Fisher mating (i.e., sampling parents with replacement). The individual-based simulations were founded on the same model assumptions as the two coalescent-based methods. Events in the individual-based simulations were ordered mutation /recombination/random mating within generations. At the beginning of a rep-licate simulation run, each individual was initialized with a genotypic value of zero by assigning allelic values of zero to all loci. Population sizes of 140 and 1366 were simulated. An inspection of simulations suggests that populations reach quasi-recombination–mutation–drift balance by 12,000 generations for populations consist-ing of 140 and 1366 individuals given our mutation rate and rates of recombination. The basis for this inference was that the averageGmatrix from simulations was not significantly different from 2NMthe expectedGmatrix. For each replicate run, we calculated the G matrix at
FigureA1.—The eigenvalues ofGfor an entire population
FigureA2.—The eigenvalues ofGfor an entire population
based on individual-based simulations and when the recombi-nation rate varies between loci (squares). The population size in all cases wasN¼1366. Mutations pleiotropically affected five characters at two loci. The continuum-of-alleles mutation model was used. For comparison, results based on the ances-tral recombination graph are provided (triangles) in which the same number of loci, population size, per locus mutation rate, and recombination rate is modeled, except now results are based on a sample of 30 individuals from the population. Results are based on 200 replicates for the individual-based and 500 replicates for the coalescent simulations. Eigenvalues are on a log scale and error bars represent 95% confidence intervals of the mean eigenvalue. The internal hatch mark within an error bar is the mean eigenvalue. Points using the an-cestral recombination graph approach are offset relative to points using the individual-based approach to aid comparison.
generation 12,000 using the genotypic values of all individuals in the population. We ran 20 replicates for a particular parameter set when using 50 loci and 200 replicates when using 2 and 5 loci.
Some of the parameters used in both the individual-based simulations were similar to those utilized by Jones
et al. (2003). For example, the per haploid locus mu-tation rate utilized was 0.0002 and all traits were un-correlated with an expected per character variance in the effects of mutations of 0.05.