Testing hypotheses for the origin of steep slope of lunar size-frequency
distribution for small craters
Noriyuki Namiki1and Chikatoshi Honda2
1Department of Earth and Planetary Sciences, Kyushu University, Hakozaki 6-10-1, Higashi-ku, Fukuoka 812-8581, Japan 2The Institute of Space and Astronautical Science, Yoshinodai 3-1-1, Sagamihara 229-8510, Japan
(Received June 13, 2001; Revised June 24, 2002; Accepted January 6, 2003)
The crater size-frequency distribution of lunar maria is characterized by the change in slope of the population between 0.3 and 4 km in crater diameter. The origin of the steep segment in the distribution is not well understood. Nonetheless, craters smaller than a few km in diameter are widely used to estimate the crater retention age for areas so small that the number of larger craters is statistically insufficient. Future missions to the moon, which will obtain high resolution images, will provide a new, large data set of small craters. Thus it is important to review current hypotheses for their distributions before future missions are launched. We examine previous and new arguments and data bearing on the admixture of endogenic and secondary craters, horizontal heterogeneity of the substratum, and the size-frequency distribution of the primary production function. The endogenic crater and heterogeneous substratum hypotheses are seen to have little evidence in their favor, and can be eliminated. The primary production hypothesis fails to explain a wide variation of the size-frequency distribution of Apollo panoramic photographs. The secondary craters are likely the major source of the steepening of the distribution. It is ambiguous, however, which primary craters can produce sufficiently numerous secondary craters. The regional variation of the size-frequency distributions shows that few large impacts produce enough secondary craters to affect the distributions in the surrounding area. We emphasize that a crater size-frequency distribution of small craters on the moon should not be taken as an indication of the surface age. More data obtained from future lunar missions should be viewed in this context, and continued to be examined for further insight into the possible formation mechanism for secondary craters.
1.
Introduction
It is well known that a number density of craters increases monotonically with time on planets and satellites where vol-canic resurfacing and fluid erosion are of negligible impor-tance. Also, crater counting on planetary surfaces reveals that the number density decreases as the crater diameter in-creases (e.g., Basaltic Volcanism Study Project, 1981; Chap-man and McKinnon, 1986; Melosh, 1989). Then, in the ideal case, the cumulative number density of craters per km2,σ, is described by a power-law distribution of crater diameter in km,D(Basaltic Volcanism Study Project, 1981; Melosh, 1989),
σ(D)=αDβ, (1)
whereαis a coefficient that increases with the age of surface. The index,β, is the slope of (1) in a log(D)vs. log(σ )plot and is usually a constant close to−2 (e.g., Melosh, 1989).
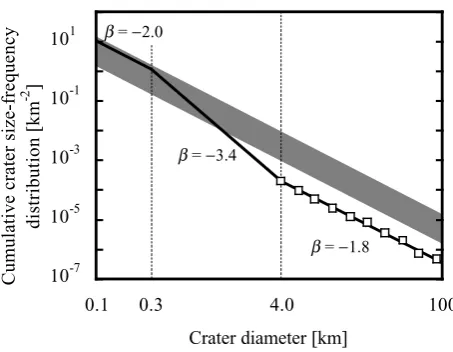
The crater size-frequency distribution on the lunar maria is a well-known exception from (1) (e.g., Basaltic Volcanism Study Project, 1981; Wilhelmset al., 1987; Melosh, 1989). An average crater size-frequency distribution over the lunar maria consists of three segments (Fig. 1). These segments are divided at diameters around 0.3 and 4 km, and each seg-ment has a characteristic slope. In the segseg-ment forDlarger
Copy right cThe Society of Geomagnetism and Earth, Planetary and Space Sciences (SGEPSS); The Seismological Society of Japan; The Volcanological Society of Japan; The Geodetic Society of Japan; The Japanese Society for Planetary Sciences.
than 4 km, the value ofβ of (1) varies in the range between −1.6 and−2.0 depending on the area, with the average of −1.8 (Wilhelmset al., 1987). Because the value ofαof (1) in this diameter range uniquely corresponds to the radiomet-ric age of the returned rock samples, α in this segment is used to determine the surface age of the lunar maria (e.g., Basaltic Volcanism Study Project, 1981). In the segment for
Dsmaller than 0.3 km, the value ofβ is again close to−2. According to the previous studies by impact experiments and numerical simulations, the craters in this diameter range are inferred to be in equilibrium (e.g., Gault, 1970; Chapman and McKinnon, 1986; Hartmann and Gaskel, 1997). That is, the number density of craters has reached steady state, in which the formation of the new craters and the consequent erosion of old craters are in balance. In crater equilibrium, αin (1) does not depend on time, but is a constant between 0.015 and 0.15 (e.g., Gault, 1970; Melosh, 1989).
The segment for diameter larger than 0.3 km and smaller than 4 km is distinguished by a steep slope where the value ofβ lies in the range between−3 and−4 with the average ofβ of−3.4 (e.g., Melosh, 1989). Such an abrupt change in the slope (Fig. 1) has been proposed to result from either ad-mixture of endogenic craters (Kuiperet al., 1966; Chapman
et al., 1970; Schultz et al., 1976), horizontal heterogeneity
of the properties of the substratum in which impact craters formed (Gault, 1970; Chapmanet al., 1970, 1979; Schultzet al., 1977), a primary production function that shows a
10-7 10-5 10-3 10-1 101
0.1 100
Cumulative crater size-frequency
distribution [km
-2 ]
Crater diameter [km]
0.3 4.0
β = −3.4
β = −1.8 β = −2.0
Fig. 1. A compilation of cumulative crater size-frequency distributions in lunar maria. The average cumulative crater size-frequency distribution is shown by solid line and open squares (Basaltic Volcanism Study Project, 1981, table 8.4.1; Melosh, 1989). The shaded band indicates crater equilibrium, for whichαandβ are between 0.15 and 0.015, and−2, respectively (Melosh, 1989).
ilar abrupt decrease in the slope (Neukum and Wise, 1976; Neukum and Ivanov, 1994; Chapmanet al., 1996), or pre-dominance of secondary craters in the size-frequency distri-bution for diameters smaller than 4 km (Shoemaker, 1965; Wilhelmset al., 1978). Since high-resolution lunar images became available after Apollo and Lunar Orbiter spacecraft, there has been a controversy among these hypotheses (e.g., Basaltic Volcanism Study Project, 1981). While the cause of the steepening remains unsolved, small craters are widely used to estimate a surface age (e.g., Greeley et al., 1993; Neukum and Ivanov, 1994; Hartmannet al., 1999, Hartmann and Berman, 2000) on the basis of the primary production hypothesis (Neukum and Wise, 1976; Neukum and Ivanov, 1994; Chapmanet al., 1996). An advantage of large number of small crater increases as images taken by the future lunar explorations, such as Japanese LUNAR-A (Mizutani, 1995) and SELENE (Sasakiet al., 1999), are expected to achieve higher resolution than previous ones. Therefore it is impor-tant to review possible hypotheses for this steepening before the new missions are launched.
These hypotheses predict that the steep slope segment is associated with a surface age or local properties of the stud-ied area. Therefore we attempt to evaluate these hypothe-ses by measuring the size-frequency distributions of craters smaller than a few km in series of photographs covering Copernicus and Tycho craters, Oceanus Procellarum, and Mare Imbrium, and comparing the distributions with other data sets. For example, the endogenic crater hypothesis (Kuiperet al., 1966; Chapmanet al., 1970; Schultzet al., 1976) implies that the steep slope segment is most distinc-tive on a unit such as Marius Hills where past magmatic ac-tivity is indicated from geologic studies (Weitz and Head, 1999). In contrast, on a surface younger than the cease of lu-nar magmatism, such as ejecta blanket of Copernican craters, the steep slope segment is not expected. Thus, measurement of the crater size-frequency distributions in young craters can be a test of this hypothesis.
The physical properties of the substrate also have been
considered to influence the crater size-frequency distribution (the heterogeneous substratum hypothesis) (Gault, 1970; Chapmanet al., 1970, 1979; Schultzet al., 1977). Because the crater diameter is dependent on the strength of the target in a strength regime (Chapman and McKinnon, 1986), me-chanical structure of the lunar surface may affect the crater size-frequency distribution (Gault, 1970; Chapman et al., 1970, 1979). Schultz et al. (1977) further point out that properties of the target strongly affect degradation of small craters. In this case, the crater size-frequency distribution can reveal some correlation with geophysical data sets, if the data sets manifest the horizontal heterogeneity of the sub-surface structure. In this context, we first investigate a cor-relation between the crater size-frequency distribution and thickness of mare basalt. The thickness of mare basalt is es-timated to be between 0.1 and 2 km (DeHon and Waskom, 1976; DeHon, 1979; Yingst and Head, 1997, 1999; Bud-ney and Lucey, 1998). A boundary at this depth may be related to the inflection of the crater size-frequency distri-bution around 4 km in diameter (Fig. 1). A shift of the inflection point to, for example, larger diameter results in an apparent increase of the αvalue. Second, we compare the crater size-frequency distributions with the topography of mare surface (Smithet al., 1997). If the topography re-flects superposition of basaltic layers, a regional variation of the crater size-frequency distributions may show a correla-tion with the topography. And third, we compare variacorrela-tions of the distributions with the Bouguer gravity anomaly
(Kono-plivet al., 1998; Wieczorek and Phillips, 1998; Konopliv and
Yuan, 1999). The gravity data represent the structure of lu-nar interior, therefore the horizontal heterogeneity of target properties beneath the mare surface may be somehow related to the gravity anomaly.
un-Table 1. Summary of location, geologic classification, least-squares fits, andχ2test for all photographs taken in this study (Pieters, 1978; Whitford-Stark and Head, 1980; Wilhelmset al., 1987).
LO5H127 −41.0 13.0 Co 0.0068± 0.0045 -4.39 ± 0.30 0.750 0.08 - 0.30
LO5H153 10.0 20.0 Co 2.42 ± 0.24 -3.30 ± 0.12 0.710 0.114 - 0.559
LO4H121 10.0 15.0 Co 0.89± 0.08 -3.64 ± 0.26 0.790 0.921 - 2.57
AS 15-2056 26.1 9.6 7.76 ± 0.18 -3.02 ± 0.04 0.855 1.06 - 2.92
AS 15-2060 27.0 15.3 6.91 ± 0.64 -4.42 ± 0.20 0.514 1.05 - 2.90
AS 15-2064 27.8 20.5 4.27 ± 0.39 -3.28 ± 0.18 0.423 0.75 - 2.91
AS 15-2068 28.3 25.7 4.37 ± 0.20 -3.36 ± 0.04 0.997 1.47 - 5.80
AS 15-2072 28.6 31.3 3.16 ± 0.07 -4.09 ± 0.12 0.575 0.74 - 2.06
AS 15-2076 28.8 36.6 5.25 ± 0.24 -3.49 ± 0.11 0.539 0.75 - 2.95
AS 15-2080 28.6 42.1 7.08 ± 0.16 -3.29 ± 0.05 0.832 1.03 - 2.89
AS 15-2480 28.8 48.0 7.59 ± 1.23 (-2.69 ± 0.22) 0.598 1.42 - 3.98
AS 15-2484 28.7 54.0 2.95 ± 0.20 -3.23 ± 0.21 0.454 0.71 - 1.99
AS 15-2746 28.4 59.7 3.39 ± 0.63 -3.07 ± 0.64 (0.007) 0.71 - 2.00
AS 15-2748 27.7 65.5 3.24 ± 0.03 -3.37 ± 0.03 0.905 0.72 - 2.02
AS 15-2490 27.7 62.7 3.31 ± 0.03 (-2.90 ± 0.03) 0.889 0.70 - 1.99
AS 15-1838 25.7 22.8 3.31 ± 0.03 (-2.93 ± 0.05) 0.865 1.01 - 2.83
AS 15-1842 25.6 28.2 8.71 ± 4.38 -3.91 ± 0.43 0.642 2.05 - 5.79
AS 15-1846 25.3 33.7 5.25 ± 0.73 -3.72 ± 0.32 0.295 1.02 - 2.89
AS 15-1850 24.9 39.1 6.03 ± 1.12 -3.86 ± 0.42 0.231 1.02 - 2.89
AS 15-0260 26.6 23.5 hDSA Er 1.58 ± 0.01 -4.25 ± 0.02 0.997 0.383 - 1.41
AS 15-0264 26.9 24.9 LBSP Im 0.525 ± 0.13 -4.76 ± 0.25 0.452 0.272 - 0.690
AS 15-0268 27.1 26.3 hDSA Er 1.82 ± 0.34 -4.03 ± 0.18 0.494 0.278 - 0.711
AS 15-0272 27.3 27.3 hDSA Er 2.40 ± 0.11 -3.61 ± 0.03 0.909 0.207 - 0.708
AS 15-0276 27.5 29.3 hDSA Er 1.82 ± 0.17 -3.89 ± 0.13 0.967 0.284 - 1.44
AS 15-0280 27.7 30.7 hDSA Er 3.80 ± 0.62 -3.55 ± 0.14 0.456 0.217 - 0.758
AS 15-0284 27.9 32.2 LBSP Im 9.77 ± 0.23 -3.29 ± 0.02 0.956 0.387 - 1.03
AS 15-0288 28.1 33.6 LBSP Sharp Im 1.82 ± 0.25 -3.95 ± 0.25 0.792 0.385 - 1.43
AS 15-0292 28.2 35.0 LBSP Sharp-Hermann Im 2.14 ± 0.97 -5.05 ± 1.07 0.103 0.533 - 1.46
AS 15-0296 28.3 36.5 LBSP Hermann Im 9.12 ± 0.21 -3.05 ± 0.05 0.991 0.526 - 2.02
AS 15-0300 28.5 37.9 hDSA Sharp-Hermann Er 4.68 ± 0.98 -4.16 ± 0.52 0.365 0.539 - 1.48 AS 15-0304 28.5 39.5 LBSP Sharp-Hermann Im 3.89 ± 0.36 -4.22 ± 0.12 0.680 0.373 - 1.00 AS 15-0308 28.6 41.0 LBSP Telemann Im 1.26 ± 0.12 -4.77 ± 0.13 0.750 0.367 - 0.988
α
Lunar Orbiter
Metric 1
Wilhelms
et al. (1987)* Pieters
(1978)§
Whitford-Stark α, x 10-3 Group Photograph
Number
Latitude,
°N
Longitude,
°W
Classifications
Q Diameter range,
km
Metric 2
AS 15-0312 28.7 42.3 LBSP Telemann Im 5.37 ± 0.37 -4.08 ± 0.13 0.945 0.362 - 1.94 AS 15-0316 28.8 43.7 LBSP Telemann Im 5.75 ± 0.13 -3.90 ± 0.11 0.905 0.702 - 1.95 AS 15-0320 28.8 45.2 LBG- Telemann Im 5.75 ± 0.27 -3.17 ± 0.05 0.972 0.347 - 1.32 AS 15-0324 28.8 46.7 LBG- Telemann Im 2.00 ± 0.09 -4.86 ± 0.07 0.794 0.365 - 0.995 AS 15-0328 28.8 48.3 LBG- Telemann Im 33.11 ± 5.36 -3.20 ± 0.27 0.880 0.960 - 3.78 AS 15-0332 28.8 49.4 LBG- Telemann Im 8.32 ± 0.58 -3.33 ± 0.15 0.745 0.481 - 1.32 AS 15-0344 28.6 53.6 Undivided Telemann Er 4.27 ± 0.20 -3.37 ± 0.12 0.895 0.472 - 1.84 AS 15-0348 28.6 54.9 HDSA Telemann Er 9.77 ± 0.23 -3.12 ± 0.03 0.956 0.556 - 1.54
AS 15-0352 28.5 56.3 HDSA Sharp Co 1.00 ± 0.01 -4.22 ± 0.01 0.951 0.257 - 0.705
AS 15-0356 28.4 57.7 HDSA Sharp Co 2.69 ± 0.25 -3.61 ± 0.07 0.583 0.181 - 0.493
AS 15-0358 28.3 58.4 HDSA Sharp Co 2.75 ± 0.64 -3.75 ± 0.30 0.712 0.354 - 0.983
AS 15-0360 28.3 59.1 HDSA Sharp Co 4.57 ± 0.53 -3.31 ± 0.13 0.430 0.222 - 1.21
AS 15-0362 28.1 60.4 hDSA Sharp Co 3.47 ± 0.08 -3.58 ± 0.05 0.934 0.434 - 1.21
AS 15-0364 28.0 62.0 hDSA Sharp Co 2.04 ± 0.09 -4.19 ± 0.07 0.899 0.302 - 1.19
AS 15-0366 27.8 63.4 hDSA Sharp Er 11.5 ± 0.11 -3.13 ± 0.01 0.950 0.221 - 0.616
AS 15-0370 27.4 66.3 mISP Hermann Im 2.00 ± 0.23 -4.66 ± 0.20 0.712 0.428 - 1.20
Panoramic
and Head (1980)#
Note: Photographs grouped as metric 1 and 2 are taken from different tracks of Apollo 15 (Fig. 2). The average latitude of metric 1 and 2 groups are 28.0◦N and 25.4◦N, respectively.§: Classification is based on spectral map compiled by Wilhelmset al.(1987, pl. 4) from Pieterset al.(1975), Headet al.
(1978), and Pieters (1978). The region adopted in this work has been studied by Pieters (1978). First letter H-h-m-L indicates range of UV/VIS ratios from H (high) to L (low), respectively. Second letter B-I-D indicates albedo, from Bright (B) to dark (D), respectively. Third letter S-G indicates nature of the mafic mineral absorption band near 1 mm, strong (S) and gentle (G), respectively. Forth letter P-A indicates nature of the pyroxene absorption band near 2 mm, prominent (P) and attenuated (A). #: Geologic units are classified by surface age (Whitford-Stark and Head, 1980). The Sharp formation consists of the youngest units, and the Telemann formation consist of the oldest units. Sharp+Hermann indicates that the panoramic picture lies on the boundary between the two formations. ∗: Classification is taken from surface age determined by Wilhelmset al.(1987, pl. 12). Im, Er, and Co denote Imbrian, Eratosthenian, and Copernican, respectively.
der the assumption that each geological unit represents con-current eruptions.
As for the secondary crater hypothesis (Shoemaker, 1965; Wilhelmset al., 1978), there are two different interpretations depending on the size of the primary crater. First, if all pri-mary craters are accompanied by small secondary craters, this interpretation is indistinguishable from the primary production hypothesis (Basaltic Volcanism Study Project, 1981). There is then no need for a new test. Second, if only primary craters larger than a few tens km in diameter can produce secondary craters (Shoemaker, 1965), the number
density of the secondary craters would decrease with dis-tance from a local large crater. Thus, we can test this hy-pothesis by examining a variation of theαvalue of the steep slope segment depending on the distance from large primary craters.
2.
Data Sets and Handling
2.1 Geological settings and photographs of the studied area
Aristarchus
Krieger DeLisle
Diophantus
Euler
Lambert
Timocharis 70° W
20° N 40° N 0° W
Archimedes
Herodotus
Pytheas Lichtenberg
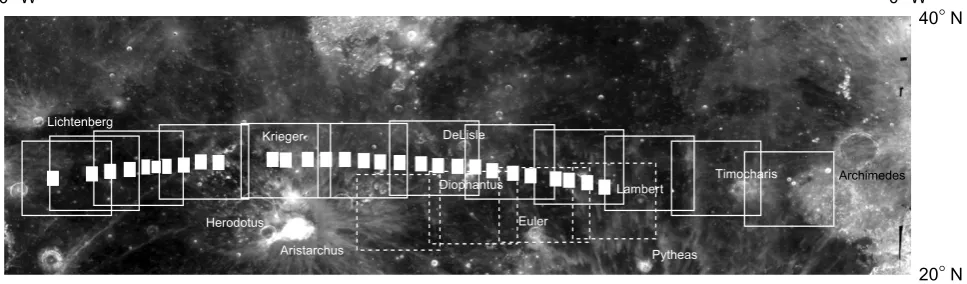
Fig. 2. A mosaic of Clementine UV/VIS images from 0◦W to 70◦W and from 20◦N to 40◦N. The area covered by the panoramic, metric 1, and metric 2 photographs (Table 1) are superimposed by small solid rectangles, large open rectangles, and large dashed rectangles, respectively.
at 10◦N and 20◦W on the southernmost part of Mare Im-brium. Its age is estimated to be about 0.81 b.y. from U-Th-Pb and K-Ar dating of regolith sample and a degassing event in KREEP glass collected at the Apollo 12 site (e.g., Silver, 1971; Alexanderet al., 1976, 1977; Bogard et al., 1992). Tycho crater lies on the highland at 43◦S and 11◦W. Its age is estimated to be about 0.109 b.y. from a peak in Apollo 17 soil cosmic ray exposure ages (e.g., Drozdet al., 1974; Wolfeet al., 1975; Lucchitta, 1977). We adopt three high-resolution images taken by Lunar Orbiters 4 and 5 (Table 1). The LO5H127, LO5H153, and LO4H121 are photographs of the ejecta blanket of Tycho crater, and the ejecta blanket and floor of Copernicus crater, respectively. The maximum resolutions of these images are about 60 m, 2 m, and 2 m, respectively (Wilhelmset al., 1987).
We also investigate the crater size-frequency distributions in parts of Oceanus Procellarum and Mare Imbrium (Fig. 2). Oceanus Procellarum and Mare Imbrium are interpreted to be covered by basaltic volcanism that occurred between 3.10 and 3.25 and between 3.20 and 3.35 b.y. ago, respectively, from the radiometric ages of the rock samples returned by Apollo 12 and 15 (Basaltic Volcanism Study Project, 1981). While Wilhelmset al.(1987) claim that eruptions occurred in the Imbrian, Eratosthenian, and even Copernican systems, their age estimates are possibly subject to the population of craters in the diameter range discussed in this work. There are several craters larger than 25 km in diameter in this region (Fig. 2). Among these craters, Aristarchus (23.7◦N and 47.4◦W,D=40 km), Timocharis (26.7◦N and 13.1◦W,
D = 34 km), and Euler (23.3◦N and 29.2◦W, D = 28 km) craters belong to the Copernican system and DeLisle (29.9◦N and 34.6◦W, D =25 km) and Lambert (5.8◦N and 21.0◦W, D = 30 km) craters belong to the Eratosthenian system (Taylor, 1982; McEwen et al., 1997). We adopt a series of Apollo 15 metric photographs as well as panoramic photographs (Table 1) covering the region between 26◦N and 32◦N, and between 6◦W and 69◦W (Fig. 2). As listed in Table 1, those metric photographs cover a wider area than panoramic photographs (Fig. 2). The maximum resolutions of metric and panoramic photographs are 20 m and 2 m, respectively (Wilhelmset al., 1987).
2.2 Corrections of Apollo 15 metric and panoramic photographs
The metric and panoramic photographs were taken along tracks of the Apollo 15 orbiter. As a consequence, a sun elevation gradually changes from a few to 40 degrees. A correction for different solar angle has been made such that crater diameter increases from a measurement by 1 m per degree as sun elevation increases (Young, 1975, 1977).
Next we have made a small correction for the scale of printed photographs. Original sizes of the Apollo 15 metric and panoramic photographs are 5 by 5 and 5 by 48 inches, re-spectively. We have requested National Space Science Data Center to enlarge both metric and panoramic photographs by 2 and 3.2 times, respectively, so as to count small craters. At the same time, we extract only the central region (5 by 6.25 inches) from the original panoramic photograph because the image is highly distorted far from the center of the photo-graph. In order to account for differences of enlargement of each photograph, we have first measured in metric pho-tographs the diameter of the crater that has been already catalogued by Wilhelms et al. (1987). While some met-ric photographs lack the catalogued craters, all metmet-ric pho-tographs overlap each other (Fig. 2). Then the scales of those metric photographs have been interpolated from the over-laps with the adjacent photographs. Second, we have deter-mined the scales of the panoramic photographs from those of metric photographs by taking advantage of the fact that all panoramic photographs are overlapped by metric pho-tographs (Fig. 2). Finally, as an additional test, the lengths of letters “APOLLO” printed on the rim of the panoramic photographs are measured when they are found. Without the adjustment described above, the average and standard devi-ation of the length of the letters are 139 and 5 mm, respec-tively. Therefore the ambiguity in scale due to enlargement is less than 4%.
2.3 Other data sets
ob-tained from the detailed analyses of Clementine multispec-tral images (Yingst and Head, 1997, 1999; Budney and Lucey, 1998), basalt thickness estimates for Oceanus Procel-larum and Mare Imbrium have not been revised since DeHon (1979). For topography model, we adopt a set of spherical harmonic coefficients (GLTM-2) calculated from the topo-graphic data obtained by Clementine lidar experiment (Smith
et al., 1997). And for Bouguer gravity anomaly model of the
Moon, we adopt the harmonic coefficients JGL100J1
(Kono-plivet al., 1998; Wieczorek and Phillips, 1998; Konopliv
and Yuan, 1999). This gravity model is calculated from ra-dio tracking of the Lunar Orbiters 1 to 5, Apollo 15 and 16, Clementine, and Lunar Prospector spacecraft. The reference geoid is set to be a sphere of radius of 1738 km, and crustal and mean densities are assumed to be 2800 and 3340 kg m−3, respectively. Magnetic anomaly data are another possible source to constrain subsurface structures. However, because Halekaset al.(2001) find no clear association between ge-ologic features and magnetic anomalies in Lunar Prospector electron reflectometer measurements, we do not include a magnetic anomaly map in this study.
As a reference of regional geology, we adopt geologic and spectral maps of the moon by Pieters (1978), Whitford-Stark and Head (1980), and Wilhelmset al.(1987) (Table 1). For some provinces, elemental and mineralogical maps have been already revised on the basis of multispectral analyses of Clementine UVVIS images (e.g., Yingst and Head, 1999; Gillis and Spudis, 2000; Hiesingeret al., 2000a, b; Pieterset al., 2001; Staid and Pieters, 2001) and Lunar Prospectorγ -ray and neutron spectrometer data (Elphicet al., 1998;
Feld-manet al., 1998a, b; Lawrenceet al., 1998). However, we
do not adopt these newer maps for two reasons. First, many of these maps are not classified into geologic units. Second, when geologic units are interpreted, the crater density has been already taken into account in the classification. Thus these newer maps are neither applicable to nor independent from our tests.
3.
Results
3.1 Examination of statistical procedures
The result of crater count in each size bin is listed for all photographs in Table 2, and examples of the crater size-frequency distributions are shown in Figs. 3, 4, 5, and 6. In these figures, formal errors are calculated as a square root of the cumulative number of craters in each size bin. In prac-tice, however, it is possible that the bias of an individual researcher is greater than the statistical deviation (Basaltic Volcanism Study Project, 1981). We compare our results with previous works (Neukum and K¨onig, 1976; Guinness and Arvidson, 1977; Young, 1977) to evaluate the bias in our counts. In Figs. 3, 4, and 5, the results by Guinness and Arvidson (1977) and Young (1977) are shown for com-parison. While the differences of crater counts among the different workers are not negligible, the number densities agree each other in general. Two exceptions are the crater size-frequency distributions in a diameter range greater than 100 m in Fig. 3, and that of the Copernicus floor by Young (1977) in Figs. 4(a) and (b). A comparison with the re-sults by Neukum and K¨onig (1976) is made only graphi-cally because the numbers of craters counted by Neukum and
K¨onig (1976) are not available in the literature. Their crater counts on Copernicus floor and ejecta blanket are consistent with others while that on Tycho is markedly different. The cause of occasional differences among these databases is not clear. However, the general agreement supports the use of our crater counts.
We find the best-fit parameters of (1) for each photograph paying attention to the left/right-hand effect (Pickeringet al., 1995) and the goodness-of-fit. First, no crater smaller than 1 mm in diameter on Apollo metric and Lunar Orbiter pho-tographs is taken into account in our statistics. We set this criterion as a conservative lower bound through preliminary tests. For panoramic photographs, we have started with the crater counts of AS15-0260 (Table 1). Then we have con-firmed that craters smaller than 2.8 mm in diameter on the photograph (D =0.13∼ 0.18 km on the moon) are in the crater equilibrium (e.g., Gault, 1970; Chapman and McKin-non, 1986; Hartmann and Gaskel, 1997) (Table 2 and Fig. 6). Therefore the craters smaller than this diameter are not taken into account in the later counts of Apollo panoramic pho-tographs (Table 1). Although the craters at this diameter are not in the equilibrium in some photographs, our estimates of αandβ(Table 1) are little dependent on this lower bound of the diameter range (Table 2).
Second, in order to determine the diameter range of the steep slope segment in a statistical manner, we apply theχ2 test (Presset al., 1988) to our crater counts. We calculate α andβ for least-squares fit on cumulative plot, and then evaluate the goodness-of-fit, Q, for all diameter ranges to find a maximum value ofQfor each photograph. In Table 1, theαandβ, the maximum value ofQ, and the adopted range of diameter are summarized for each photograph. Among 48 photographs, the crater size-frequency distributions of three metric photographs revealβ greater than−3 (AS15-2480, 2490, and 1838). Because an obvious signature of the steep slope segment is absent, these photographs are excluded from the following discussions. In addition, the metric photograph AS15-2746 is also excluded, because the maximumQvalue is smaller than 0.1. The least-squares fit of this photograph is not statistically reliable (Press et al., 1988).
The variation ofαin Oceanus Procellarum and Mare Im-brium is shown in Fig. 7. It is clear in this figure thatα val-ues of the panoramic photographs show regional variations as large as a factor of 10. Such large variations cannot be ex-plained by statistical deviations. In contrast, variations ofα in the metric photographs is less than a factor of 3 (Table 1). As a test of internal consistency of our counts, we have com-pared the average density of panoramic photographs and that of metric photographs for the areas of overlap; both densi-ties match within a statistical error. A variation of a factor of 2 between adjacent photographs in Oceanus Procellarum is also found in the work by Young (1977). Therefore we con-sider that this regional variation is statistically significant. 3.2 The crater size-frequency distribution in young
craters
iden-Table 2. Incremental numbers of all crater counting. Boxes indicate bins adopted forχ2test in Table 1.
AS15-2064 AS15-2068 AS15-2072 AS15-2076
AS15-2060
Bin diameter, km Bin diameter, km Bin diameter, km Bin diameter, km Bin diameter, km
LO5H127 LO5H153 LO4H121 AS15-2056
0.72 - 1.01 171 18600 0.71 - 1.00 97 14600 0.71 - 1.00 155 18300 0.72 - 1.01 122 18600 0.70 - 1.00 146 24600
AS15-0264 AS15-0268 AS15-0272 AS15-0276
AS15-0260
Bin diameter, km Bin diameter, km Bin diameter, km Bin diameter, km Bin diameter, km
AS15-1838 AS15-1842 AS15-1846 AS15-1850
AS15-2480 AS15-2484 AS15-2746 AS15-2748 AS15-2490
tified in the crater size-frequency distributions on the ejecta blankets of Tycho and Copernicus craters. While the steep slope on Tycho ejecta blanket is not perceived by some previ-ous work (Basaltic Volcanism Study Project, 1981), the steep slope segment can be recognized in not only our results but also others (Young, 1977) (Figs. 3(a) and (b)). These results indicate that the endogenic crater hypothesis is implausible, because no volcanic activity is reported on the ejecta blan-kets of young Tycho and Copernicus craters. Even though post-impact volcanism is suggested for the floors of these
two craters (Basaltic Volcanism Study Project, 1981), the ob-served size-frequency distribution on the floor of the Coper-nicus crater (Table 2 and Fig. 4) is nearly identical with that on the ejecta blanket (Table 2 and Fig. 5).
3.3 A comparison with geophysical data sets
We consider the second hypothesis that attributes the steep segment of the crater size-frequency distributions to variable strength of target (Gault, 1970; Schultzet al., 1977;
Chap-manet al., 1979). Unfortunately, our knowledge on the
Table 2. (continued).
0.211 - 0.284 426 670 0.210 - 0.282 111 669 0.210 - 0.283 129 677 0.206 - 0.279 289 665 0.210 - 0.284 463 703
0.284 - 0.387 245 670 0.282 - 0.385 72 669 0.283 - 0.386 89 677 0.279 - 0.381 156 665 0.284 - 0.390 252 703
0.387 - 0.532 98 670 0.385 - 0.531 41 669 0.386 - 0.533 31 677 0.381 - 0.526 82 665 0.390 - 0.539 109 703
0.532 - 0.737 34 670 0.531 - 0.736 8 669 0.533 - 0.739 18 677 0.526 - 0.730 27 665 0.539 - 0.749 39 703
0.737 - 1.03 14 670 0.736 - 1.03 4 669 0.739 - 1.03 9 677 0.730 - 1.02 10 665 0.749 - 1.05 6 703
1.03 - 1.46 4 670 1.03 - 1.43 0 669 1.03 - 1.46 1 677 1.02 - 1.43 4 665 1.05 - 1.48 3 703
1.43 - 2.02 1 669 1.43 - 2.02 2 665
Number of craters per bin
Surface area, km2
Number of craters per bin
Surface area, km2
Number of craters per bin
Surface area, km2
Number of craters per bin
Surface area, km2
Number of craters per bin
Surface area, km2
0.200 - 0.272 442 644 0.197 - 0.267 356 622 0.193 - 0.263 452 613 0.194 - 0.264 521 624 0.185 - 0.252 200 568
0.272 - 0.373 222 644 0.267 - 0.367 178 622 0.263 - 0.362 291 613 0.264 - 0.363 286 624 0.252 - 0.347 125 568
0.373 - 0.515 114 644 0.367 - 0.507 70 622 0.362 - 0.501 157 613 0.363 - 0.504 108 624 0.347 - 0.481 59 568
0.515 - 0.716 33 644 0.507 - 0.706 17 622 0.501 - 0.697 38 613 0.504 - 0.702 21 624 0.481 - 0.671 23 568
0.716 - 1.00 5 644 0.706 - 0.988 2 622 0.697 - 0.977 13 613 0.702 - 0.984 10 624 0.671 - 0.941 7 568
1.00 - 1.40 4 644 0.988 - 1.38 1 622 0.977 - 1.37 2 613 0.984 - 1.38 3 624 0.941 - 1.32 1 568
1.40 - 1.98 1 644 1.38 - 1.95 1 622 1.37 - 1.94 1 613 1.38 - 1.95 1 624 1.32 - 1.85 0 568
1.85 - 2.61 1 568
2.61 - 3.69 1 568
3.69 - 5.22 1 568
0.193 - 0.264 326 649 0.186 - 0.254 301 596 0.182 - 0.249 309 577 0.176 - 0.243 550 572 0.205 - 0.284 509 668
0.264 - 0.365 257 649 0.254 - 0.352 231 596 0.249 - 0.345 284 577 0.243 - 0.338 287 572 0.284 - 0.397 253 668
0.365 - 0.508 142 649 0.352 - 0.490 172 596 0.345 - 0.481 174 577 0.338 - 0.472 101 572 0.397 - 0.556 109 668
0.508 - 0.709 27 649 0.490 - 0.684 77 596 0.481 - 0.671 39 577 0.472 - 0.661 18 572 0.556 - 0.780 27 668
0.709 - 0.995 4 649 0.684 - 0.960 31 596 0.671 - 0.943 11 577 0.661 - 0.931 8 572 0.780 - 1.09 9 668
0.995 - 1.39 1 649 0.960 - 1.34 16 596 0.943 - 1.32 3 577 0.931 - 1.30 2 572 1.09 - 1.54 4 668
1.39 - 1.97 2 649 1.34 - 1.90 6 596 1.32 - 1.87 3 577 1.30 - 1.84 1 572 1.54 - 2.18 0 668
1.90 - 2.67 1 596 2.18 - 3.08 1 668
2.67 - 3.78 0 596
3.78 - 5.35 1 596
AS15-0348
AS15-0324 AS15-0328 AS15-0332 AS15-0344
AS15-0320
Bin diameter, km Bin diameter, km Bin diameter, km Bin diameter, km Bin diameter, km
AS15-0304 AS15-0308 AS15-0312 AS15-0316
AS15-0284 AS15-0288 AS15-0292 AS15-0296 AS15-0300
0.185 - 0.257 413 600 0.181 - 0.251 502 587 0.181 - 0.253 490 613 0.159 - 0.222 517 495 0.158 - 0.221 711 505
0.257 - 0.359 140 600 0.251 - 0.352 169 587 0.253 - 0.354 204 613 0.222 - 0.310 231 495 0.221 - 0.309 283 505
0.359 - 0.502 34 600 0.352 - 0.493 59 587 0.354 - 0.496 68 613 0.310 - 0.435 90 495 0.309 - 0.434 104 505
0.502 - 0.705 7 600 0.493 - 0.697 8 587 0.496 - 0.697 14 613 0.435 - 0.611 17 495 0.434 - 0.611 25 505
0.705 - 0.994 3 600 0.697 - 0.983 4 613 0.611 - 0.861 8 495 0.611 - 0.862 7 505
0.994 - 1.41 1 600 0.983 - 1.38 2 613 0.861 - 1.21 1 495 0.862 - 1.21 1 505
1.38 - 1.95 1 613 1.21 - 1.71 1 495 1.21 - 1.71 1 505
1.71 - 2.41 1 495 1.71 - 2.42 0 505
2.41 - 3.41 1 495 2.42 - 3.42 0 505
3.42 - 4.84 0 505
4.84 - 6.84 1 505
Number of craters per bin
Surface area, km2
Number of craters per bin
Surface area, km2
Number of craters per bin
Surface area, km2
0.154 - 0.215 775 474 0.157 - 0.221 839 506 0.152 - 0.214 933 457
0.215 - 0.302 307 474 0.221 - 0.311 429 506 0.214 - 0.303 555 457
0.302 - 0.425 106 474 0.311 - 0.438 149 506 0.303 - 0.428 128 457
0.425 - 0.598 29 474 0.438 - 0.616 56 506 0.428 - 0.603 41 457
0.598 - 0.844 6 474 0.616 - 0.871 16 506 0.603 - 0.854 7 457
0.844 - 1.19 2 474 0.871 - 1.22 4 506 0.854 - 1.20 1 457
1.22 - 1.73 0 506 1.20 - 1.70 1 457
1.73 - 2.45 1 506
Bin diameter, km Bin diameter, km Bin diameter, km
AS15-0364 AS15-0366 AS15-0370
AS15-0352 AS15-0356 AS15-0358 AS15-0360 AS15-0362
we examine the correlation of the crater size-frequency dis-tribution with thickness of mare basalt (DeHon, 1979), to-pography (Smithet al., 1997), and Bouguer gravity anomaly (Konoplivet al., 1998; Wieczorek and Phillips, 1998; Kono-pliv and Yuan, 1999) assuming that these geophysical data sets are influenced by crustal structure.
The results are shown in Figs. 7, 8, and 9. In Fig. 7, we adopt 13 craters that lie in an area between 10◦W and 70◦W, and between 26◦N and 32◦N from the list by DeHon (1979). The mare thickness estimated from those 13 craters is shown as open squares in Fig. 7 by the longitude regardless of the latitude. In this figure, the mare thickness appears to have no correlation with crater size-frequency distributions of ei-ther metric or panoramic photographs. The topography and
Bouguer gravity anomaly at the center of each photograph are calculated by using sets of spherical harmonic coeffi-cients, GLTM-2 (Smithet al., 1997) and JGL100J1
(Kono-plivet al., 1998; Wieczorek and Phillips, 1998; Konopliv and
Yuan, 1999), respectively. It is evident in Figs. 8 and 9 that no significant correlation is found between the crater size-frequency distributions and the topography or Bouguer grav-ity anomaly. Consequently correlations calculated for these data sets are low (Table 3). Thus, the variable target hypoth-esis is not supported from the present data sets.
3.4 A comparison with geologic units
10-5 10-3 10-1 101
10-2 10-1 100 101
Cumulative crater size-frequency
distribution [km
-2 ]
Crater diameter [km] (a)
10-2 10-1 100 101
10-4 10-3 10-2 10-1 100
R-parameter
Crater diameter [km] (b)
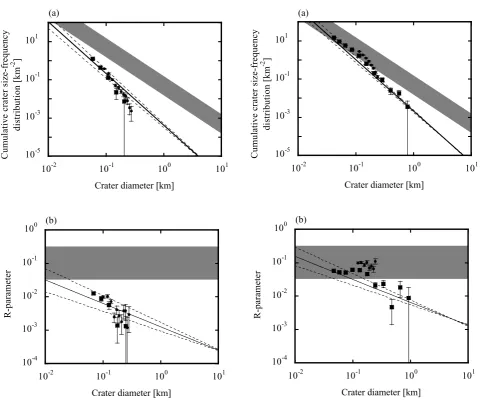
Fig. 3. A crater size-frequency distribution on the ejecta blanket surround-ing Tycho crater (LO5H127). Solid circles and squares are the crater size-frequency distributions from Young (1977) and this work, respec-tively. Solid and dotted lines are an average and errors determined by Guiness and Arvidson (1977). The shaded band indicates crater equilib-rium for which the value ofαis between 0.15 and 0.015 (Melosh, 1989). (a) Cumulative, and (b) R plots (Crater Analysis Techniques Working Group, 1979; Stromet al., 1992).
test of this hypothesis is to compare the crater size-frequency distribution of the photographs in Table 1 with radiometric age at each location. For example, Young (1977) argues that a ratio of crater number density for Copernicus to that for Tycho at a-100-m diameter is consistent with approximate ages of these craters. While our counts reveal a similar ratio at this diameter (Figs. 3 and 5), it is obvious from the low negativeβ values in Table 1 that the ratio strongly depends on diameter.
For Oceanus Procellarum and Mare Imbrium, a direct comparison between the size-frequency distribution and the radiometric age is difficult because of a lack of samples to be measured. Instead we compare theαvalue of each pho-tograph with classification in geologic maps (Pieterset al., 1975; Headet al., 1978; Pieters, 1978; Whitford-Stark and Head, 1980; Wilhelmset al., 1987) assuming that each ge-ologic unit represents the same surface age (Figs. 10(a), (b),
10-5 10-3 10-1 101
10-2 10-1 100 101
Cumulative crater size-frequency
distribution [km
-2 ]
Crater diameter [km] (a)
10-2 10-1 100 101
10-4 10-3 10-2 10-1 100
R-parameter
Crater diameter [km] (b)
Fig. 4. A crater size-frequency distribution on the floor within Copernicus crater (LO5H153). Lines and symbols are the same as in Fig. 3. (a) Cumulative, and (b) R plots (Crater Analysis Techniques Working Group, 1979; Stromet al., 1992).
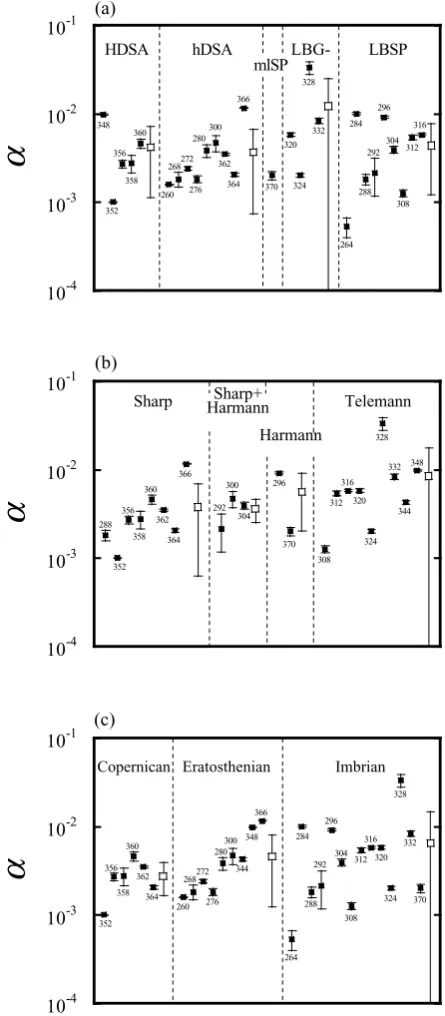
and (c)). In Figs. 10(a), (b), and (c), we classify theαvalues by geologic and spectral units. And also we show an aver-age and a standard deviation ofαin the same geologic unit by open squares. Because the standard deviation is much greater than errors of each photograph, no relation is found between theαvalues and geologic classification. Therefore we conclude that the primary production hypothesis is un-likely.
10-5 10-3 10-1 101
10-2 10-1 100 101
Cumulative crater size-frequency
distribution [km
-2 ]
Crater diameter [km] (a)
10-2 10-1 100 101
10-4 10-3 10-2 10-1 100
R-parameter
Crater diameter [km] (b)
Fig. 5. A crater size-frequency distribution on the ejecta blanket of Coper-nicus crater (LO4H121). Lines and symbols are the same as in Fig. 3. (a) Cumulative, and (b) R plots (Crater Analysis Techniques Working Group, 1979; Stromet al., 1992).
as the distance increases.
We select 12 large craters with diameter sufficiently large to form secondary craters (Shoemaker, 1965) and examine the crater density with increasing distance from the large crater. They are Archimedes, Aristarchus, DeLisle, Dio-phantus, Euler, Herodotus, Lambert, Timocharis, Krieger, Lichtenberg, Pytheas (Fig. 2), and Copernicus craters. Then it is found that Aristarchus crater is a possible source of the secondary craters not only because the correlation is the highest (Table 3), but also because theαvalue decreases with the inverse of distance (Fig. 11). Figure 11 indicates that the secondary craters hypothesis is the most likely to explain the steep slope segment of the crater size-frequency distribution, and that isolated secondary craters play an important role in the crater size-frequency distribution.
4.
Discussion
4.1 Elimination of the primary crater hypothesis Before the primary production hypothesis is rejected, we should allow for the possibility that the classification in the geologic maps is incorrect. As evident in Table 1, there is
10-5 10-3 10-1 101
10-2 10-1 100 101
Cumulative crater size-frequency
distribution [km
-2 ]
Crater diameter [km] (a)
10-2 10-1 100 101
10-4 10-3 10-2 10-1 100
R-parameter
Crater diameter [km] (b)
Fig. 6. A crater size-frequency distribution of AS15-0260. Lines and symbols are the same as in Fig. 3. (a) Cumulative, and (b) R plots (Crater Analysis Techniques Working Group, 1979; Stromet al., 1992).
10-4 10-3 10-2 10-1
0
0.2
0.4
0.6
10 20 30 40 50 60 70
α
Basalt thickness, km
West longitude [degree]
10-4 10-3 10-2 10-1
-2400 -2000 -1600 -1200
α
Topography [m]
Fig. 8. Cumulative crater size-frequency distributions and topogra-phy. Solid circles, triangles, and squares indicate metric 1 and 2, and panoramic photographs, respectively (Table 1).
10-4 10-3 10-2 10-1
160 170 180 190 200 210 220 230
α
Bouguer gravity anomaly [mGal]
Fig. 9. Cumulative crater size-frequency distributions and Bouguer gravity anomaly. Solid circles, triangles, and squares indicate metric 1, metric 2, and panoramic photographs, respectively (Table 1).
Table 3. Correlation of crater size-frequency distribution with other data sets (Smithet al., 1997; Konoplivet al., 1998; Wieczorek and Phillips, 1998).
Data set Correlation Figure
Topography 0.005 8
Bouguer gravity anomaly 0.051 9
Distance from Aristarchus crater 0.474 11
a notable discrepancy among the geologic maps by differ-ent workers (Pieterset al., 1975; Headet al., 1978; Pieters, 1978; Whitford-Stark and Head, 1980; Wilhelms et al., 1987). If the steep slope segment of the lunar crater size-frequency distribution is indeed indicating the surface age as proposed by Neukum and Ivanov (1994), the large variation of α(Fig. 7) suggests that the current geologic maps need to be fully revised, and that the scale of geologic units may be significantly smaller than currently accepted (Hiesinger
et al., 2000a, b; Rajmon and Spudis, 2001). Thus, a
vol-canic history more complicated than our present knowledge
10-4 10-3 10-2 10-1
α
HDSA hDSA LBG- LBSP mlSP
Fig. 10. A comparison of theαvalues of panoramic photographs (Table 1) with geologic or taxologic units. Numbers next to symbols indicate pho-tograph numbers in Tables 1 and 2. For each unit the average ofαvalues and the standard deviation are shown by open squares. Classifications are based on (a) a spectral map compiled by Wilhelmset al.(1987, pl. 4) from Pieterset al., (1975), Headet al.(1978), and Pieters (1978), (b) a geologic map by Whitford-Stark and Head (1980), and (c) a geologic map by Wilhelmset al.(1987, pl. 12).
10-4 10-3 10-2 10-1
100 200 300 400 500 600 700
5 10 15
α
Distance from Aristarchus crater [km] Distance [normalized by the crater diameter]
328
260
264 268 272
276 280 284
288 292 296 300
304
308 312
316
320
324 332
344 348
352 356 358
360 362
364 370 366
Fig. 11. A variation ofαwith distance from Aristarchus crater. Dashed line is 25 (normalized distance)−1, and numbers next to symbol indicate photograph numbers in Tables 1 and 2. Upper horizontal axis is the distance normalized by the crater diameter (40 km).
geochemical studies of lunar samples, even though the clas-sification in geologic maps may include significant uncer-tainty.
So far we have presented evidence that the primary pro-duction hypothesis is unlikely. The most important implica-tion of this interpretaimplica-tion is that small craters should not be taken into account in the crater chronology. The “Nesting-photo technique” (Basaltic Volcanism Study Project, 1981) is not recommended in counting small craters, either. De-spite the warning given by Basaltic Volcanism Study Project (1981), use of small craters for detailed dating appears to be widely accepted (e.g., Greeleyet al., 1993; Neukum and Ivanov, 1994; Hartmannet al., 1999, Hartmann and Berman, 2000). Unless new evidence for the primary production hy-pothesis is found, we should use only large craters in the crater chronology.
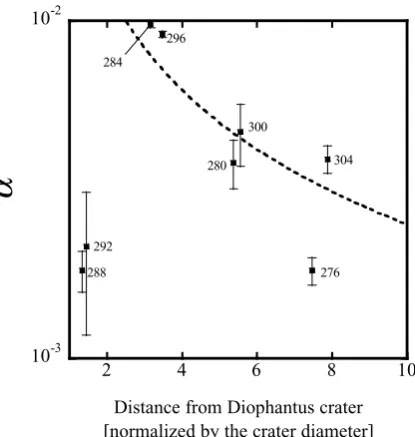
4.2 Examination of the secondary crater hypothesis In Subsection 3.5, we conclude that the secondary crater hypothesis is the most likely, but a few problems remain. First, there are several outlying points in Fig. 11. Among those, highαvalues of AS15-0284, 0296, and other nearby photographs can be explained by a superposition of the sec-ondary craters from Diophantus crater (27.6◦N and 34.3◦W, 18-km diameter, Fig. 2) (Taylor, 1982). In Fig. 13, we show theαvalues of the panoramic photographs within 10 crater diameters from Diophantus crater. According to the geo-logic map by Wilhelmset al.(1987), AS15-0288 and 0292 are covered by the ejecta blankets from Diophantus crater. Therefore two lowα values adjacent to Diophantus crater are plausible. Otherwise, theαvalue decrease with inverse distance as Fig. 11. Similarly, the high value of αin the photograph AS15-0328 occurs because the area is partially covered by a ray from the Aristarchus crater (Moore, 1965) (Fig. 2) and includes numerous clusters of secondary craters. Because rays are composed of diffuse patches and
filamen-0 5 10 15 20
3 3.1 3.2 3.3 3.4
39
Ar-40Ar age Rb-Sr age Sm-Nd age
Number of samples
Radiometric age [b.y.]
Fig. 12. A histogram of radiometric ages of Apollo 12 samples. Black, gray, and white boxes indicate39Ar-40Ar ages, Rb-Sr ages, and Sm-Nd ages, respectively (Basaltic Volcanism Study Project, 1981, Table 7.3.1).
10-3 10-2
2 4 6 8 10
α
Distance from Diophantus crater 288
292 284
296
300
304 280
276
[normalized by the crater diameter]
Fig. 13. A variation ofαwith distance from Diophantus crater. Dashed line is 25 (normalized distance)−1, and numbers next to symbols indicate photograph numbers in Tables 1 and 2. The distance is normalized by the crater diameter (18 km).
tary streaks, the influence of the rays complicates the inter-pretation of Fig. 11. For other outlying points in Fig. 11, no particular inference has been made.
Thus our results suggest that only particular craters, such as Aristarchus and Diophantus craters in this study, form a number of secondary craters sufficient to influence the size-frequency distribution in the surrounding area. This interpre-tation may explain the conflict of our argument with that of Neukumet al.(1975), who have demonstrated that the size-frequency distribution of small craters in Mare Serenitatis is little dependent on a distance from Bessel crater and there-fore have rejected the secondary crater hypothesis.
Figures 11 and 13 imply that the secondary craters and the ejecta blanket play important roles on the size-frequency distribution of small craters. However, neither their roles nor a mechanism to produce the secondary craters have been fully understood yet (e.g., Chapman and McKinnon, 1986). Advances in experimental studies of hyper-velocity impact (e.g., Gault and Wedekind, 1978; Yamamoto and Nakamura, 1997; Yamamoto, 2002) are necessary. As well, comparative tests in different regions, using high-resolution images that are expected from future lunar missions (Mizutani, 1995; Sasakiet al., 1999), are important.
5.
Conclusions
Most of the crater size-frequency distributions on sur-faces from Imbrian to Copernican ages of the moon reveal the steep-slope segment for diameters smaller than a few km. The endogenic crater hypothesis cannot account for the steep slope of the crater size-frequency distributions on ejecta blankets of young Tycho and Copernicus craters. At the same time, the crater size-frequency distribution has little to do with basalt thickness, topography, or Bouguer gravity anomaly. Therefore it is unlikely that the physical property of subsurface materials influences the steep slope segment of the crater size-frequency distribution. The regional vari-ation of the crater size-frequency distributions in Mare Im-brium and Oceanus Procellarum appears to have no correla-tion with the geologic classificacorrela-tion, thus allowing rejeccorrela-tion of the primary production hypothesis. We note that craters smaller than a few km should not be adopted for age determi-nation. Finally regional variations of the size-frequency dis-tributions reveal a close relation with a distance from a local large crater. Isolated secondary craters are the likely cause of the steep slope segment, although the reason why only a small number of craters form numerous secondary craters is unknown.
Needless to say, the area studied in this work is limited in both space and geologic ages. Therefore it is difficult to rule out completely any hypotheses. However, our results do indicate that creation of the small craters is more complex than previously thought. New high-resolution images from future lunar explorations and experimental studies on crater-ing mechanisms may yield new insights.
Acknowledgments. The Lunar Orbiter and Apollo photographs were processed at and provided by the National Space
Sci-ence Data Center. Some of the Lunar Orbiter photographs
were processed at and provided by the Regional Planetary Im-age Facility in the Institute of Space and Astronautical Sci-ence. The lunar gravity model JGL100J1 and topography model GLTM-2 were supplied by Geophysics Subnode of NASA’s Planetary Data System (PDS) via the World Wide Web at: http://pds-geophys.wustl.edu/pds/. We gratefully
acknowledge Jennifer A. Grier and an anonymous reviewer for crit-ical and thoughtful comments. We also thank Patrick J. McGovern for his comments to the revised manuscript. This research was sup-ported by the Ministry of Education of Japan under the grants-in-aid for Encouragement of Young Scientist (08740364, 09740382, and 12740265).
References
Alexander, E. C., Jr., A. Bates, M. R. Coscio, Jr., J. C. Dragon, V. R. Murthy, R. O. Peping, and T. R. Venkatesan, K/Ar dating of lunar soils II,Proc. Lunar Sci. Conf. 7th, 625–648, 1976.
Alexander, E. C., Jr., M. R. Coscio, Jr., J. C. Dragon, R. O. Peping, and K. Saito, K/Ar dating of lunar soils III: Comparison of39Ar-40Ar and conventional techniques; 12032 and the age of Copernicus,Proc. Lunar Sci. Conf. 8th, 2725–2740, 1977.
Basaltic Volcanism Study Project, Basaltic Volcanism on the Terrestrial Planets, 1286 pp., Pergamon, New York, 1981.
Bogard, D. D., D. H. Garrison, D. S. McKay, and S. J. Wentworth, The age of Copernicus: New evidence for 800±15 million years (abstract),Lunar Planet. Sci.,23, 133–134, 1992.
Budney, J. C. and P. G. Lucey, Basalt thickness in Mare Humorum: The crater excavation method,J. Geophys. Res.,103, 16855–16870, 1998. Chapman, C. R. and W. B. McKinnon, Cratering of planetary satellites,
inSatellites, edited by J. A. Burns and M. S. Matthews, pp. 492–580, Arizona University Press, Tucson, 1986.
Chapman, C. R., J. A. Mosher, and G. Simmons, Lunar cratering and erosion from Orbiter 5 photographs,J. Geophy. Res., 75, 1445–1466, 1970.
Chapman, C. R., J. C. Aubele, W. J. Roberts, and J. A. Cutts, Sub-kilometer lunar craters: Origins, ages, processes of degradation, and implications for mare basalt petrogenesis (abstract),Lunar Planet. Sci.,10, 190–191, 1979.
Chapman, C. R., J. Veverka, M. J. S. Belton, G. Neukum, and D. Morrison, Cratering on Gaspra,Icarus,120, 231–245, 1996.
Crater Analysis Techniques Working Group, Standard techniques for pre-sentation and analysis of crater size-frequency data,Icarus,37, 467–474, 1979.
DeHon, R. A., Thickness of the western mare basalts,Proc. Lunar Planet. Sci. Conf. 10th, 2935–2955, 1979.
DeHon, R. A. and J. D. Waskom, Geologic structure of the eastern mare basins,Proc. Lunar Sci. Conf. 7th, 2729–2746, 1976.
Drozd, R. J., C. M. Hohenberg, C. J. Morgan, and C. E. Ralston, Cosmic ray exposure history at the Apollo 16 and other lunar sites: lunar surface dynamics,Geochim. Cosmochim. Acta,38, 1625–1642, 1974.
Elphic, R. C., D. J. Lawrence, W. C. Feldman, B. L. Barraclough, S. Mauris, A. B. Binder, and P. G. Lucey, Lunar Fe and Ti abundances: Composition of Lunar Prospector and Clementine data, Science, 281, 1493–1496, 1998.
Feldman, W. C., B. L. Barraclough, S. Mauris, R. C. Elphic, D. J. Lawrence, D. R. Thomsen, and A. B. Binder, Major compositonal units of the Moon: The Lunar Prospector thermal and fast neutrons,Science, 281, 1489– 1493, 1998a.
Feldman, W. C., S. Mauris, A. B. Binder, B. L. Barraclough, R. C. Elphic, and D. J. Lawrence, Fluxes of fast and epithermal neutrons from Lunar Prospector: Evidence for water ice at the lunar pole,Science,281, 1496– 1500, 1998b.
Gault, D. E., Saturation and equilibrium conditions for impact cratering on the lunar surface: Criteria and implications,Radio Sci.,5, 273–291, 1970. Gault, D. E. and J. A. Wedekind, Experimental studies of oblique impact,
Proc. Lunar Planet. Sci. Conf. 9th, 3843–3875, 1978.
Gillis, J. J. and P. D. Spudis, Geology of the Smythii and Marginis region of the Moon: Using integrated remotely sensed data,Science,105, 4217– 4233, 2000.
Greeley, R., S. D. Kadel, D. A. Williams, L. R. Gaddis, J. W. Head, A. S. McEwen, S. Murchie, E. Nagel, G. Neukum, C. M. Pieters, J. M. Sunshine, R. Wagner, and M. J. S. Belton, Galileo observation of lunar maria and related deposits,J. Geophys. Res.,98, 17183–17206, 1993. Guinness, E. A. and R. E. Arvidson, On the constancy of the lunar cratering
flux over the past 3.3×10⁹yr,Proc. Lunar Sci. Conf. 8th, 3475–3494, 1977.
Halekas, J. S., D. L. Mitchell, R. P. Lin, S. Frey, L. L. Hood, M. H. Ac˜una, and A. B. Binder, Mapping of crustal magnetic anomalies on the lunar near side by the Lunar Prospector electron reflectometer, J. Geophys. Res.,106, 27841–27852, 2001.
count choronology and geological implications,J. Geophys. Res.,105, 15011–15025, 2000.
Hartmann, W. K. and R. W. Gaskel, Planetary cratering 2: Studies of saturation equilibrium,Meteorit. Planet. Sci.,32, 109–121, 1997. Hartmann, W. K., M. Malin, A. McEwen, M. Carr, L. Soderblom, P.
Thomas, E. Danielson, P. James, and J. Veverka, Evidence for recent volcanism on Mars from crater counts,Nature,397, 586–589, 1999. Head, J. W., J. B. Adams, T. B. McCord, C. M. Pieters, and S. H. Zisk,
Regional stratigraphy and geologic history of Mare Crisium, inMare cri-sium, the view from Luna 24: proceedings of the Conference on Luna 24, Houston, Texas, December 1–3, 1977/compiled by Lunar and Plan-etary Institute (Geochimica et Cosmochimica Acta. suppl. 9), pp. 43–74, Pergamon, New York, 1978.
Hiesinger, H., J. W. Head, U. Wolf, and G. Neukum, Lunar mare basalts in Oceanus Procellarum: Initial results on age and composition (abstract),
Lunar Planet. Sci.(CD-ROM),31, #1278, 2000a.
Hiesinger, H., R. Jaumann, G. Neukum, and J. W. Head, Ages of mare basalts on the lunar nearside, J. Geophys. Res., 105, 29239–29275, 2000b.
Konopliv, A. S. and D. N. Yuan, Lunar Prospector 100th degree gravity model development (abstract),Lunar Planet. Sci.(CD-ROM),30, #1067, 1999.
Konopliv, A. S., A. B. Binder, L. L. Hood, A. B. Kucinskas, W. L. Sjogren, and J. G. Williams, Improved gravity field of the moon from Lunar Prospector,Science,281, 1476–1480, 1998.
Kuiper, G. P., R. G. Strom, and R. S. Le Poole, Interpretation of the Ranger records, in Ranger VIII and IX. part II. Experimenters’ Analyses and Interpretation,Jet Propulsion Lab. Tech. Rep., 32–248, 1966.
Lawrence, D. J., W. C. Feldman, B. L. Barraclough, A. B. Binder, R. C. Elphic, S. Mauris, and D. R. Thomsen, Global elemental maps of the Moon: The Lunar Prospector gamma-ray spectrometer,Science,281, 1484–1489, 1998.
Lucchita, B. K., Crater clusters and light mantle at the Apollo 17 site: A result of secondary impact from Tycho,Icarus,30, 80–96, 1977. McEwen, A. S., J. M. Moore, and E. M. Shoemaker, The Phanerozoic
impact cratering rate: Evidence from the farside of the Moon,J. Geophys. Res.,102, 9231–9242, 1997.
Melosh, H. J., Impact Cratering: A Geologic Process, 245 pp., Oxford University Press, New York, 1989.
Mizutani, H., Lunar interior exploration by Japanese Lunar penetrator mis-sion, Lunar-A,J. Phys. Earth,43, 657–670, 1995.
Moore, H. J., Geologic map of the Aristarchus region of the Moon: USGS Map1-465, scale 1:1,000.000, 1965.
Neukum, G. and B. A. Ivanov, Crater size distributions and impact probabil-ities on Earth from lunar, terrestrial-planet, and asteroid cratering data, in
Hazards Due to Comets and Asteroids, edited by T. Gehrels, pp. 359–416, Univ. of Arizona Press, Tucson, 1994.
Neukum, G. and B. K¨onig, Dating of individual lunar craters,Proc. Lunar Sci. Conf. 7th, 2867–2881, 1976.
Neukum, G. and D. U. Wise, Mars: A standard crater curve and possible new time scale,Science,194, 1381–1387, 1976.
Neukum, G., B. K¨onig, and J. Arkani-Hamed, A study of lunar impact crater size-distributions,The Moon,12, 201–229, 1975.
Pickering, G., J. M. Bull, and D. J. Sanderson, Sampling power-law distri-butions,Tectonophys.,248, 1–20, 1995.
Pieters, C. M., Mare basalt types on the front side of the moon: A summary of spectral reflectance data,Proc. Lunar Planet. Sci. Conf. 9th, 2825– 2849, 1978.
Pieters, C. M., J. W. Head, T. B. McCord, J. B. Adams, and S. H. Zisk, Geochemical and geological units of Mare Humorum: Definition using remote sensing and lunar sample information,Proc. Lunar Sci. Conf. 6th, 2689–2710, 1975.
Pieters, C. M., J. W. Head, L. Gaddis, B. Jolliff, and M. Duke, Rock types of South Pole-Aitken basin and extent of basaltic volcanism,J. Geophys. Res.,106, 28001–28022, 2001.
Press, W. H., B. P. Flannery, S. A. Teukolsky, and W. T. Vetterling, Numeri-cal Recipes in C, 735 pp., Cambridge Univ. Press, Cambridge, 1988. Rabinowitz, D., E. Bowell, E. Shoemaker, and K. Muinonen, The
popula-tion of Earth-crossing asteroids, inHazards Due to Comets and Asteroids, edited by T. Gehrels, pp. 285–314, Univ. of Arizona Press, Tucson, 1994. Rajmon, D. and P. Spudis, Mixing of the mare regolith: A Clementine test
(abstract),Lunar Planet. Sci.(CD-ROM),31, #1372, 2001.
Sasaki, S., Y. Iijima, K. Tanaka, M. Kato, M. Hashimoto, H. Mizutani, K. Tsuruda, and Y. Takizawa, Scientific research in the SELENE mission, paper IAF-99-Q.4.04, 50th International Astronautical Congress, Ams-terdam, 4–8 October, 1999.
Schultz, P., R. Greeley, and D. Gault, Degradation of small mare surface features,Proc. Lunar Sci. Conf. 7th, 985–1003, 1976.
Schultz, P., R. Greeley, and D. Gault, Interpreting statistics of small craters,
Proc. Lunar Sci. Conf. 8th, 3539–3564, 1977.
Shoemaker, E. M., Preliminary analysis of fine structure of the lunar surface in Mare Cognitum, in Ranger 7, part 2, Experimenters’ Analyses and Interpretations, JPL, Technical Report 32-700, 75–132, 1965.
Silver, L. T., U-Th-Pb isotope systems in Apollo 11 and 12 regolithic materials and a possible age for the Copernican impact,Eos Trans. AGU, 52, 534, 1971.
Smith, D. E., M. T. Zuber, G. A. Neumann, and F. G. Lemoine, Topography of the Moon from the Clementine lidar,J. Geophys. Res.,102, 1591– 1611, 1997.
Staid, M. I. and C. M. Pieters, Mineralogy of the last lunar basalts: Results from Clementine,J. Geophys. Res.,105, 27887–27900, 2001.
Strom, R. G., S. K. Croft, and N. G. Barlow, The Martian impact cratering record, inMars, edited by H. H. Kieffer, B. M. Jakosky, C. W. Snyder, and M. S. Matthews, pp. 383–423, Arizona University Press, Tucson, 1992.
Taylor, S. R.,Planetary Science: A Lunar Perspective, 481 pp., Lunar and Planetary Institute, Houston, 1982.
Veverka, J., P. C. Thomas, M. Robinson, S. Murchie, C. Chapman, M. Bell, A. Harch, W. J. Merline, J. F. Bell, B. Bussey, B. Carcich, A. Cheng, B. Clark, D. Domingue, D. Dunham, R. Farquhar, M. J. Gaffey, E. Hawkins, N. Izenberg, J. Joseph, R. Kirk, H. Li, P. Lucey, M. Malin, L. McFadden, J. K. Miller, W. M. Owen, C. Peterson, L. Prockter, J. Warren, D. Wellnitz, B. G. Williams, and D. K. Yeomans, Imaging of small-scale features on 433 Eros from NEAR: Evidence for a complex regolith,Science,292, 484–488, 2001.
Weitz, C. M. and J. W. Head, Spectral properties of the Marius Hills volcanic complex and implications for the formation of lunar domes and cones,J. Geophys. Res.,104, 18933–18956, 1999.
Wieczorek, M. A. and R. J. Phillips, Potential anomalies on a sphere: Applications to the thickness of the lunar crust,J. Geophys. Res.,103, 1715–1724, 1998.
Whitford-Stark, J. L. and J. W. Head, Stratigraphy of Oceanus Procellarum basalts: Sources and styles of emplacement,J. Geophys. Res.,85, 6579– 6609, 1980.
Wilhelms, D., V. Oberbeck, and H. Aggarwal, Size-frequency distribution of primary and secondary lunar impact craters,Proc. Lunar Sci. Conf. 9th, 3735–3762, 1978.
Wilhelms, D., J. McCauley, and N. Trask, The Geologic History of the Moon, 302 pp., USGS Professional Paper 1348, 1987.
Wolfe, E. W., B. K. Lucchitta, V. S. Reed, G. E. Ulrich, and A. G. Sanchez, Geology of the Taurus-Littrow valley floor,Proc. Lunar Sci. Conf. 6th, 2463–2482, 1975.
Yamamoto, S., Measurement of impact ejecta from regolith targets in oblique impacts,Icarus,158, 87–97, 2002.
Yamamoto, S. and A. M. Nakamura, Velocity measurements of impact ejecta from regolith targets,Icarus,128, 160–170, 1997.
Yingst, R. A. and J. W. Head, Volumes of lunar lava ponds in South Pole-Aitken and Orientale basins: Implications for eruption conditions, trans-port mechanism, and magma source regions, J. Geophys. Res., 102, 10909–10931, 1997.
Yingst, R. A. and J. W. Head, Geology of mare deposits in South Pole-Aitken basin as seen by Clementine UV/VIS data,J. Geophys. Res.,104, 18957–18979, 1999.
Young, R. A., Mare crater size-frequency distributions: Implications for relative surface ages and regolith development,Proc. Lunar Sci. Conf. 6th, 2645–2662, 1975.
Young, R. A., The lunar impact flux, radiometric age correlation, and dating of specific lunar features,Proc. Lunar Sci. Conf. 8th, 3457–3473, 1977.