Postdiction and the effects of spatial, temporal,
and feature compatibility on sensory integration
Thesis by Dylan Nieman
In Partial Fulfillment of the Requirements For the Degree of
Doctor of Philosophy
California Institute of Technology Pasadena, California
2007
First, I would like to acknowledge Shinsuke Shimojo for his mentorship, scholarship and support throughout this lengthy process. I would also like to thank the other scientists who have mentored me during the production of this work: Bhavin Sheth, Romi Nijhawan, Ryusuke Hayashi, and most notably Richard Andersen. For their fellowship, I would like to recognize my lab-mates and colleagues Junghyun Park, Patricia Neil, Daw-an Wu, Claudiu Simion, Beena Khurana, and Katz Watanabe. For assistance with the production of experimental equipment I would like to recognize Mike Walsh and Rick Paniagua. And for experimental assistance with vestibular experiments, I would like to thank Andrew Hsieh.
The brain continually integrates stimuli over multiple sensory modalities and reconciles often disparate information into a unified, consistent representation of the surrounding
environment. This process must be robust to differential neural latencies and imperfect alignments of spatial reference frames between sensory modalities. Numerous studies have examined the perception of multisensory stimuli with the presumption that multisensory
integration is categorically different from within-modality integration. We looked at a variety of issues related to the updating of sensory reference frames and the integration of unimodal and multimodal stimuli over temporal and spatial disparities. Study 1 found simultaneous, opposite gaze-dependent aftereffects at the same retinal location for both depth and color, demonstrating the degree to which visual-coordinate space is gaze-contingent, not merely retinotopic. Study 2 found that the flash-lag effect, in which a flashed target is perceived as lagging behind a smoothly moving target, generalizes to third-order motion perception of cyclopean stimuli. Study 3
Acknowledgments . . . iii
Abstract . . . iv
Table of Contents . . . vi
List of Figures . . . vii
Chapter 1: Coordinate Frames, Multisensory Perception, and Postdiction . . . 1
Chapter 2: Study 1: Gaze Direction Modulates Visual Aftereffects in Depth and Color . . . 8
Chapter 3: Study 2: Cyclopean Flash-Lag Illusion . . . 27
Chapter 4: Study 3: The Turn-Point Phantom . . . 38
Chapter 5: Study 4: Vestibular Influence on Position Encoding of Visual and Auditory Stimuli . . . 57
Chapter 6: Study 5: Synchrony in Opposite Hemifield and Peripheral Ventriloquism . . . 82
Chapter 7: Study 6: Repetition Suppression . . . 114
Chapter 8: General Discussion . . . 141
Chapter 2: Study 1 Figures . . . 22
Chapter 3: Study 2 Figures . . . 36
Chapter 4: Study 3 Figures . . . 53
Chapter 5: Study 4 Figures . . . 73
Chapter 6: Study 5 Figures . . . 98
Chapter 7: Study 6 Figures . . . 127
Chapter 1: Coordinate Frames, Multisensory Perception, and Postdiction
The human brain is continually bombarded with an overwhelming depth and breadth of spatial and temporal information that must somehow be synthesized into a common and
consistent perceptual experience of the surrounding world. This information comes from
multiple senses, in different reference frames, with different inherent neural latencies. In order to effectively reconcile competing and corroborating perceptual reports across time, space, and sensory modality, information must be represented in a common space and integrated over time. One of the more complex problems in the study of multisensory perception and awareness involves understanding how the brain integrates across such diverse information streams in order to reconcile perceptual time and space, what the relevant parameters affecting integration are, and when the time-window is over which integration occurs.
Coordinate Transformation
rotating or translating through space, the retinal coordinate space shifts, and the brain must take into account cues from the vestibular system to track these shifts. All of this extra-retinal information—gaze direction, head position, body movement within the environment—must be consistently integrated with the retinal information in order to maintain a consistent
representation of visual space over time.
In a similar fashion, our ears monitor air pressure changes and use interaural timing and intensity differences to perceive sound in space. Auditory information naturally exists in a head-centered reference space, and information related to the continued monitoring of head position— neck position, body movement within the environment—must be utilized in maintaining a consistent representation of visual space over time.
Multisensory Integration
Just as perception within each sensory modality must utilize information about how the correlation between its coordinate map and the outside world changes, unified perception across sensory modalities requires information about how each modality’s coordinate space correlates. Unless this information about relative coordinate frame mappings is perfect some discrepancy in position representation across modalities will arise, therefore multisensory perceptual systems must be robust to some degree of spatial disparity between modalities.
Multisensory perceptual systems must also be robust to some degree of temporal disparity between modalities in order to properly bind representations of multi-modal stimuli. This is for two reasons: first, visual and auditory information travels through the outside world at vastly different rates, and second, visual and auditory information have different neural latencies in the brain. Light travels through the atmosphere at speeds that are (for these purposes)
290 ms out of sync. Yet the brain has no problem experiencing the visual and auditory events as unified at a variety of different relative synchronies. There are, of course, limits to this
experience of unity even for singular events (think of the discrete experiences of thunder and lightning). Compounding this, the passage of visual and auditory information through their relevant sensory organs and neural circuits to multimodal regions of the brain involves different inherent latencies. For the superior colliculus, a brain region involved in orienting behaviors and the planning of eye movements, the discrepancy range across 90% of the population is between 20 and 115 ms (Meredith, Nemitz, and Stein 1987).
This consistent unified experience of multisensory stimuli must involve integration across modality that is robust to some degree of discrepancy in both the spatial and temporal alignment of stimulus representation.
Perception and Physiology
In the stream-bounce illusion (Sekuler, Sekuler, and Lau 1997), the perception of an ambiguous, spatial coincidence event is categorically changed by the timing of an auditory stimulus. Two identical disks, starting in opposite top corners of a computer screen and moving diagonally down to opposite corners such that they cross in the center, can be perceived as crossing and streaming past each other, or reflecting and bouncing off of each other. Presenting an auditory stimulus with sharp rise and fall times around the time of the disks’ spatial
coincidence results is a strong bias towards the “bounce” percept, whereas presentation of the same auditory stimulus presented with sufficient temporal disparity before or after the moment of coincidence results in the opposite bias towards the “stream” percept. The maximal effect of the accompanying sound occurs not with perfect synchrony, but when the sound precedes the spatial coincidence by 150 ms. In a similar effect, auditory stimuli accompanying a flashed visual stimulus have been found to generate additional perceived illusory flashes (Shams, Kamitani, and Shimojo, 2000). That is to say, a single visual flash presented with a brief double beep is
perceived as two separate visual flashes.
In localization tasks, responses to audio-visual targets have faster response latencies and improved accuracy compared to auditory-only or visual-only targets (Hughes et al., 1994). When
the auditory and visual stimuli are spatially separated, auditory targets presented with disparate visual distracters are perceived displaced in the direction of the visual distracter (Hairston et al.,
There is also a role of uncertainty in the integration of auditory and visual stimuli. For clearly defined auditory and visual stimuli, the high spatial acuity of vision tends to bias auditory localization towards a visual target (ventriloquism). Conversely, auditory targets do little to bias the localization of visual targets. However, it has been found that with less well-defined stimuli this is not always case. Auditory stimuli with a Gaussian temporal envelope that does not affect the localization of a small moving Gaussian blob with low spatial uncertainty, can bias the localization of a larger Gaussian blob with higher spatial uncertainty (Heron, Whitaker, and McGraw 2007).
Physiological substrates for audio-visual integration have been at the level of individual neurons, particularly in the superior colliculus (Meredith and Stein, 1983, 1986; Wallace, Wilkinson, and Stein 1996). Characteristic features of these multi-modal neurons include maximal excitation with lower stimulus intensity levels than those associated with unimodal stimuli and enhanced activation in response to synchronous, spatially coincident multimodal stimuli. The enhanced activity associated with synchronous stimuli was found to decrease monotonically to zero as the overlap decreased between peak discharge periods of activation evoked by each modality, and even result in depression of activity for sufficiently large temporal disparities (Meredith, Nemitz, and Stein 1987).
Thus, in the integration of auditory and visual stimuli, spatial and temporal alignments clearly play important roles in determining the degree and type of interaction between modalities. How exactly to model this interaction has proven confounding given the variety of known
perceptual and visual-motor effects.
Time-Window-of-Integration
occur within modality as well. In backwards masking, the perception of a stimulus can be modulated or even ablated when it is followed in close succession by a second stimulus (Bachmann, 1994). In the color phi phenomenon, two colored targets presented sequentially across small spatial and temporal disparities appear to change gradually from one color and position to the other (Kolers and von Grunau, 1976). The perception of the first stimuli during the time between the two presentations is influenced by the presentation of the second, though the latter has not yet occurred. This is the basic effect underlying apparent motion and video display.
In the flash-lag effect, a flashed visual target is perceived to lag behind a smoothly moving target (Nijhawan, 1994). This effect is demonstrated for conditions in which the flash occurs at the same time as the motion target’s onset, but does not occur when the flash is timed with the disappearance of the motion target, implying that it is the visual stimuli subsequent to the presentation of the flash that are responsible for this effect (Eagleman and Sejnowski, 2000).
The “cutaneous rabbit” effect even demonstrates this in the haptic domain (Geldard and Sherrick, 1972). In this effect, reminiscent of the phi phenomenon, a rapid succession of taps to the wrist followed by a rapid succession of taps to the elbow is experienced as a series of equidistant taps regularly spaced from one to the other. The spatial perception of wrist taps is influenced by subsequent elbow taps just as the spatial perception of elbow taps is influence by prior wrist taps. The latter is hardly surprising if we imagine that the series of wrist taps predict future wrist taps, and this prediction biases the subsequent experience of elbow taps. But for the subsequent elbow taps to bias the prior wrist taps, we must imagine that the series of elbow taps postdicts the wrist taps.
subsequent to the relevant perceptual stimuli, or that this sort of integration should only occur across sensory modalities and not within sensory domains.
Summary of Experimental Studies
The following chapters represent two published papers, three manuscripts in preparation, and work from one ongoing project. The first experimental study, on gaze-dependent aftereffects, demonstrates the ability of the visual system to maintain gaze-specific representations of visual space at the same retinotopic position (Nieman, et al., 2005). The second study, on cyclopean
flash-lag illusion, demonstrates a novel flash-lag presentation and represents an example of a known effect that is likely postdictive in nature (Nieman et al., 2006). The third study,
Chapter 2
Study 1: Gaze Direction Modulates Visual Aftereffects in Depth and Color (Previously published as Nieman et al. 2005)
Abstract
Prior physiological studies indicate that gaze direction modulates the gain of neural responses to visual stimuli. Here, we test gaze modulation in the perceptual domain using color and depth aftereffects. After confirming retinotopy of the effects, we employed a balanced alternating adaptation paradigm (adaptation alternates between opponent stimuli) to demonstrate that opposite color and depth aftereffects can codevelop at the same retinal location for different gaze directions. The results provide strong evidence for (a) gaze modulation of aftereffects, (b) generality of gaze modulation across two visual attributes, and (c) perceptual correlates of the modulation of neural activity by gaze direction.
Introduction
Due to frequent spontaneous saccades, the retinal image undergoes repeated and continual relocation. The problem of spatial constancy—how we derive and maintain a highly stable visual world despite this highly dynamic visual stream—has long been one of the central concerns of vision science. As the position and orientation of the retina changes due to
movements of the eye within its orbit, the head atop the shoulders, or the body with respect to its surroundings, the spatial mapping necessary to correctly and consistently interpret a visual scene is in constant flux. Information regarding the position of the eye must provide a context for the transformation of retinal coordinates into environmental locations.
different neuronal responses depending on an animal’s gaze direction (Andersen and
Mountcastle, 1983). A given neuron will still respond maximally when the stimulus is presented at its tuned retinal location, but the amplitude of activity at that location and presentations elsewhere in the visual field will systematically vary with gaze. These gaze-modulated receptive fields were first observed in parietal cortex (Andersen et at., 1985) and have been shown to be
associated with performance on visually guided motor tasks (Andersen and Mountcasle, 1983). “Gain field” neurons, synthesized from these kinds of gaze-modulated receptive fields, could be the basis for a head-centered representation of visual space and may indeed be the neural
substrate of such coordinate transformations (Zipser and Andersen, 1988; Pouget and Sejnowski, 1997). These findings have not been limited to visio-motor systems. Recent physiological studies have shown similar neural modulation in areas V1 (Trotter and Celebrini, 1999), V3 (Galletti and Battaglini, 1989), and MST (Squatrito and Maioli, 1997; Shenoy, Bradley, and Andersen., 1999).
Are these types of gaze-modulated neural responses in perceptual areas reflective of perception, and if so are they psychophysically detectable? To explore this possibility, we utilize visual aftereffects, which have the benefit of being both generally retinotopic, and sensitive to spatial-visual context across gaze shifts. To put this another way, aftereffects are convenient for this study because they tend to be focused at a specific retinal location (the adapted location) and are also somewhat robust to eye movements.
observations suggested that our depth-ordering version of stimuli tended to yield clearer percepts, thus providing a more consistent aftereffect. The stimuli used for these experiments were
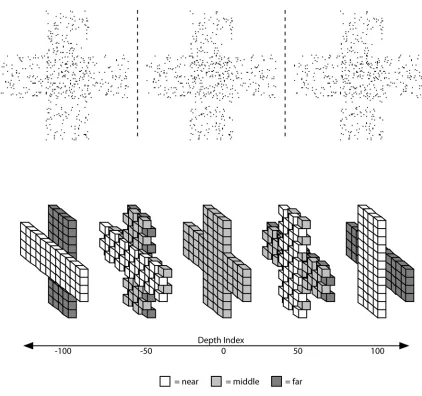
overlapping horizontal and vertical rectangles composed of random dots whose depths were defined by disparity without monocular cues (figure 2.1).
We also tested the color aftereffect (CAE), in which prolonged adaptation to a patch of one color causes a gray test stimulus to appear in the opponent color (adaptation to green produces a red aftereffect). It is known that the CAE is not subject to interocular transfer (Coltheart, 1973)—adaptation in one eye does not produce an aftereffect for a stimulus viewed only with the other. This suggests that the effect occurs somewhere prior to the integration of binocular information. The DOAE is based upon adaptation to depth planes defined by binocular disparity cues, necessitating information from both eyes. While both effects are likely to occur relatively early in the visual system (V1 or V2) the depth effect involves a greater degree of neural integration and probably occurs later.
Even before the physiological data suggested a mechanism for it, Mayhew reported a compelling example of a gaze-dependent motion aftereffect in humans (Mayhew, 1973). After alternate their gaze between a clockwise rotating disc on the left and a counterclockwise rotating disc on the right while maintaining a fixed head position, observers reported the direction of motion aftereffect (MAE) observed for a static disc presented in each gaze direction. Mayhew found that the direction of the aftereffect varied with gaze direction, each always opposite to that of its adapting stimulus. Two simultaneous, opposite aftereffects at the same retinal position could not be explained by a purely retinotopic mechanism and the physiology to suggest a mechanism for gaze integration was unknown at the time. A recent study, enlightened by physiological findings, has demonstrated gaze modulation of motion, tilt, and size aftereffects, although the size of the modulation was modest (approximately 15%; Nishida et al., 2003).
We revisit gaze alternation between opponent adapting stimuli as a means of examining the gaze modulation of aftereffects in depth and color. These effects likely occur in different neural pathways of visual processing (Livingstone and Hubel, 1984) and may reflect on the generality (or specificity) of gaze modulation in visual processing. While Mayhew’s original demonstration provided a compelling example of gaze modulation, the spatial extent and selectivity of the effect were never quantified. Here we reexamine and augment the original paradigm to measure the degree of modulation for each effect. After measuring the spatial tuning of these aftereffects, we conducted experiments in which observers adapted by repeatedly
alternating fixation at fixed time intervals between a location in one direction (right), which contained an adaptation stimuli, and a location in the other (left), which contained only a fixation point. Observers were then asked to make a saccade to a neutral location (center) before shifting their gaze to a test pattern presented at one of the two adapted locations, or the neutral location. We found significant gaze-dependent modulation of both color and depth aftereffects.
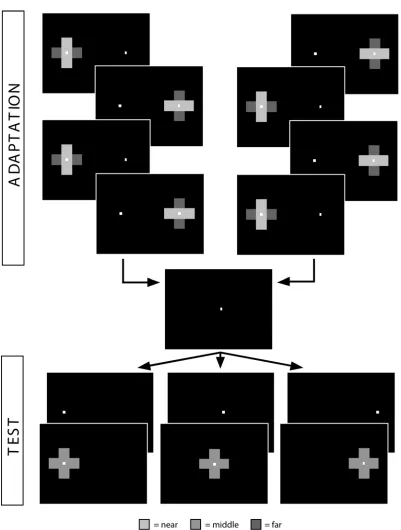
In other experiments, observers regularly switched their gaze location between opponent stimuli at the two locations (red on the right and green on the left, or horizontal-in-front on the right and vertical-in-front on the left), alternately adapting to opposite stimuli at the same retinal location (in the fovea). Again, after being asked to saccade to a neutral central location,
observers were presented with a test stimulus at one of the three locations (figure 2.2). We found evidence of gaze modulation of aftereffects, i.e. opposite directions of aftereffect in two gaze directions, in the case of both color and depth.
Experiments
Depth apparatus: All experiments were performed on Macintosh computers running
MATLAB (MathWorks Inc., Natick, MA) and the Psychophysics Toolbox extensions (Brainard, 1997). Stimuli were displayed on an LCD screen (60 Hz refresh; 32.3 cm × 21.6 cm) at a viewing distance of 57 cm (1 cm on screen = 1° of visual angle). Observers wore red-green stereo-glasses and room lights were turned off. The apparatus was the same in all depth experiments.
General notes on depth stimuli: The adaptation stimuli consisted of 840 random dots
arranged in two 5.0° X 1.67° overlapping bars (one horizontal, one vertical; see the top of figure 2.1 for an example). Each dot was displayed in both red and blue, and the horizontal disparity between each dot’s red and blue components was adjusted to convey depth. All dots appeared at one of three depths corresponding to horizontal crossed disparities of 6.6, 10.0, and 13.2 arcmin (far, middle, and near). For the adaptation stimuli the two bars were presented at different depth planes (100% of dots composing the horizontal bar appearing near, 100% of dots composing the vertical bar appearing far, and vice versa). Throughout the experiment, observers fixated a 0.29° circle presented at the far depth plane (6.6 arcmin red-blue horizontal disparity) that was always visible through the adaptation stimuli.
In order to quantify this effect, we defined a “depth index” for the test stimuli
corresponding to the percentage of dots in the stimulus that are not at the middle (10.0 arcmin) disparity. Positive depth index is assigned to stimuli in which the vertical bar appears nearer than the horizontal bar, negative depth index is assigned to stimuli in which the horizontal bar appears nearer than the vertical bar. For example, a stimulus with a depth index of +60 would have 60% of the dots that compose its vertical bar at the near-depth disparity (the other 40% at the middle-depth disparity) and 60% of the dots that compose its horizontal bar at the far-middle-depth disparity (the other 40% at the middle disparity). Conversely, a stimulus with a depth index of −60 would have 60% of the dots that compose its vertical bar at the far-depth disparity, 60% of the dots that
middle disparity. The vertical-near/horizontal-far adaptation stimulus has a depth index of +100 (100% of the vertical-bar dots near, 100% of the bar dots far) and the horizontal-near/vertical-far adaptation stimulus has a depth index of -100 (100% of the vertical-bar dots far, 100% of the horizontal-bar dots near). For a perfectly neutral test stimulus, 100% of the dots representing both the vertical and horizontal bars were presented at the middle disparity. This stimulus receives a depth index of zero (figure 2.1).
Color apparatus: All experiments were performed on Macintosh computers running
MATLAB (MathWorks Inc., Natick, MA) and the Psychophysics Toolbox extensions (Brainard, 1997). Stimuli were displayed on a CRT Monitor (LaCie electron21, 60 Hz refresh; screen dimensions: 38.4 cms X 29.0 cms) at a viewing distance of 55 cm. The apparatus was the same in all color experiments.
General notes on color stimuli: The adaptation stimuli consisted of 3.47° x 3.47° squares
of red (RGB(255, 0, 0), CIE xyY(0.6357, 0.3411, 11.19)) and blue green(RGB(0, 255, 255), CIE xyY(0.2145, 0.3015, 37.20)). To avoid issues with edge overlap, test stimuli consisted of smaller 2.08° x 2.08° color squares. Throughout the experiment, observers fixated a 0.28°X 0.28° square of white.
Analysis: All experiments used the interleaved fixed-step-size staircase method. Eye
movements were not monitored. Observers responded after each trial by pressing one of two adjacent keys. Each key specified a fixed judgment (horizontal/vertical near or red/blue green) and the stimulus was then adjusted accordingly to achieve cancellation of the effect in subsequent trials. For each experimental condition observers ran two staircases, one beginning at each
adaptation stimulus. Staircases terminated after observers had reversed their responses five times. The point of subjective equality for each condition was determined by the average of six points (the last three reversal points from each staircase). PSEs were compared using two-tailed, non-paired t-tests. A typical experiment lasted between 15 and 20 minutes. Reaction times were not measured.
Experiment 1
Our first task was to quantify the effects and to demonstrate their spatial tuning on the retina without a gaze-shift. Observers maintained central fixation throughout the experiment as they were presented with an adaptation stimulus in the fovea and test patterns at five retinal locations.
Participants: Two authors and five naive observers with normal or corrected to normal
vision were used in all experiments.
Depth stimuli: Observers began each experimental session by adapting to the
vertical-in-front stimulus at the center of the screen for 20s. At the beginning of each trial, that stimuli would reappear for 3s, then disappear and 0.5s later, a test stimulus would appear at one of five locations (8.4° left, 4.2° left, 0°, 4.2° right, 8.4° right). The test stimuli would be visible on the screen for 0.7s.
Depth task: Observers were asked to judge, in a 2 AFC task, whether the horizontal bar
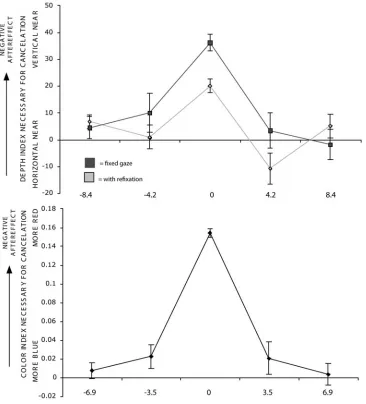
Depth results: All observers exhibited strong retinal tuning for the depth ordering
aftereffect, with tightly peaked tuning curves centered at the fovea (figure 2.3 top). As a rough probe for gaze modulation, in another experiment we had observers adapt to a stimulus in the fovea, and then saccade to a new location before presentation of the test pattern in one of five locations around the new fixation point. This showed strong retinal tuning as well, and the size of the measured effect at the fovea after refixation was diminished (figure 2.3 top, gray line).
Color stimuli: Observers began each experimental session by adapting to the red
stimulus at the center of the screen for a prolonged 20s. At the beginning of each trial, that stimuli would reappear for 5s, then disappear and 0.5s later, a test stimuli would appear at one of five locations (6.9° left, 3.5° left, 0°, 3.5° right, 6.9° right). The test stimuli would be visible on the screen for 0.7s.
Color task: Observers were asked to judge, in a 2 AFC task, whether the test stimulus
appeared reddish or blue greenish. They were instructed to hold their gaze on the central fixation square throughout the experiment.
Color results: All observers exhibited strong retinal tuning for the color aftereffect, with
tightly peaked tuning curves centered at the fovea (figure 2.3 bottom).
Experiment 2
To quantify gaze modulation of the DOAE, observers alternated gaze direction during adaptation between a single stimulus (horizontal field-in-front) at one position (right) and a fixation point at the other (left). The strength of the aftereffect (vertical field-in-front) was then tested at the two familiar locations and a neutral location (center).
Depth stimuli: Observers began each experimental session with an adaptive period of
a time. At the beginning of each trial, observers underwent a shorter period of gaze alternating adaptation (1.5s right, 1.5s left, 6 alternations), after which the fixation circle appeared at the center of the screen for 0.5s (prompting a saccade). The fixation circle then moved to one of three locations (9.7° right, 0°, 9.7° left) for 0.5s before the test stimulus appeared at that location. The test stimulus was visible on the screen for 1s.
Depth task: Observers were asked to judge, in a 2 AFC task, whether the horizontal bar
of the test stimulus appeared in front of or behind the vertical bar. They were instructed to follow the fixation circle and keep it fixated throughout the experiment.
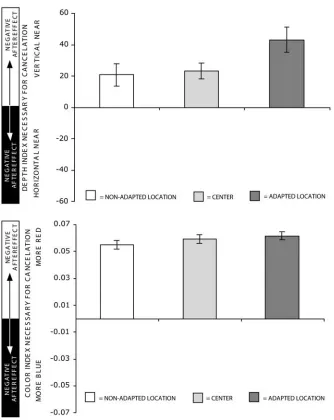
Depth results: All observers showed significant attenuation of the effect at the
non-adapted location (on the left; the average effect at this location was only 45% as large as in the adapted gaze direction; p < 0.05). The attenuation of the effect at the neutral location (in the center; nearer to the adapted location) was less than in the nonadapted direction, but still significant relative to the effect at the adapted location (the average effect at this location was 53% as large as in the adapted direction; p < 0.001), and not significantly different from the aftereffect at the non-adapted gaze location (figure 2.4 top).
Color stimuli: Observers began each experimental session with an adaptive period of
Color task: Observers were asked to judge, in a 2 AFC task, whether the test stimulus
appeared reddish or blue greenish. They were instructed to follow the fixation circle and keep it fixated throughout the experiment.
Color results: As with the DOAE, observers showed a significant, but in this case much
smaller, degree of attenuation of the effect at the non-adapted location (on the left; average effect was 90% as large as in the adapted gaze direction; p < 0.05). This degree of gaze modulation is not unlike that observed for other simple visual aftereffects previously (Nishida et al, 2003). The
neutral location showed less attenuation, and the measured effect there was not significantly different from either adapted location (figure 2.4 bottom).
Experiment 3
Is gaze modulation strong enough to induce opposite aftereffects in different gaze directions? A positive result would be the strongest conceivable evidence for gaze-dependent modulation. In our third experiment, observers alternated gaze between two locations with opponent adapting stimuli (horizontal field in front on the right, vertical field in front on the left) before responding to a test stimulus at one of three locations (left, right or center).
Depth stimuli: Stimuli were the same as in experiment 2, except that during the adaptive
periods of gaze alternation, the vertical in front stimulus (with fixation circle) appeared on the left instead of the fixation circle alone. Thus observers alternated their gaze between the horizontal in front stimulus (with fixation circle) 9.7° to the right of center, and the vertical in front stimulus (with fixation circle) 9.7° to the left of center (3s left, 3s right, 10 alternations). At the beginning of each trial, observers underwent a shorter period of gaze alternations as in Experiment 2 (shown schematically in figure 2.2).
Depth task: As before, observers were asked to judge, in a 2 AFC task, whether the
Depth results: On average, observers showed opposite and significantly different DOAE
at the two adapted locations (+22.7% ± 8.8 (V-in-front) on the right vs. -22.3% ± 9.22 (H-in-front) on the left; p < 0.001; figure 2.5 top). Thus adaptation to opponent stimuli at the same retinal position but in different gaze directions produced simultaneous, opposing aftereffects in the same retinal location.
Color stimuli: Stimuli were the same as in experiment 2, except that during the adaptive
periods of gaze alternation, the blue green adaptation stimulus (with fixation square) appeared on the left instead of the fixation square alone. Thus observers alternated their gaze between the red stimulus (with fixation square) 13.8° to the right of center, and the blue green stimulus (with fixation square) 13.8° to the left of center (4s left, 4s right, 15 alternations). At the beginning of each trial, observers underwent a shorter period of gaze alternations as in Experiment 2.
Color task: As before, observers were asked to judge, in a 2 AFC task, whether the test
stimulus appeared reddish or blue greenish. They were instructed to follow the fixation circle and keep it fixated throughout the experiment.
Color results: After alternating adaptation between opponent color stimuli, observers
Discussion
Gaze alternation between opponent adaptation stimuli marks a significant departure from traditional aftereffect experimental paradigms, and may provide decisive evidence for gaze modulation as well as a more sensitive measure of spatial tuning. By adapting the same
retinotopic location alternately to opposite stimuli, strictly retinotopic adaptation should average out, leaving primarily adaptation to effects that exist in non-retinal coordinate systems (such as head-centered or environmental systems). While it is impossible to insure that the competition between opposite stimuli indeed results in complete cancellation, at the simplest levels of visual processing the net adaptation should be very small, and even with net retinal adaptation,
observing simultaneous opposite aftereffects would be impossible without gaze modulation. Rather than measuring the combination of retinotopic and gaze-dependent adaptation under conditions of varied gaze, this paradigm seeks to measure the gaze-dependent component directly.
In all of these experiments, the strength of the aftereffect was measured to be greatest at the adapted gaze location and diminished at other gaze locations. In the single-sided alternation paradigm, it is unlikely that retinal mismatch of adaptation and test stimuli induced by gaze shift could have accounted for any of the modulation observed, since all trials involved multiple saccades prior to testing and should have been equally susceptible to mismatch effects. By alternating gaze directions (but only one stimulus) throughout adaptation, observers in our experiments adapted to both gaze locations prior to each test. Since stimuli were always
presented at the same retinal location, it would be difficult to attribute these findings to anything other than gaze modulation. It seems likely that humans share the gaze modulation observed in V1, V4, and MST of monkeys, and that perception reflects this neural modulation.
(Regan and Beverley, 1972; Anstis and Harris, 1974). All of this suggests that the presence of these aftereffects depends on more than simply the retinal location of visual stimuli and exists within some more complicated framework. While we can postulate how the contingent
relationships between various features tie into issues of feature binding, gaze dependence serves a more obvious purpose. It may provide a critical basis for the transformation from retinal to body-centered, and eventually environmental coordinates.
Physiological studies have demonstrated the existence of visually responsive neurons that adjust their gain in a gaze-dependent manner. Neurons of this type could provide a mechanism for the gaze modulation of visual aftereffects. Consider a population of color-tuned neurons (some responding to red, some responding to green) with receptive fields centered in the fovea and gain fields (the locations at which the gain of its tuning curve is the greatest) centered at the left adaptation location. The balance of output from this population of cells will represent color balance on the red-green axis. A red adapting stimulus presented at the left location will cause a large increase in firing of red-tuned cells, whereas a green stimuli presented at the right
adaptation location will evoke only a small increase in firing rate in the green-tuned cells (lower gain). The red-tuned cells will adapt out their responses to a greater degree than the green-tuned cells and, after adaptation, a neutral stimuli (equal parts red and green) presented at the left adaptation location will evoke a lesser response from the adapted red cells than the less adapted green cells. The neutral stimulus will appear green. Conversely, a similar population of cells with their gain fields centered at the right adaptation location, presented with the same adaptation stimuli (red-left, green-right), will represent a neutral stimulus on the right as being more red.
adaptation. The results of these experiments would then suggest that very early on there occurs some integration of gaze information which modulates, albeit modestly, the response properties of color selective neurons. This is in line with recent findings of modest gaze modulation
(approximately15%) of a variety of aftereffect (motion, tilt, size) that also likely occur as early as V1 or V2 (Nishida et al, 2003).
The depth ordering aftereffect probably involves a higher degree of visual processing, but could also occur as early as V1. In physiological studies in monkeys, stereoptic, depth-tuned neurons were found in V1, V2 , V3, MT and MST (Poggio, 1994). The much greater degree of gaze-dependent modulation seen here with depth is not entirely surprising considering the degree of correlation and integration of position information at higher cortical levels that is involved in stereopsis.
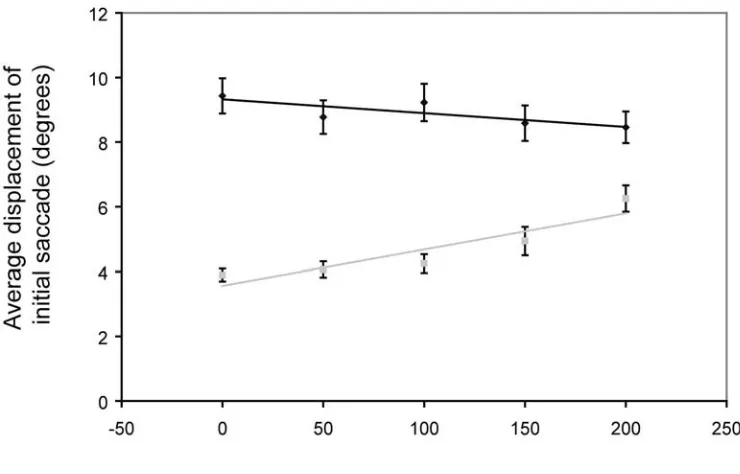
Figure 2.3: Retinal Tuning of the Color and Depth Ordering Aftereffects. (Top) Observers adapted to a horizontal-in-front stimulus in the fovea after which they maintained fixation (black) or shifted to a new fixation point 12.6° to the right or left (gray), and a test stimulus was
presented at one of five retinal locations. (Bottom) Observers adapted to a red stimulus in the fovea after which a test stimulus was presented at one of five retinal locations. For both effects, the magnitude was greatest at the adapted retinal location and dropped off quickly to the left and right. Error bars represent standard error of the mean for the six reversal points used in
Figure 2.4: Gaze modulation of aftereffects. (Top) Observers adapted to a vertical-in-front stimulus in the fovea on the right side of the screen. (Bottom) Observers adapted to a red
Chapter 3
Study 2: Cyclopean Flash-Lag Illusion (Previously published as Nieman et al. 2006)
Abstract
Possible physiological mechanisms to explain the flash-lag effect, in which subjects perceive a flashed item that is colocalized with a moving item as trailing behind the moving item, have been found within the retina of lower species, and in the motor pathways of humans. Here, we
demonstrate flash-lag employing “second-order” moving and flashed stimuli, defined solely by their binocular disparity, to circumvent any possible “early” contributions to the effect. A significant flash-lag effect was measured with cyclopean stimuli composed entirely of correlated random dot patterns. When the disparity-defined moving stimulus was replaced with a
luminance-defined one, potentially engaging retinal mechanisms, the magnitude of the measured effect showed no significant change. Thus, in primates, though retinal mechanisms may
contribute, flash-lag must be explained through cortical processes.
Introduction
Neurophysiological findings on the retina in lower species have provided a possible mechanism to explain flash-lag. Investigating the frog retina, Barlow (1953) noted that the greatest “off” response of ganglion cells to a moving fly’s retinal image occurs closer to the fly’s future position. More recently, Berry, et al. (1999) reported similar anticipatory responses to
ganglion cells such as spatial-pooling, biphasic responses and contrast gain control (Berry et al.
1999). Whether similar mechanisms operate throughout the visual system, and produce perceptual phenomena like the flash-lag effect in humans, remains an open question.
Given that the flash-lag effect has been demonstrated under diverse stimuli conditions and manipulations (for example, it has been demonstrated in experiments employing non-moving, changing stimuli; coined "generalized flash lag"), retinal mechanisms driven by motion alone would appear to be inadequate (Sheth, Nijhawan, and Shimojo, 2000). Furthermore the flash-lag effect was recently demonstrated in an experiment in which subjects moved their hand in the dark and judged the position of a flash relative to the felt position of their moving hand (Nijhawan and Kirschfeld, 2003). Subjects perceived the position of the flash, presented in spatial alignment with their moving hand, as lagging relative to the felt position of their invisible hand. This “motor flash-lag” suggests that non-visual mechanisms of the central nervous system that monitor limb positions can and do contribute to the flash-lag effect. Given that flash-lag is observed both at the “early” retinal level and the motor level, and the presence of generalized flash lag across visual attributes, one may ask if mechanisms contributing to this effect are also present at the
intermediate levels, between the retina and motor cortical areas.
the moving stimulus as luminance-defined we were able to gauge the additional contribution, if any, of retinal mechanisms to the flash-lag effect.
Experiments
A motion sensor activated only by luminance differences (Reichardt, 1957) would not detect any net motion for second-order stimuli whose average luminance is the same as the background. Thus, if mechanisms based in the retina are responsible for flash-lag, then purely cyclopean stimuli would not elicit the effect. In these experiments we demonstrate the existence of flash-lag for stimuli that can be detected only via correlation of images from both eyes, and compare the magnitude of the effect to conditions in which either the moving target, the flashed target, or both targets are luminance defined.
Condition 1
Participants: Two authors and two naive observers with normal or corrected to normal
vision were used. The same observers were used in all experiments.
Apparatus: All experiments were performed on a Macintosh computer running MATLAB
(MathWorks Inc., Natick, MA) and the Psychophysics Toolbox extensions (Brainard, 1997). Stimuli were displayed on a Nokia 445xi CRT screen (60 Hz refresh; 40 cm × 30 cm) which observers viewed through a mirror haploscope. The haploscope was positioned such that the observer’s right eye viewed only the right half of the screen while the left eye viewed only the left half of the screen, and then adjusted so that the two images comfortably fused (figure 3.1). The total viewing distance was 57cm (1 cm on screen = 1° of visual angle).
Stimuli: The displays for the left and right halves of the screen were constructed of
correlated dynamic noise consisting of equal numbers of 0.13° × 0.13° black (0.00 cd/m2) and
cross, 0.25° wide with a 0.25° black border was visible at the center of the right and left displays
throughout the experiment. The fixation cross was displayed with a crossed disparity of 0.13°
(the cross was shifted to the right by 0.063° in the left eye display and to the left by 0.063° in the
right eye display; for an observer with inter-ocular distance of 3.5 cm, this crossed disparity corresponds to an object placed 1 cm in front of the display). In each trial, a smoothly moving target (6.68° × 2.67°) would travel horizontally across the display, 4.0° below the fixation cross,
at one of two speeds (4.65° or 9.30° sec-1). These moving stimuli were defined solely by
binocular disparity (Julesz, 1971; Smith and Scott-Samuel, 1998). While the moving target was at one of seven positions near the center of the display, a flashed target of the same size (6.68° ×
2.67°) appeared centered 4.0° above the fixation cross. Both flashed and smoothly moving
stimuli were composed of correlated dynamic noise presented at a crossed disparity of 0.13° with
respect to the background (at the same apparent depth as the fixation cross, about 1cm in front of the display). All frames of animation lasted for 71.8 milliseconds (2 frames of noise), thus the position of the smoothly moving target updated every 71.8 ms, and the flashed target was present for 71.8 ms. Despite this relatively slow animation rate, observers reported that the motion of the translating stimulus appeared smooth under these conditions. In order to ensure that the
stereoscopic stimuli were undetectable monocularly, prior to the start of experimental blocks, observers were asked to view the a few trials of the experimental display with either the left or the right eye alone. Observers reported seeing only the fixation cross.
Task: Observers were asked to judge, in a two-alternative forced-choice task, whether the
flashed target appeared to the left or right of the continuously moving target. Each observer was presented both directions of motion in two blocks for a total of 420 trials. The velocity and the position of the flashed bar were randomly selected without replacement for each trial.
Analysis: The observers’ responses under each speed-direction combination were fitted
which the flash preceded the moving bar’s central alignment. A 3-way ANOVA (observer, speed, direction) was performed to determine the relevance of speed and direction in the magnitude of the effect. Both were found to be uncorrelated with the magnitude of the effect in the time domain. Based on this, observer responses across both speeds and both directions were pooled within observer and fitted again with a probit function to determine each observer’s average measured effect.
Results: These conditions produced a strong flash-lag effect in all subjects at both
velocities and in both directions. The moving bar was perceived as aligned with the flashed bar when the flash was presented on average 163.4 ± 7.5 ms before the two bars were actually aligned (figure 3.2a). Thus, ‘cyclopean’ stimuli that cannot be detected monocularly produce a reliable flash-lag effect implicating cortical mechanisms located beyond the computation of binocular disparity. A high-level ‘feature-tracking’ mechanism may be responsible for detection of motion in disparity-defined stimuli (Lu and Sperling, 1995a, 1995b; Cavanagh, 1992). These results show that mechanisms that are qualitatively different from those invoked previously, may contribute significantly to the flash-lag effect in humans (Berry et al., 1999).
Condition 2
For comparison with more traditional flash-lag experiments, observers were presented with homogeneous gray (8.2 cd/m2) moving and flashed targets. All other conditions of the experiment were the same as in the first condition (a background of correlated dynamic noise, viewing through the haploscope). The same four observers participated.
Results: A strong, consistent flash-lag was observed. The moving bar was perceived as
Condition 3
In order to ascertain any additional contribution of retinally based mechanisms of motion extrapolation, observers were presented with a homogeneous gray (8.2 cd/m2), and hence
monocularly detectable, moving target, but a cyclopean (disparity defined) flashed target. All other conditions of the experiment were the same as in the first condition. The same four observers participated.
Results: Again, observers exhibited a strong flash-lag effect. The moving bar was
perceived as aligned with the flashed bar when the flash was presented on average 165.8 ± 19.1 ms before the two bars were actually aligned (figure 3.2c). This represents an insignificant change from the fully cyclopean condition (p = 0.693; df = 3 in within-subject paired t-test). Thus it seems, under these circumstances, the contribution of retinally based mechanisms of motion extrapolation is modest at best.
Condition 4
Some theories of flash-lag center around the differential latency associated with perception of the transient event with respect to perception of the continuously moving, and hence predictable, target. In order to facilitate the detection of the flash observers were presented with a homogenous gray (8.2 cd/m2), and hence monocularly detectable, flashed target, but a cyclopean moving target. All other conditions of the experiment were the same as in the first condition. The same four observers participated.
Results: In this case, the size of the effect was diminished, though still robust. The
Discussion
Our results are consistent with previous investigations (Fu, Shen, and Dan, 2001) employing stimuli lacking luminance boundaries, suggesting that the human visual cortex is largely responsible for the flash-lag effect. Furthermore, our results suggest that processes peripheral to layer 4 of the primary visual cortex (V1)—the first possible locus in the nervous system where information from the two eyes could potentially converge on the same neurons— make only a modest contribution to visual flash-lag. Berry et al. (1999) invoked spatial pooling
in the retinal ganglion cells, the fact that a neuron fires to stimuli presented anywhere over a large portion of the visual field, as one of the factors contributing to the flash-lag effect. By virtue of spatial pooling, a retinal ganglion cell begins firing as soon as a moving stimulus impinges on the periphery of a cell’s receptive field, thus effectively shifting the stimulus towards the center of the cell’s receptive field. In primates the typically measured size of the receptive fields of typical V1 cortical cells representing the fovea, where a large flash-lag effect has been measured, are too small for spatial pooling to completely account for flash-lag. While it has been shown that stimulus conditions can significantly affect the measured size of receptive fields in primates (Kapadia, Westheimer, and Gilbert, 1999)—specifically, both low-contrast stimuli and textured backgrounds tend to increase the observed size of receptive fields—there are other indications that mechanisms qualitatively different from spatial pooling may need to be invoked.
3). Whatever mechanisms are responsible for FLE under these conditions, engaging luminance detectors for the moving target does not change the observed phenomenon.
Differential latency accounts of flash-lag suggest that there is some facilitation of perception for the changing target which allows it to occur faster than perception of the flashed target (Purushothaman et al., 1998; Whitney and Murakami, 1998). The observed lag is a
measure of the time difference between the two percepts. By this account, we would expect that changing the flashed target to be more easily detectable should result in a smaller FLE (less of a difference in the time to process its perception). Purushothaman et al. (1998) demonstrated this
for luminance detectability differences near threshold and our results are consistent with their findings—changing a disparity-defined flash for a luminance-defined one resulted in a significantly smaller effect (condition 4).
Our results, however, point to more fundamental differences between ‘early’ and ‘late’ mechanisms. It is known that signals originating in higher cortical areas can strongly influence cell activity in a given location of layer 4 of V1 through descending signals, as shown in tests in which afferent input to the given layer 4 location was removed (Mignard and Malpeli, 1991). Researchers have identified two types of motion processes in humans; one based on low-level motion detectors and the other based on signals arising in higher cortical areas (Braddick, 1980). There is a debate concerning which processes underlie motion perception in disparity-defined stimuli, and as to whether stereo-motion is based on specialized motion detectors or on high-level ‘feature-tracking’ (Patterson, 1999). Despite this debate, researchers agree that signals
While our results do not directly address the role of attention in flash-lag, it should be mentioned that the task in our experiments with disparity-defined stimuli is extremely
demanding. Consistently perceiving the position of the moving stimulus amid dynamic random noise requires that attention remains focused upon it. Any attention-generated internal signal that contributes to the perception of motion is likely very strong under these conditions. Also, with attentional resources so committed to the moving target, any delay associated with bringing the flashed target into awareness would likely be increased. If such an attentional delay is ultimately responsible for FLE (Baldo and Klein, 1995), this may explain the unusually large magnitude of the effect we observed, though this is certainly not direct evidence for such a theory.
Figure 3.2: The Psychometric Data plots (n = 4) for: (a) completely cyclopean moving and flashed targets, (b) monocularly visible gray moving and flashed targets, (c) monocularly visible gray moving target and cyclopean flashed target, and (d) cyclopean moving target and
Chapter 4
Study 3: The Turn-Point Phantom
Abstract
Abrupt changes in a moving object’s direction create inconsistencies between the perception of motion and position that may result in positional errors. Previous reports of mislocalization associated with moving objects (Freyd and Finke, 1984; Nijhawan, 1994; Thornton, 2002;
Fröhlich, 1923) have generally focused on a single trajectory or direction reversal. The turn-point phantom effect (TPE) is a new form of mislocalization in which the position of an abrupt
orthogonal direction change is mislocalized to a point outside of the object’s trajectory. Though the direction of the effect is consistent with the idea independent pre- and post-turn percepts, ablating the pre-turn trajectory quells the effect. Attempts to change the temporal perception of the turn with an additional transient event to “capture” the moment of the turn suggest that the perceived timing of the direction change is central to the effect. TPE represents a new form of motion mislocalization that may provide evidence for postdictive visual awareness, and the predominance of the motion over positional information.
Introduction
occupied by objects (Kanai, Sheth, and Shimojo, 2004). However, in cases where demands are made on the awareness of both motion and position, interactions may occur between the two. There exists an assortment of consistent, known errors in position perception under the effect of motion: representational momentum (Freyd and Finke, 1984), flash-lag (Nijhawan, 1994), onset repulsion (Thornton, 2002; Actis-Grosso and Stucchi, 2003), and Fröhlich (Fröhlich, 1923; Müsseler and Aschersleben, 1998). These studies have shown mislocalizations associated with the origination (onset repulsion and Fröhlich) and termination (representational momentum) of moving targets, as well as with localization in time and space with respect to other transient events (flash-lag).
We offer a new type of motion localization error associated with an change in direction— the turn-point phantom effect (TPE)—wherein a moving target that abruptly changes direction is mislocalized backwards along its subsequent motion trajectory. This new effect cannot trivially be explained by existing effects or their proposed mechanisms, though attempts to do so raise questions about the nature of motion continuity in object processing and the online nature of motion and position processing.
The overall motion trajectory of the target in this effect can be thought of in two distinct ways: 1) as a continuous, elbow-shaped path that experiences a transient change of feature
(direction), and 2) as the juxtaposition of two distinct, orthogonal trajectories, the first terminating where the second originates. If the target is represented in the first way, we might imagine something similar to the flash-lag effect (FLE), with the temporal perception of the turn lagging behind the position of the target (Whitney and Murakami, 1998), and the turn-point perceived forward, localized somewhere along the post-turn trajectory.
happen to coincide in the termination of the first and the origination of the second at the position of the turn. This is equivalent to thinking of the target in the second manner delineated above. In this case, with two distinct object representations, it is unclear which object assumes ownership of the turn-point. If the turn-point is represented as the termination of the first trajectory, we expect a contribution of representational momentum (repmo), whereby the representation of the target’s position is carried forward along its path, past the actual turn-point (figure 4.1). In our case, for a target that moves down and right and then turns 90 degrees and heads up and to the right,
representational momentum would push the perception of the end of the first part of the trajectory down and to the right.
If the turn-point is represented as the origination of the second trajectory, we might expect contributions from either of two onset effects that predict opposite directions: the Fröhlich effect and the onset repulsion effect (ORE). The Fröhlich effect involves the mislocalization of a fast moving target’s origin forward in the direction of motion and could push the perceived position of the turn-point up and to the right (the same direction predicted for flash-lag); ORE involves the mislocalization of a moving target’s origin backwards along its path of motion and could push our perceived turn-point down and to the left. Thus each effect that considers the two trajectories separately (ORE, repmo, and Fröhlich) predicts a different direction of bias in the perception of the turn-point.
The abrupt change in direction creates a problem of consistency between the perceptions of motion and position. There is a consistent bias in the perceived position of the turn-point, but in contrast to this, the motion trajectory does not appear distorted in any way. Thus, any shift in the perceived location of a moving target that is discontinuous between the pre- and post-turn paths would result in an inconsistency, not merely an inaccuracy, in the perception of the position or motion of the target.
functional visual experience. Position is perhaps the most important fundamental aspect of vision and motion “pervades the visual world, a circumstance that has not failed to influence the
processes of evolution” (Marr, 1982).
With the turn-point mislocalization effect we seek to establish the essential inconsistency between our internal representations of motion and position that arises with the abrupt transition between two orthogonal trajectories, and explore how it may be resolved. Experiment 1
demonstrates the basic effect with either one or two targets. Experiment 2 tests the similarities to ORE under these conditions. Experiment 3 introduces another transient event (visual flash or auditory beep) to examine similarities to FLE.
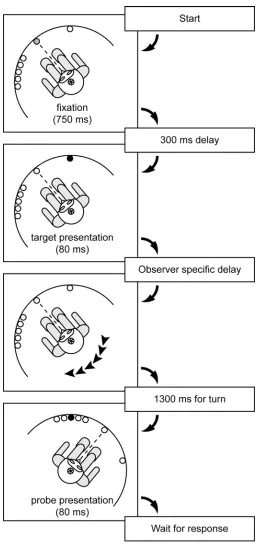
Experiments Experiment 1a
Single target. Observers watched a small, circular, diagonally moving target on a
computer screen make an abrupt 90 degree turn. On each trial the target appeared in the upper left quadrant and moved down and to the right towards the center of the screen until it reached the midline when it would abruptly change direction and move up and to the right, towards the upper right corner of the screen. Observers were asked to fixate on a small dot in the center of the screen (below the turn-point of the target) and judge the position of the turn in either the horizontal direction with respect to the fixation point, or in the vertical direction with respect to nearby hash marks.
Participants. Six naive, unpaid observers with normal or corrected to normal vision were
used.
Apparatus. All experiments were performed on a Windows computer connected to 19”
was dimly lit (0.10 cd/m2) and the monitor frame and experimental surroundings were visible. The apparatus was the same in all experiments.
Stimuli. On each trial, a circular target 0.87° in diameter appeared to the upper left of
fixation and moved diagonally down and to the right at a 45° angle and a speed of 12.3 deg/sec for 1090 ms and then changed direction and moved up and to the right at a 45° angle and the same speed for another 1090 ms (figure 4.2a). A central fixation point 0.10 x 0.10° was constantly visible. In trial blocks where the horizontal position of the turn-point was tested, the target appeared at one of seven horizontally spaced locations such that the turn-point occurred 3.4° above the fixation point either directly aligned or 0.3, 0.6, or 0.9° to the right or left. In trial blocks in which the vertical position of the turning point was tested, small horizontal hash marks 0.10 x 3.9° were visible 3.4° above and 4.8° to the right and left of the fixation point. In these trials, the target appeared at one of seven vertically spaced locations such that the turn-point occurred horizontally centered above the fixation point and either directly aligned with or 0.3, 0.6, or 0.9° above or below the hash marks. The fixation point and all targets were presented in white (83.5 cd/m2) against a black background (0.215 cd/m2).
Task. Observers were familiarized with the stimulus display and response keys and then
asked to judge, in a 2 AFC task, whether the turn-point of the target appeared to the left or right of fixation in horizontal test blocks, and above or below the visible hash marks in vertical test blocks. They were instructed to hold their gaze on the central fixation point throughout the experiment. Position of the target was randomized across trials in blocks of 140 (20 trials each position).
Analysis. Horizontal and vertical displacements of the perceived turn-point were probed
by minimizing the square error. Free parameters a and b were estimated by a least-squares
criterion and the point of subjective equality (PSE) was obtained as (−a/b). Thus each PSE
represented the displacement necessary for the perceived turn-point to be horizontally aligned with the fixation point or vertically aligned with the hash marks. Positive values correspond to rightward and upward displacements (i.e. forward along the post-turn trajectory). The PSEs of individual subjects were then averaged and analyzed using a 2-tailed, unpaired t-test to determine significance.
Results. In the horizontal direction, the average perceived turn-point of the target was
17.3 ± 4.8 arcmin to the left of (behind) the actual turn-point (t(5) = 3.63; p = 1.5 x 10⁻²). In the vertical direction the average perceived turn-point of the target was comparable: 13.6 ± 4.3 arcmin below that actual turn-point (t(5) = 3.20;p = 2.4 x 10⁻²). While the size of the effect is not dramatic, it is significant, and the effect was remarkably consistent across observers (fig 4.2b,e).
Discussion. The direction of the effect observed in this case is inconsistent with FLE. If
we consider the abrupt change in direction akin to a visual flash, as in the flash lag effect, we would expect the horizontal position of the target to be perceived forward along its trajectory at the moment of the turn, or rightward. This is not the case. In this dimension, the turn-point is being localized back to the left. In the vertical direction the turn-point appears shifted downward, into a region that the target never actually traverses.
If we were to consider the target as having two separate trajectories, an initial down-right trajectory which terminates abruptly at some position, followed by a subsequent up-right
turn-point itself is represented as the origin of the second part of the trajectory, and that under these conditions the onset of the second trajectory is subject to ORE.
Experiment 1b
Two targets. In this case, observers were presented with two targets, one above the
fixation point, exactly as in experiment 1a, the other similar but rotated 180° about the fixation point (thus below, fixation, moving from down right towards fixation and then turning abruptly towards down-left). Subjects were instructed to attend both targets, and compare the positions of the two turn-points.
Participants. The same six observers from experiment 1a were used.
Stimuli. The display was the same as in the previous experiment, with the addition of a
second target, also 0.87° in diameter (appearing to the lower right of fixation moving diagonally up and to the left at a 45° angle and a speed of 12.3 deg/sec for 1090 ms and then changed direction and moved down and to the left at a 45° angle and the same speed for another 1090 ms. At all times, the position of the second target was a point reflection of the first about the fixation point. As a result, both targets changed directions synchronously.
Task. Observers were asked to judge whether the turn-point of the top target appeared to
the left or right of the bottom target in horizontal test blocks. Otherwise the task was the same as in experiment 1a.
Results. In the horizontal direction, the average perceived turn-point of the top target was
Discussion. The effect here is the same for one or two targets. Attending to a second
target below the fixation point and attempting to localize both turn-points for comparison purposes does little to modulate the effect. This may suggest that the role of attention in this effect is limited.
Experiment 2
ORE vs. TPE. The direction of the turn-point phantom effect is consistent with the idea
that a second object representation is initiated at the turn-point and that the new object representation is subject to onset repulsion. To explore whether or not this explanation is
sufficient to explain TPE, we used the same parameters from experiment 1a, ablating the pre-turn portion of the target’s path. In each trial, the target would appear near the midline and move through only the second part of the trajectory.
Participants. Six naive, unpaid observers with normal or corrected to normal vision were
used.
Stimuli. On each trial, a circular target 0.87° in diameter appeared 3.4° above the fixation
point either directly aligned or 0.3, 0.6, or 0.9° to the right or left and moved diagonally up and to the right at a 45° angle at one of five speeds (4.1, 8.2, 12.3, 16.4, and 20.5 deg/sec). A central fixation point 0.10 x 0.10° was constantly visible. In all trial blocks, the horizontal position of the turn-point was tested. The fixation point and all targets were presented in white (83.5 cd/m2) against a black background (0.215 cd/m2). In a separate experimental block, the TPE trajectory from experiment 1a was tested at these five velocities for comparison.
Task. Observers were asked to judge the position of the appearance point of the target
with respect to the fixation point.
Results. At the tested velocities, under these conditions, observers failed to consistently
Discussion. While the direction of TPE is consistent with an ORE explanation, the
conditions of the experiment do not generate ORE. Another explanation is necessary.
Experiment 3a
Visual Flash. The motivation for this experiment is borrowed from the study of flash-lag.
The differential latency theory of flash-lag suggests that neural processing time associated with detection of a flash is longer than that associated with the monitoring of continued motion. Because of this, the position of the flash is compared with a later position of the moving object and the flash appears to lag, or so the theory goes. As we showed before, constructing a similar explanation for TPE—the turn-point is detected late and then compared to a position further along the trajectory—predicts an effect forward along the post-turn path. This is not what we observe. However, if issues related to the timing of transient stimulus detection are common to both effects, then perhaps we can modulate the effect by capturing the perceived time of the turn-point with another visual transient.
Participants. Ten naive, unpaid observers with normal or corrected to normal vision
were used.
Stimuli. The stimuli in the this experiment were the same as in experiment 1a, except that
here a second identical target, horizontally aligned with the fixation point was flashed for 17ms at the time of the turn, or 50ms before the turn. In different blocks the second target appeared either 3.4° below the fixation point, or 3.4° above the turn-point. Results were the same in both cases.
Task. Observers were asked to judge the horizontal position of the turn-point of the
target with respect to the fixation point. They were instructed to ignore the flashed visual target.
Results. In the case of the visual flash at the time of the turn, the position of the
turn-point was perceived 14.0 ± 2.2 arcmin to the left of the actual turn-turn-point, about the same
perceived 8.5 ± 2.7 arcmin to the left of the actual turn-point. This effect is considerably smaller than previously observed. The flash presented prior to the turn significantly modulated TPE (39% change in magnitude; t(9) = 3.04; p = 1.4 x 10⁻², paired t-test within subject).
Discussion. The presence of a second target had no real effect on the TPE observed, and
again, the addition of a visual transient temporally coincident with the turn, has no effect. Presenting the flash prior to the turn does indeed modulate the effect, perhaps by capturing the moment of flash perception, and giving the flash a head-start for its slower detection process.
Experiment 3b
Cross-modal transient. Here we used an auditory transient, instead of a visual flash, in
our attempts to capture the perceived moment of the turn.
Participants. The same ten observers from 3a were used.
Stimuli. The stimuli in the this experiment were the same as in experiment 1a, except that
here observers wore headphones and a 400 Hz pure tone beep of 50 ms in duration would begin either at the time of the turn, or 50ms before the turn.
Task. Observers were asked to judge the position of the turn-point of the target with
respect to the fixation point. They were instructed to ignore the auditory transient.
Results. In the case of the auditory transient at the time of the turn, the position of the
turn-point was perceived 23.4 ± 2.2 arcmin to the left of the actual turn-point, a much greater magnitude TPE than in the original experiment. In the case of the auditory transient 50 ms prior to the turn, the position of the turn was perceived 17.9 ± 2.5 arcmin to the left of the actual turn-point. This effect, while larger than the original within-modality TPE, still represents a
significant modulation from the temporally coincident case (24% change in magnitude; t(9) = 5.31; p = 4.9 x 10⁻⁴, paired t-test within subject).
Discussion. With the addition of an auditory transient, we still see the relative