INVESTIGATION
Patterns of Neutral Diversity Under General Models
of Selective Sweeps
Graham Coop1and Peter Ralph Department of Evolution and Ecology and Center for Population Biology, University of California, Davis, California 95616
ABSTRACTTwo major sources of stochasticity in the dynamics of neutral alleles result from resampling offinite populations (genetic drift) and the random genetic background of nearby selected alleles on which the neutral alleles are found (linked selection). There is now good evidence that linked selection plays an important role in shaping polymorphism levels in a number of species. One of the best-investigated models of linked selection is the recurrent full-sweep model, in which newly arisen selected alleles fix rapidly. However, the bulk of selected alleles that sweep into the population may not be destined for rapidfixation. Here we develop a general model of recurrent selective sweeps in a coalescent framework, one that generalizes the recurrent full-sweep model to the case where selected alleles do not sweep tofixation. We show that in a large population, only the initial rapid increase of a selected allele affects the genealogy at partially linked sites, which under fairly general assumptions are unaffected by the subsequent fate of the selected allele. We also apply the theory to a simple model to investigate the impact of recurrent partial sweeps on levels of neutral diversity and find that for a given reduction in diversity, the impact of recurrent partial sweeps on the frequency spectrum at neutral sites is determined primarily by the frequencies rapidly achieved by the selected alleles. Consequently, recurrent sweeps of selected alleles to low frequencies can have a profound effect on levels of diversity but can leave the frequency spectrum relatively unperturbed. In fact, the limiting coalescent model under a high rate of sweeps to low frequency is identical to the standard neutral model. The general model of selective sweeps we describe goes some way toward providing a moreflexible framework to describe genomic patterns of diversity than is currently available.
T
HE high levels of genetic variation within natural pop-ulations have long fascinated population geneticists. One school of thought holds that a substantial proportion of this molecular polymorphism is neutral or very weakly deleteri-ous (Kimura and Ohta 1971; Ohta 1973; Kimura 1983). For neutral polymorphism, the level of genetic diversity results from a balance between the introduction of alleles through mutation and their stochastic loss (Kimura and Crow 1964; Kimura 1969; Ewens 1972). Under the neutral theory of molecular evolution this stochasticity is thought to result mostly from genetic drift (Kimura 1983), the random resam-pling that occurs in finite populations, an effect that is ex-aggerated byfluctuating population size and large variation in reproductive success among individuals (see Charlesworth2009, for a recent review). However, selection at linked sites may provide a major source of stochasticity as the dynamics of a neutral allele can be strongly influenced by the random genetic background on which selected alleles arise (Maynard Smith and Haigh 1974; Kaplan et al. 1989; Charlesworth
et al.1995; Hudson and Kaplan 1995b).
In many species examined to date, levels of diversity are substantially lower in regions of low recombination, as found in multiple species of Drosophila (Aguade et al.
1989; Berry et al. 1991; Begun and Aquadro 1992; Begun
et al.2007; Shapiroet al.2007),Caenorhabditis(Cutter and Payseur 2003; Cutter and Choi 2010), humans (Hellmann
et al. 2008; Cai et al. 2009), and Saccharomyces cerevisiae
(Cutter and Moses 2011), but not in all species,e.g., Arabi-dopsis(Nordborget al.2005; Wrightet al.2006). Moreover, levels of diversity are also lower in regions thata prioriare expected to have a higher rate of functional mutations,e.g., near genes and conserved elements (Cai et al. 2009; McVickeret al.2009; Hernandezet al.2011). Since the rate of neutral genetic drift is independent of recombination rate, this positive correlation between recombination rates and Copyright © 2012 by the Genetics Society of America
doi: 10.1534/genetics.112.141861
Manuscript received May 8, 2012; accepted for publication June 1, 2012
Supporting information is available online at http://www.genetics.org/content/ suppl/2012/06/19/genetics.112.141861.DC1.
1Corresponding author: Department of Evolution and Ecology and Center for
diversity offers good evidence that linked selection plays a substantial role in the fate of alleles, especially in low-recombination regions. What is still far from clear is how different forms of linked selection contribute to this reduc-tion and whether linked selecreduc-tion can explain the narrow observed range of genetic diversity across species with vastly different (census) population sizes (Lewontin 1974; Maynard Smith and Haigh 1974).
Models of the effect of linked selection have often been divided between those that propose the source of this linked selection to be either the purging of deleterious variation (background selection) or the selective sweep of beneficial alleles (hitchhiking). In this article we explore the consequences of a generalized model of hitchhiking on patterns on neutral diversity. We first review some of the key results of models of linked selection. Under the background selection model, genetic diversity is continu-ously lost from natural populations due to the removal of haplotypes that carry deleterious alleles (Charlesworth
et al. 1995; Hudson and Kaplan 1995b). For strongly del-eterious alleles, this continuous loss acts primarily to in-crease the rate of genetic drift at markers closely linked to loci with high deleterious mutation rates (Hudson and Kaplan 1995a; Nordborget al.1996). Therefore, this back-ground selection model leads to a reduction in genetic di-versity but no skew in the frequency spectrum. However, a skew toward rare neutral alleles can result if weakly dele-terious mutations are incorporated into the model (Nordborg
et al.1996; Gordoet al.2002).
On the other end of the spectrum, Maynard Smith and Haigh (1974) proposed that local levels of genetic diversity could be reduced by the hitchhiking effect. The hitchhiking effect results from the fact that when an initially rare, ben-eficial allele sweeps rapidly to fixation, it carries with it a linked region of the haplotype on which it arose. The size of the genomic region affected by a recent sweep is propor-tional to the ratio of the strength of selection to the rate of recombination (Maynard Smith and Haigh 1974; Kaplan
et al.1989; Stephan et al.1992; Barton 1998), and so the reduction in levels of diversity is determined by the distri-bution of selection coefficients and the rate of sweeps per unit of the genetic map. Neutral alleles farther away from the selected site may not be pulled all of the way tofixation if recombination occurs during the sweep, which can lead to a transient excess of high-frequency derived alleles an in-termediate distance away from the selected site after each sweep (Fay and Wu 2000; Przeworski 2002; Kim 2006). As neutral diversity levels slowly recover through an influx of new mutations after the sweep, there is a strong skew to-ward low-frequency derived alleles, a pattern that persists for many generations (Braverman et al. 1995; Przeworski 2002; Kim 2006). In a large population, the rate of sweeps could be high enough that hitchhiking dominates genetic drift as the source of stochasticity (Maynard Smith and Haigh 1974; Kaplan et al. 1989; Gillespie 2000), an idea that has been termed genetic draft (Gillespie 2000).
Support for a hitchhiking model over the standard model of background selection is found inDrosophila, where there is a greater skew toward rare alleles at putatively neutral sites in regions of low recombination (Andolfatto and Przeworski 2001; Shapiro et al.2007) and regions surrounding amino acid substitutions have lower levels of diversity (Andolfatto 2007; Macpherson et al. 2007; Sattath et al. 2011). How-ever, in humans (and other species) there is no strong skew toward rare alleles in low-recombination regions (McVicker
et al.2009; Hernandezet al.2011; Lohmuelleret al.2011), which combined with other evidence (Coop et al. 2009; Hernandezet al.2011) suggests that full sweeps may have been rare and that background selection may be the main mode of linked selection, in humans and a number of other species.
Although the recurrent full-sweep model has been the subject of considerable theoretical investigation, it may actually be relatively rare for advantageous alleles to sweep rapidly all the way to fixation. Fluctuating environments (e.g., Gillespie 1991; Kopp and Hermisson 2007, 2009a,b) and changing genetic backgrounds may often act to prevent alleles from achieving rapid fixation within the population (see Pritchard et al. 2010 for a recent discussion). For ex-ample, if multiple mutations affecting the adaptive pheno-type segregate during the sweep, then it may be that no one of these alleles sweeps tofixation (Pennings and Hermisson 2006a,b; Chevin and Hospital 2008; Ralph and Coop 2010). Multiple alleles spreading rapidly from low frequency can lead to either a set of partial sweeps within the population or a soft sweep if the alleles are tightly linked. Furthermore, a similar effect can occur when selection acts on an allele present as standing variation, if the allele is present on mul-tiple haplotypes when it starts to spread (Innan and Kim 2004; Hermisson and Pennings 2005; Przeworski et al.
2005). The fact that, under these models, no single haplo-type goes quickly tofixation acts to reduce the hitchhiking effect and alters the effect on the frequency spectrum.
The genome-wide effect of other modes of linked selection on patterns of diversity is relatively unexplored. One model that has been investigated is an infinitesimal model of directional selection, where the aggregated effect of selection over many loci can be a substantial source of stochasticity at linked and even unlinked sites (Robertson 1961; Santiago and Caballero 1995, 1998; Barton 2000). Fluctuating selection due to varying environments has also been shown to lead to reduced levels of diversity at linked neutral sites (Gillespie 1994, 1997; Barton 2000) and sim-ulations of specific models of fluctuating selection have shown that the same reduction in diversity can result in a much smaller skew in the frequency spectrum than under the hitchhiking model (Gillespie 1994, 1997). However, as yet no coalescent model of the effect of recurrent incomplete sweeps has been developed.
necessarily tofixation. We concentrate on the case of a very large population and sites that are partially linked to this selected locus. Wefind that if the initial rise of the selected allele is rapid, then the coalescent process is primarily affected by this stage and relatively insensitive to the subsequent dynamics of the selected allele. Using this intuition, we then develop a coalescent model of recurrent sweeps on patterns of neutral diversity in which selected alleles may reach only intermediate frequency. To test the approximations involved in the model we compare the re-sults at several stages to simulations. Some of the implications of these results for interpretation of genome-wide diversity patterns are presented in theDiscussion.
Results
Coalescent framework and assumptions
Asfirst described by Hudson and Kaplan (1988) and Kaplan
et al.(1988), patterns of neutral diversity at a neutral locus linked to a selected locus can be modeled by conditioning on the trajectory of the frequency of the selected allele through time and treating the two allelic classes as subpopulations within each of which the dynamics are neutral, with recom-bination moving lineages between the two (see also Barton and Etheridge 2004; Barton et al.2004). Consider a locus under selection at which a derived alleleDand an ancestral allele Asegregate, and let the frequency ofD at time tbe denoted X(t). We study the coalescent process at a neutral locus partially linked to our selected locus, with recombina-tion occurring at raterper generation between the selected and the neutral locus. Each ancestor on a given lineage in the coalescent process carried either theDor theAallele at the selected locus, which we refer to as the “type”of that lineage.
Throughout we assume that the diploid population sizeN
is large and constant over time. For simplicity, we assume that the effective population size is 2N[i.e., the neutral co-alescence rate of a pair of lineages is 1/(2N)] and that no more than two lineages coalesce at once in the absence of a selective sweep.
Suppose at timetthatkDandkAof our lineages are of the derived and the ancestral type, respectively. There areNX(t) individuals carrying the derived allele that could be progen-itors of thekDlineages, so the instantaneous rates of coales-cence of pairs of lineages within the two allelic classes at timetare
kD
2
1
2NXðtÞ and
kA
2
1
2Nð12XðtÞÞ; respectively:
(1)
The total instantaneous rate of recombination is (kD+kA)r. If a recombination event occurs on a lineage at time t, it chooses to be of type D with probability X(t) and chooses to be of typeAotherwise.
We leave the dynamics of the selective sweeps that determine X(t) fairly unspecified, and while stochasticity may play an important role in shaping the trajectories, in examples we usually treat X(t) as nonrandom. As we want coalescences caused by a single selective sweep to occur at more or less the same time, we require that once the se-lected allele is introduced into the population, it increases in frequency rapidly, and that once the allele frequency leaves the boundary (e.g., moves above 1%), it does not return (e.g., drops below 1%) unless it does so on the way to loss (e.g., hits 0 before returning to 1%). This condition implies that our model applies to alleles that are at least partially codominant, as fully recessive alleles spend appreciable time, behaving stochastically, at very low frequencies, which can lead to different coalescent dynamics at linked loci (Teshima and Przeworski 2006; Ewinget al.2011).
Relation to previous models
We describe a simple approximation to the coalescent with recurrent sweeps that is inspired by similar approximations for a model of recurrent full sweeps. The approximation postulates two types of coalescent events: “neutral”events occurring at rate 1/2N between any pair of lineages and additional coalescent events, involving two or more line-ages, due to selective sweeps. The first class of events can occur at any time, due to random resampling of lineages. The second class of events, the sweep-induced coalescent events, can involve more than two lineages, as we assume that lineages forced to coalesce by a sweep do so instanta-neously on the relevant timescale. We assume that all such lineages coalesce into a single lineage and that the distribu-tion of the number of such lineages is binomial, with a suc-cess probability that is a function of the trajectory taken by the selected allele and the recombination distance to that allele. This framework is a natural extension of similar approximations used for full sweeps (Barton 1998; Gillespie 2000; Kim and Stephan 2002; Durrett and Schweinsberg 2005; Nielsenet al.2005).
showed that a coalescent process with simultaneous multi-ple collisions could provide a better approximation to the coalescent process during a sweep, a direction we do not pursue (see also Barton 1998; Etheridgeet al.2006).
An approximation to the coalescent process during the sweep
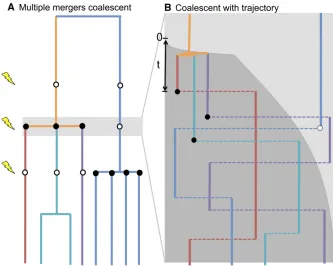
Figure 1A shows an example of the relationships between different sampled individuals at a neutral locus in a finite population undergoing recurrent selective sweeps. At the times indicated by the lightning bolts, selective alleles sweep into the population at some locus linked to our neutral site. All lineages descended from the original carrier of the de-rived allele coalesce, nearly instantaneously on this timescale.
Figure 1B zooms in on one of these selective sweeps. The derived allele at the selected locus (D) aroset generations ago. Thefive surviving ancestral lineages recombine on and off the D background, whose frequency through time is shown by the dark gray shading. Just after time 0 those lineages on the D background coalesce as X goes to zero (their coalescent rate, which is proportional to 1/X, goes to infinity). We will show that the complexity of the process shown in Figure 1B can be approximated by a much simpler multiple-merger coalescent process suggested by Figure 1A, in which lineages coalesce “neutrally”at rate 1/(2N), and furthermore, each lineage flips a coin at each selective sweep to decide which type it is, and those that are of type
D merge simultaneously.
Suppose that a derived allele at the selected locus (D) arose t generations ago, at time 0. The selected mutation may still segregate within the population in the present day
or may have gone to fixation or loss sometime before the present [in which case X(t) = 1 or 0, respectively]. First consider coalescences occurring very close to the origin of a selective mutation. A lineage can be typeD at time 0 for one of two reasons: either it was of typeDin the present day and not yet recombined off theDbackground or at thefirst recombination after the selected allele arose, the lineage chose to be of type D. The lineage of an individual drawn at random from the present-day population is therefore of typeD at time 0 with probability
q¼qðr;XÞ:¼XðtÞe2rtþr
Z t
0
e2rtXðtÞdt: (2)
Here the integral is over t, the number of generations be-tween the origin ofDand thefirst subsequent recombination on a lineage (tis marked for the red lineage in Figure 1B). Note that although many recombination events may have occurred, since at each recombination event the lineage chooses a new type independently of its previous type, we need consider only thefirst after the sweep. Ift 1/r, the
first term can be ignored, so we commonly assume that
qðr;XÞ ¼r
Z N
0
e2rtXðtÞdt; (3)
as the allelic state of the sample has long been forgotten. Importantly, we can see that the dependence of q on X
decays exponentially through time at rate r. Therefore, the fate of the selected allele more than a few multiples of r
after it arose, including its presence or absence in the pres-ent day, will have little effect on q. Concretely, for two tra-jectories labeled 1 and 2, ifX1(s) =X2(s) for all 0#s#T,
then regardless of subsequent differences in the trajectories, |q12q2|#e2rT.
We can now approximate the rapid coalescence of lineages that are forced by the sweep by assuming that all lineages descended from the original carrier of theDallele coalescesimultaneouslywhen the selected allele appears (a
“multiple merger”). The lineages will actually coalesce at slightly different times, but the assumption the derived al-lele increases rapidly implies that this difference is small on the coalescent timescale [i.e.,o(2N)]. As each lineage takes part in this merger independently with probability q, the probability thatiofksurviving lineages coalesce at time 0 is
k i
qið12qÞk2i; for 2#i#k; (4)
reducing the number of lineages fromktok2i+ 1. This approximation assumes that each lineage makes an independent choice of whether to recombine off the sweep, which is equivalent to assuming that the coalescences caused by the sweep form a“star”-like tree, with no internal edges of nonzero length. Therefore, the approximation ignores dependencies between lineages induced by coales-cent events earlier in the sweep and so is a poorer approx-imation for a large number of lineages. More sophisticated approximations have been developed to account for this de-pendency, which improve the properties for large samples (Barton 1998; Durrett and Schweinsberg 2004; Etheridge
et al.2006; Pfaffelhuberet al.2006). However, we believe this approximation captures many of the important features. The other component of our approximation is that at all times, all pairs of lineages coalesce at rate 1/(2N) regardless of their allelic background. This approximation ignores the fact that lineages that are currently on different back-grounds cannot coalesce and that lineages on the same background coalesce at a higher rate (see Equation 1).
We also note that although large changes in the allele frequency over a small number of generations represent a large number of children descended from a smaller number of ancestors, this will not cause rapid coalescence in a large population if the allele remains at intermediate frequencies. Concretely, consider a short time interval from generationt1 to generationt2, over which intervalX(t)(t22t1)/N. The chance that any coalescence occurs during this time interval on the derived background is small [O((t22t1)/(X(t)N))], regardless of how the frequencyXchanges. Therefore, large, sudden changes in allele frequencies will force coalescence on the derived background only if X(t) is of order 1/N (and similarly for the ancestral background). For sites that are only partially linked to the selected locus, if recombination is moving the lineages across backgrounds at a sufficiently high rate compared to the neutral coalescent rate (Nr1), then two lineages in this subdivided model coalesce at a rate close to 1/2N (see Hudson and Kaplan 1988; Hey 1991; Nordborg 1997; Barton and Etheridge 2004 for a de-tailed discussion). As such, our approximation will therefore
be worse close to the selected site, but is asymptotically cor-rect for larger.
A simple trajectory: To build intuition, we first consider a simple trajectory, making further approximations to keep the results accessible, and compare the results to full coalescent simulations. Assume that D arises t generations ago at a site at distancerfrom the neutral site under con-sideration, rapidly sweeps to frequencyx, and remains close to this frequency for a time 1/r. Under many models of directional selection, most of the time spent in reachingxis spent at low frequency, so that any recombination that occurs during this time will likely move a lineage to the ancestral type, and so only lineages that do not recombine during the initial sweep will coalesce. If we let tx be the time it takes for the selected allele to sweep toxand assume
rt 1, then a simple approximation toq(r,X) is therefore (with the subscript emphasizing dependence onx)
qðr;XÞ qx :¼xe2rtx: (5)
If the initial increase ofDis driven by additive selection of strengthswithNs.1, then the initial trajectory ofDwill be logistic, and it is reasonable to taketx= log(ax/(12x))/s, wherea= 2Nor 4Nsdepending on whethersis of order 1 or 1/N[the latter case corresponding to the case where the selected allele has to rapidly achieve frequency 1/(Ns) to escape loss by drift]. Usingqxto approximate the probability that a lineage is caught by the sweep, the expected pairwise coalescent time is smaller by a factor of
12q2xe2t=ð2NÞ
; (6)
which can be found by considering whether a pair of lineages coalesce before, during, or after the sweep.
If rather than remaining nearx, the selected allele con-tinues to sweep to fixation—perhaps it is still under selec-tion with strength s2 r—then qxe2rtx because the selected allele has gone quickly tofixation as in a full sweep, and the only time for recombination is in the early phase of the trajectory tx. On the other hand, if the allele became strongly deleterious (s2 , 0 and |s2| r), then q 0, because there is little chance of it contributing genetic ma-terial to the population. However, if selection subsequently experienced by D is weak (|s2| r), so that subsequent dynamics of the selected allele are sufficiently slow, then q
and therefore the coalescent process are independent of the eventual fate of the selected allele. In summary, forqxto be a good approximation toq(r,X) and for the sweep to have an appreciable effect on the coalescent, we need |s2|r,s.
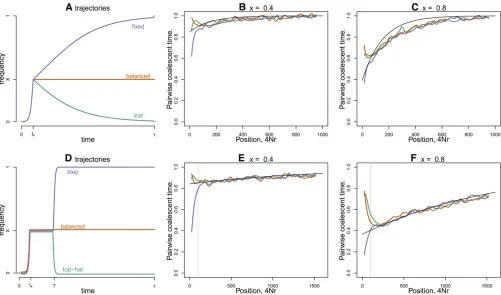
cases, the initial rise ofDwas modeled as deterministic logis-tic growth begun at frequency 1/2Nand adjusted to reach frequency x after tx units of time. In the first case (“ bal-anced”), the allele remains thereafter at frequency x. In the next two cases (Figure 2, A–C), after time tx, allele D
approaches either frequency 1 (“fixed”) or frequency 0 (“lost”) logistically, reaching frequency 12 1/2N(or 1/2N, respec-tively) after the nextttime units. In the last two cases (Figure 2, D–F), the alleleDremains atxforTgenerations and then proceeds logistically, in timetx, either to frequency 121/2N
(“step”) or to frequency 1/2N(“top hat”).
In each case, we used mssel [a modified version of ms
(Hudson 2002) that allows an arbitrary trajectory, kindly supplied by Richard Hudson] to simulate genealogies for a recombining sequence surrounding a selected locus at which a selected allele performs one of the trajectories shown in Figure 2 . The average pairwise coalescence time from these simulations was calculated by dividing the pair-wise genetic diversity by the mutation rate and is shown in Figure 2 at different distances from the selected locus, com-pared to the quantity predicted by Equation 6. Close to the selected site (e.g., for r , 1/T in Figure 2, E and F) the curves diverge, since the sites represented by the blue curves see a full sweep, reducing diversity close to the selected site, while those in the orange curves see a short-term balanced
polymorphism and hence show a peak in polymorphism near the selected site. As we increase recombination dis-tance away from the selected site, the three curves are in good agreement with the black line (Equation 6), indicating that our partial sweep model captures the main effect on diversity.
Our simple approximation describes diversity levels well at partially linked sites over a range of different scenarios and works well for a wider range of parameters (results not shown). We furthermore used Equation 4 to predict the effect of this simple partial sweep on the coalescent process of more than two lineages and found close agreement with furthermsselsimulations for various summaries of diversity such as the expected number of segregating sites (results not shown). Overall, these results confirm that for partially linked sites, the coalescent process is mostly determined by the initial rapid behavior of the selected allele.
A recurrent sweep coalescent model
We now consider patterns of diversity at a neutral locus affected by many different selected alleles that sweep into the population at the times of a homogeneous Poisson process with raten. We assume that the sweep rate is low enough that sweeps do not interfere with each other and return to discuss this assumption later. Each sweep occurs at
Figure 2 The effect of a single partial sweep. (A) Three possible trajectories followed by theDallele after it arisestgenerations ago, as described in the text: blue is“fixed,”green is“lost,”and orange is“balanced.”(B and C) Mean pairwise coalescent time against recombination distance away from a selected site that has experienced one of the three types of sweeps shown in A, withx= 0.4 and 0.8, respectively. The other parameters weretx/2N=
6.6·1023andt/2N= 0.05. (D) Another three possible trajectories: green is“top hat”and blue is“step.”(E and F) Pairwise coalescent time as in B and C, but using the trajectories shown in D. The other parameters weretx/2N= 6.1·1024,t/2N= 0.1, andT/2N= 0.02. The black line shows the
some distancerfrom the neutral locus, and as it sweeps its frequency follows some particular trajectoryX(t), which to-gether in Equation 3 determineq, the probability that a lin-eage at the neutral site is caught by the sweep. Rather than try to explicitly model randomness in these two compo-nents, at first we assume that each sweep independently chooses its value of q from a probability distribution with densityf(q). This model is exactly a Lambda coalescent, with
L(dq) = q2nf(q)dq+d
0(dq)/2N(see Berestycki 2009, for a recent review), but we leave our discussion in terms offto make the results more intuitive.
Following from our assumption that each lineage is affected by a given sweep independently with probability
q, when there arek surviving lineages, the rate at which they coalesce tok2i+ 1 lineages due to sweeps is
n k i Z 1 0
qið12qÞk2ifðqÞdq: (7)
This follows from our assumption that sweeps occur homogeneously through time and do not interfere with each other and with properties of marked Poisson processes. For ease of presentation we denote
Ik;i¼
k i
Z 1
0
qið12qÞk2ifðqÞdq: (8)
Recall that under our model, the rate of coalescence of pairs of lineages due to genetic drift is 1/(2N), so that the rate at which the coalescent process with k lineages coalesces to
k2i+ 1 lineages is
lk;i¼
k
2
1
2Ndi;2þnIk;i for 2#i#k; (9)
where di,2= 1 if i= 2 and 0 otherwise. The total rate of coalescent events when there areklineages is therefore
lk¼
1 2N k 2
þnX
k
i¼2
Ik;i for k$2; (10)
and conditional on a coalescent event the probability thati
lineages ofkcoalesce, reducing fromktok2i+ 1 lineages, is
pk;k2iþ1¼
lk;i
lk ¼
ð1=2NÞ
k
2
di;2 þ nIk;i
ð1=2NÞ
k
2
þnPki¼2Ik;i
; for 2#i#k:
(11)
To simulate from this coalescent process we can simulate an exponential waiting time with rate lk, pick a number of
lineages to coalesce using probabilitiespk,k2i+1, and run this process until we have a single lineage remaining.
Note that in deriving this process we have assumed that at all times, lineages also coalesce at a neutral rate 1/2N.
This can be justified by assuming that recombination moves lineages between backgrounds at a high enough rate to allow the effects of the partitioning of the population by segregating alleles to be ignored. Therefore, the approxi-mation will break down if a typical neutral site, at any given time, is close enough (e.g., within an r of order 1/N) to an allele maintained at intermediate frequency by long-term balancing selection (e.g., alleles maintained for timescales of orderN). Further work is needed to refine the coalescent under those conditions, but our approxima-tions should be suitable for a broad range of scenarios and genomic regions.
The coalescent process with homogeneous sweeps
It is natural to examine the case in which selective sweeps occur at a uniform rate along a sequence of total lengthL. We assume that this sequence recombines at rate rBP per base each generation and that sweeps enter the population at a ratenBPper base each generation, so that the total rate of sweeps isn=nBPL. We also assume that the sweeps are homogeneous;i.e., the trajectory followed by the frequency of the derived allele, X, is independent of the distance between our neutral site and the site at which a sweep occurs.
We consider sweeps occurring along a very long chromo-some and so takeL/N, but then the total rate of sweeps,
n =nBPL, also goes to infinity. To obtain a meaningful limit, we need that asL/Nthe rate of sweeps corresponding to each nonzero value of q converges to a finite value. Recall from (3) that the probability a lineage is caught up in a given sweep depends on the distance to the sweep (which isrBPℓ for a siteℓbases away) and the trajectory Xtaken by the sweep and is given by qðrBPℓ;XÞ ¼rBPℓ
Rt
0expð2rBPℓtÞXðtÞdt: In a finite genome of length L, the probability distribu-tion on values of q has density f(q) =hL(q)/L, where
hLðqÞ ¼R0LℙXfqðrBPℓ;XÞ 2dqgdℓ. Here hL(q) is the rate at which selective sweeps appear at locationrBPℓand whose trajectory X gives q(rBPℓ, X) = q, integrated across the genome; and f(q) is hL(q) normalized to integrate to 1, sinceR01hLðqÞdq¼L. The functionshLconverge forq.0 asL
becomes large as long as the probability that distant sweeps affect the focal site decays quickly enough. We therefore as-sume thathL(q) converges to afinite limith(q),i.e., that the following exists:
hðqÞ ¼ lim
L/NL fðqÞ for 0,q#1: (12) This means that although the total rate of sweeps per generation is infinite, only a finite number happen close enough to our neutral site to potentially affect our co-alescent process. Therefore, the rate at which k lineages coalesce down tok2i+ 1 due to sweeps converges:
nBPLIk;i/nBP
k i
Z 1
0
qið12qÞk2ihðqÞdq as L/N:
If we take the trajectory X to be fixed, we can rewrite Equation 13 as
nBP k
i
! Z 1
0
qið12qÞk2ihðqÞdq
¼nBP k
i
! Z N
0
qðrBPℓ;XÞið12qðrBPℓ;XÞÞk2idℓ
¼nBP rBP
k
i
! Z N
0
qðr;XÞið12qðr;XÞÞk2idr; (14)
which decouples the dependency of the rate of sweeps on the recombination rate rBP from the trajectory X. If X is random, then we need to average over possible trajectories, and so we define
Jk;i¼ k i X h
∫∞0qðr;XÞið1−qðr;XÞÞk2idr i
; (15)
where EX[] denotes the average over possible trajectories.
We assume that this integral is finite for 2 # i # k; for further discussion of these points see Appendix A. Impor-tantly, under our assumption that sweeps do not interfere with each other,Jk,idoes not depend on the recombination
raterBPor the rate of sweepsnBP, but only on the dynamics of the selective sweepsX.
Allowing coalescent events due to drift,k lineages coa-lesce down tok2i+ 1 at rate
lk;i¼
1 2N k 2
di;2þ
nBP rBP
Jk;i for 2#i#k; (16)
where di,2= 1 ifi= 2 and is 0 otherwise. As Equation 16 follows from the simple change of variable in Equation 14, it will hold under any homogeneous sweep model where sweeps instantaneously (relative to a timescale of 2N) force lineages to coalescence, withJk,ireplaced by some constant
that does not depend onrBPornBP. This result greatly gen-eralizes that of Kaplanet al.(1989), who described a similar coalescent process for a full-sweep model.
We can see from Equation 16 that 2NnBP/rBPis the rele-vant compound parameter that in a general sweep model determines the rate of sweeps relative to neutral coalescent events. In small samples, sweep-induced coalescent events will dominate those due to drift if the population-scaled rate of sweeps per unit of the genetic map is much greater than one, provided that not all the Jk,iare too small. We revisit
this strong-sweep limit in theLimiting processessection.
The coalescent process with homogeneous partial sweeps
We now return to the setting above (inA simple trajectory), in which a simple trajectory rises quickly to frequency x, under which assumptions q(r, X) qx (Equation 5). We suppose that the frequency xat which each sweep slows is chosen independently with probability density g(x). It also
seems reasonable to assume furthermore thattx, the time it takes to reach frequencyx, does not depend onx; we denote this time byt. This is approximately true for many models of directional selection, since selected alleles move quickly through intermediate frequencies. In this case, the rate at whichklineages coalesce tok2i+ 1 is
lk;i
1 2N k 2
di;21
k
i
nBP
t rBP
Z N
0
Z 1
0
ðxe2rÞið12xe2rÞk2igðxÞdx
dr;
(17)
suggesting that the important quantity, which acts as a co-alescent timescaling, is 2NnBP/(t rBP), with the distribution onxacting to control how many lineages are forced to co-alesce with each sweep. If we determinetby a simple model of additive selection with selection coefficient s, the key parameter becomes 2NnBPs/(log(Ns)rBP).
This compound parameter, 2NnBPs/(log(Ns)rBP), is also the key parameter in full-sweep models (Kaplan et al.1989; Stephanet al.1992). However, since full sweeps requirex= 1, if diversity is strongly reduced, then numerous lineages must merge at each sweep, which in turn leads to a strong skew toward rare alleles in the frequency spectrum. We will see that this relationship between the reduction in diversity and the skew in the frequency spectrum is substantially weak-ened under a partial sweep model when we allowx1.
Summaries of neutral genetic diversity
Level of neutral diversity: A key quantity of interest is the level of neutral nucleotide diversity,p, the number of differ-ences between randomly sampled alleles at a neutral locus. Under an infinite-sites model of mutation, which we use here, the expectation of p, averaging across sites, is equal to the expected coalescent time of a pair of lineages multi-plied by twice the mutation rate. If the mutation rate per generation at our neutral locus is m, in the absence of sweeps, the level of diversity isE[p] =u, whereu= 4Nm
is the population-size–scaled mutation rate, and the expec-tation is the average across sites. Note thatuis the level of diversity under the usual neutral model.
Under our model featuring both sweeps and drift,
E½p ¼ u
1 þ 2N I2;2n
; (18)
so a key parameter is the population-scaled rate of sweeps 2Nn.
To examine the applicability of our approximations we again performed coalescent simulations withmsselfor a se-lected locus at a fixed location experiencing recurrent sweeps. In this case, where selected alleles recurrently sweep into the population at afixedgenetic distance r, fol-lowing our simple partial sweep trajectory again as charac-terized by qxand 2N, the nucleotide diversity is given by
E½p ¼ u
1þ2Nnx2 expð22rt xÞ
We used two types of recurrent trajectory, the recurrent step and the recurrent top hat, as described earlier. For the recurrent top-hat trajectory, we simulated an exponential waiting time with mean nbetween the end of one top hat and the start of the next (and similarly for the step case). In Figure 3 we show diversity levels moving away from the locus undergoing these two types of recurrent sweeps, as well as the analytical approximation given by Equation 19. Recall that in both types of trajectories the derived allele pauses at frequency xfor time T, and therefore we expect that the fate of the allele will affect diversity at recombina-tion distances,1/T. For distances.1/T, Equation 19 shows good agreement with our simulations, regardless of whether the recurrent sweeps go to loss orfixation. The approxima-tion does not perfectly match our simulaapproxima-tions, presumably because e2r2tx is an imperfect approximation to the proba-bility of recombination during the sweep. Nevertheless, di-versity levels generated by the two types of recurrent trajectory agree away from the selected site, which
impor-tantly confirms that only the initial rapid stage of the trajec-tory affects the coalescent process at partially linked sites.
The level of diversity under homogeneous sweeps: Under the model in which sweeps occur homogeneously along an infinite sequence, with coalescent rates given by Equation 16, the level of nucleotide diversity is given by
E½p ¼ u
2NnBPJ2;2=rBPþ1
: (20)
These results generalize previous results by Kaplan et al.
(1989) and Stephanet al.(1992), who found a relationship of the form (20) for a model of homogeneous recurrent full sweeps. In fact, since Equation 20 follows only from the assumption that the rate and characteristics of sweeps are independent of their location along the genome (see Equa-tion 14), this relaEqua-tionship between diversity, the density of selective targets, and recombination rate will hold for a wide
Figure 3 Reduction in diversity (p/u) as a function of recombination distance from a site experiencing recurrent sweeps. The three panels are for different values of the frequencyxthat each sweep reached rapidly. The solid line is for recurrent top-hat trajectories and the dashed line for recurrent step trajectories The time that the trajectory pauses isT/2N= 0.01 andtx/2N= 0.003 in both cases. The three colors correspond to three different
variety of homogeneous recurrent-sweep models including the homogeneous full-sweep model.
Frequency spectrum:We now study the effects of recurrent partial sweeps on other properties of neutral diversity at a locus besides pairwise nucleotide diversity and compare our calculations to simulation.
Two commonly studied properties of a sample of neutral diversity at a locus are the expected number of segregating sites in a sample of size n and the expected number of singletons in a sample of size n. Under the infinite-sites assumption, these are respectively equal to the mutation rate multiplied by the expected total length of the genealog-ical tree of the sample (which we denote Ttot) and by the mutation rate multiplied by the expected total length of the terminal branches (T1). We provide recursions that allow easy calculation of bothE[Ttot] andE[T1] inAppendix B.
We also look more generally at the frequency spectrum of segregating alleles, which is, in a sample of nindividuals, the proportion of segregating sites at whichkderived alleles
are found, for each 1#k#n. LetFn,kdenote the expected
proportion of segregating sites in a sample of sizenat which exactlyksamples carry the derived allele under an infi nite-sites model of mutation.Fn,kis equal to the expected time in
the coalescent tree spent on branches that subtend exactlyk
tips (those on which mutation would lead to a site segre-gating at k of the n samples), divided by E[Ttot]. Under neutrality (Kingman’s coalescent), this quantity is
FN
n;k¼ ð1=kÞ=
Pn21
j¼1ð1=jÞ. It is not so easy tofind an explicit general expression under the coalescent model with sweeps that we study, but for the casek= 1 we have described in
Appendix Bhow to computeE[T1]/E[Ttot], and the general case can be found from simulation of the coalescent process. Figure 4A shows the ratio ofFn;k=FNn;k, estimated by direct
simulation of our coalescent process. The rates are given by Equation 9, with q fixed to qx¼xe2txr, and txr = 0.6 (and various x). To make the simulations comparable, the population-scaled rate of sweeps 2Nnwas adjusted such that
p/u= 1/2 in each,i.e., to obtain a 50% reduction in diversity due to sweeps. We see that for partial sweeps at afixed site,
Figure 4 Properties of the frequency spectrum with sweeps occurring at afixed genetic distance. Coalescent rates are given by Equation 9, withqfixed to qx¼xe2txr andtxr= 0.6, across a range ofx. (A) The percentage of segregating sites found at frequency 1 #k#20, relative to the neutral
expectation (i.e.,F20;k=FN20;k). In these simulations the rate of sweepsNnhas beenfixed to result in a 50% reduction in diversity. The dashed gray line
gives the neutral expectation. (B) The mean number of singletons divided by mean number of segregating sites, frommsselsimulations with a sample size of 10 at a neutral site a distance 2Nr= 200 from a selected site. The selected allele performs a recurrent top-hat trajectory (withN= 10,000 and tx/2N= 0.003, givingrtx= 0.6, and pausingT/2N= 0.01) to frequencyx= 0.2,x= 0.5, orx= 0.9 across a range of 2Nn. Note the span ofp/uis smaller in
across a range ofx, the frequency spectrum is skewed toward rare alleles and away from intermediate-frequency alleles.
To test the degree to which our coalescent matches the full model, in Figure 4B we compare the mean proportion of singleton sites under our coalescent model to that found from simulation withmssel. We simulated a recurrent top-hat trajectory of the frequency at a selected locus as before and used this trajectory with msselto simulate the neutral coalescent at a nonrecombining locus a distanceraway from this selected locus. We used the three valuesx= 0.9, 0.5, and 0.2 for the intermediate frequency the allele reached and in each case varied the rate of sweeps,n. Each combi-nation ofn andxgives a point in Figure 4B, plotted at its mean reduction in diversity (p/u) and the mean number of singletons divided by the mean number of segregating sites. These are compared to the analytical values ofE[T1]/E[Ttot] computed using Equations B1 and B3, with coalescent rates given by Equation 9, using a constantq¼xe2rtxand Equation
20 to find the reduction p/u. There is good agreement be-tween the simulations and the analytical results, showing that our simplified process approximates the properties of the full coalescent process at a single site reasonably well.
Figure 4 studied the effect on the frequency spectrum of recurrent sweeps at a fixed distance from a neutral site; in Figure 5 we study the frequency spectrum under the coales-cent process with sweeps occurring homogeneously along the genome. Figure 5, A and B, shows the same quantities as Figure 4A, for simulations of the homogeneous partial-sweep coalescent process with afixed value ofx, using rates given by Equation 17, and 2NnBP/(trBP) chosen so thatp is 50% and 10% of its value under neutrality, respectively. In Figure 5C, there is no genetic drift and only sweeps force coalescence, i.e.,N=N, and so we do not need to specify 2NnBP/(trBP) as it acts only as a timescaling. In Figure 5D we show our analytic calculation ofE[T1]/E[Ttot] as a function of the reduction inp caused by selective sweeps.
The skew in the frequency spectrum depends strongly on the frequency x reached by the selected allele. Sweeps to low frequencies lead to a much smaller distortion for the same reduction inp. Therefore, the strong relationship be-tween the reduction in p and the skew in the frequency spectrum under a model of full sweeps is much weaker if the sweeps do not go tofixation.
Intriguingly, sweeps that go to intermediate frequency can lead to a greater proportion of high-frequency–derived alleles than under a full-sweep model. While a single, recent full sweep leads to high-frequency derived alleles through hitchhiking (Fay and Wu 2000), under a recurrent full-sweep model these alleles are thenfixed in the population by sub-sequent sweeps and drift (Kim 2006) and therefore removed from the frequency spectrum. Further work would be needed to understand the intuition for the excess of high-frequency derived alleles under a recurrent partial-sweep model.
Summaries of the frequency spectrum:In Figures 4 and 5, we saw that regardless of whether sweeps occur at a fixed distance from our neutral site or homogeneously along the sequence, as we increase the rate of sweeps the frequency spectrum becomes further skewed toward rare derived alleles at the expense of intermediate-frequency alleles. Here we provide evidence that this will hold for any set of parameter values. Tajima’s D and Fu and Li’s D (Tajima 1989; Fu and Li 1993) are two common ways of detecting deviations away from the frequency spectrum expected un-der a neutral model with a constant population size. Nega-tive values of Tajima’s D can be thought of as indicating a deficit of intermediate-frequency alleles, and Fu and Li’s
D indicates an excess of singleton alleles. Durrett and Schweinsberg (2005) proved that in large samples, both of these summary statistics are negative under a multiple-mergers coalescent model of full sweeps, as long as lk, the
total coalescent rate when there areklineages, satisfies XN
k¼2
lk2
k
2
logðkÞ
k2 ,N: (21)
See equation 4.5 in Durrett and Schweinsberg (2005). In-formally, this condition requires that the total coalescent rate is not too much higher than the neutral coalescent rate when there are a large number of lineages. Their methods were not specific to their situation but hold for all multiple-merger coalescent models satisfying Equation 21. As above, we argued that a generalized-sweep model can be approxi-mated by a multiple-merger coalescent, and therefore it seems that reasonable generalized-sweep models will, at least for large samples, have a frequency spectrum that is skewed toward singletons at the expense of intermediate-frequency alleles (a notable exception is the“low-frequency” limit we discuss below).
Limiting processes
Before we move to discuss the implications of these results for data analysis there are two limiting processes that merit
our attention. The first is when the rate of sweeps is sufficiently high to dominate genetic drift as a source of stochasticity. The second limit results when sweeps very rarely achieve high frequency in the population, in which case the resulting coalescent model is identical to the standard neutral coalescent, despite the fact that much of the stochasticity may be driven by sweeps.
The rapid sweep limit: A surprising conclusion from the homogeneous model and Equation 16 is that if all coales-cences come from “selective” events, then the frequency spectrum does not depend on the density of selective targets or on the recombination rate (although the number of seg-regating sites certainly does). This effect can be seen in Figure 5D as the fraction of singleton sites plateaus when the reduction inpis large;i.e., when the population-scaled rate of sweeps per unit of recombination is high,nBP/rBP 1/2N. The easiest way to see this is to takeN/Nwhile keeping the rate of sweeps and their trajectory dynamics
fixed, so that in a sample offixed size the coalescence rate from Equation 16 converges tolk,i/nBP/rBPJk,i, whereJk,i
does not depend onnBP,rBP, orN. In this limit,nBPandrBP affect the process only by a timescaling, do not affect the transition probabilities of Equation 11, and so do not affect the frequency spectrum. Diversity in this limit behaves as
E½p ¼ 2mrBP nBPJ2;2
(22)
(assuming, as usual, thatmis sufficiently small);i.e., nucle-otide diversity increases linearly with the recombination rate, if neithernBPnorJ2,2varies across recombination envi-ronments. Similar limits can also be derived by lettingN/N
under the more general coalescent process with rates given by Equation 7.
For this limit to be a reasonable approximation for a sample of size kin a population of size N, we need the rate of neutral coalescences to be much smaller than the rate of selective coalescences; i.e.,
k
2
NnBP=rBP Pk
i¼2Jk;i. In
sufficiently large samples,
k
2
will be large enough that the coalescence rate due to genetic drift will be appreciable, at least until the number of lineages surviving back in time declines. From a technical standpoint, this is related to the question of whether the coalescent process “comes down from infinity”(for a review see Berestycki 2009).
The low-frequency limit:As noted in our discussion of Fig-ure 5, the frequency spectrum may be close to neutral in appearance even with large reductions in p if selected alleles sweep only to low frequency. In fact, by taking a limit (satisfying certain conditions) in which sweeps occur fre-quently, but each sweep has a small probability of causing coalescence, we can recover Kingman’s coalescent.
shown in Appendix C, a sufficient condition for this is that limn/NnR01q
2fðqÞdqis finite. In this limiting case, the rate of coalescence is
lk¼
k
2
gþ 1
2N
; (23)
so the limiting model behaves exactly as the standard neutral coalescent but with an effective population size of
Ne¼
2N
2Ngþ1: (24)
Note that the limiting coalescent process does not satisfy condition (21) of Durrett and Schweinsberg (2005) and that Tajima’sDand Fu and Li’sHwill have mean equal to zero at all sample sizes, as is natural since the limiting process is just the neutral (Kingman’s) coalescent.
In the case of our simple partial-sweep coalescent this limit would occur if the frequency xreached by sweeps is taken to zero as the rate of sweeps grows at least as 1/x2. The simple homogeneous full-sweep coalescent process ob-viously cannot be taken to this limit as there is a proscribed set ofJk,•, which features a nontrivial amount of coalescence
involving more than pairs of lineages.
Interference:In both limits discussed above the population-scaled rate of sweeps has to be very high. In the first limit the rate of sweeps has to be high enough to dominate the rate of neutral coalescence, and in the second limit the rate of sweeps has to be high enough to compensate for the fact that any one sweep is very unlikely to cause coalescence. The requirement of a high rate of sweeps implies that interference between the sweeps may occur, thus violating our assumption that the sweeps are independent. Inves-tigations of the effect of such interference on the signal of hitchhiking have shown that interference reduces the impact of any one sweep on patterns of polymorphism (Kim and Stephan 2003; Chevinet al.2008), although to interfere, the sweeps must begin at very similar times at loci separated by a low recombination rate. This suggests that a very high rate of sweeps is needed indeed before interference will have an appreciable impact on the hitchhiking effect, as would occur in the homogeneous sweep model if nBP/rBP is very large. The limits we describe above require only that the population-size–scaled rate of sweeps (NnorNnBP) be high, and there-fore it is possible to keep the per generationrate of sweeps sufficiently low to avoid the effect of interference. Further work is needed to investigate coalescent models under such high rates of sweeps and could be useful in understanding genealogical processes in organisms with low or no recom-bination that also experience strong selection pressures.
Discussion
The prevailing view of adaptation in a population genetics setting is based on a lone selected allele racing from its
introduction into the population to fixation, carrying with it a chunk of the chromosome on which it arose. This cartoon has been a very useful prop for developing tests to identify genes underlying recent adaptations and for interpreting genome-wide patterns of polymorphism. How-ever, it seems likely that such full sweeps constitute only a small proportion of the selected loci whose frequency changes in response to adaptation (see Pritchard et al.
2010, for a recent discussion). If we are to develop a better understanding of the full impact of linked selection on patterns of diversity, we need to develop a richer and more
flexible set of models.
The work in this article was motivated by models in which the external environment or the genetic background varies on a fast enough timescale that new alleles rarely reach fixation before selective pressures change, either slowing their advance or reversing their trajectory. We laid out an approximation to the coalescent process under such a model and showed that, while the initial rapid stage of the trajectory will strongly affect the coalescent process, subsequent slower dynamics of the selected alleles have a much smaller effect. We then extended this idea to a recurrent-sweep model, approximating the dynamics by a multiple-merger coalescent. While some of our results are fairly general, to provide a more intuitive sense we have often employed simple allele-frequency trajectories and made other approximations. Nonetheless, we expect more realistic models to give rise to qualitatively equivalent results.
Each sweep we consider consists of a single allele at a locus rising on a single haplotype from very low frequency into the population. This contrasts with many other soft-sweep models, under which a soft-sweep starts on multiple haplotypes, because multiple different alleles initially seg-regated at the locus (Hermisson and Pennings 2005), or as a result of multiple mutations occurring after selection pres-sures switched (Pennings and Hermisson 2006a,b; Ralph and Coop 2010), or because the adaptive allele was previ-ously neutral and present on multiple haplotypes (Innan and Kim 2004; Przeworski et al.2005). It is likely that re-current models of such soft sweeps could be approximated through coalescent models with simultaneous multiple col-lisions (Schweinsberg 2000), to model the simultaneous rise of multiple haplotypes. This seems to be a fruitful area of future work as it would substantially extend our under-standing of the effects of a broad family of recurrent-sweep models on genomic patterns of diversity.
The interpretation of population genomic patterns
Models in which selective sweeps do not always sweep to
fixation have a much wider spectrum of predictions than the recurrent full-sweep model. Three broad correlations that have been used to argue for the prevalence of linked selection and used to potentially discriminate between models invoking background selection or full sweeps are (1) correlations between neutral diversity and the recombi-nation rate, (2) correlations between the frequency spec-trum and the rate of recombination, and (3) correlations between putatively adaptive divergence and neutral di-versity. We now describe some of the implications of our results for understanding these patterns in population genomic data.
Correlation between recombination and diversity
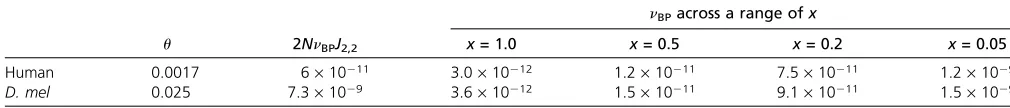
One of the earliest and most compelling pieces of evidence for the role of linked selection in the fate of neutral alleles is a positive correlation between recombination and levels of diversity at putatively neutral sites (factoring out substitu-tion rates as a proxy for differences in mutasubstitu-tion rate). This pattern is consistent with both full sweeps and background selection, as both predict positive, albeit differently shaped, relationships (Innan and Stephan 2003). The shape of the diversity–recombination curve under a homogeneous rate of partial sweeps is identical to that of the full-sweep model and more generally similar for a broad class of homoge-neous sweep models. In fact, the relationship under a homo-geneous model depends only on 2NnBPJ2,2, as seen in Equation 20.
To illustrate this point, in Table 1 we present estimates of 2NnBPJ2,2for humans andDrosophila melanogaster, assum-ing a model with drift and a homogeneous rate of selective sweeps across the genome, and from Equation 20 and data from Shapiro et al. (2007) and Hellmann et al. (2008). Along with these estimates, Table 1 also shows the implied rate of sweeps per generation per base pair,nBP, under the simple partial-sweep model, for a variety of values of x. These rates are surely overestimates and are intended for illustrative purposes only, as they ignore the effect of other forms of linked selection,e.g., background selection.
The strength of the relationship between diversity levels and recombination varies dramatically between the two species, as indicated by the very different estimates of 2NnBPJ2,2(note that the estimates ofnBPare similar due to
the 100-fold difference inN). InDrosophilathe positive re-lationship between recombination and diversity is strong (e.g., Aguadeet al.1989; Berryet al.1991; Begun and Aquadro 1992; Begunet al.2007; Shapiroet al.2007), but in humans the relationship seems to be weaker and is and complicated by other confounding factors (Payseur and Nachman 2002; Hellmann et al. 2003, 2005, 2008; Caiet al. 2009). How-ever, we should be cautious in the biological interpretation of this difference, as in humans diversity is usually estimated in large windows (much of which will be noncoding and far from genes), while inDrosophilaneutral diversity levels are usually estimated from synonymous sites in individual genes. What is needed is a comparative analysis that studies these patterns at the same genomic scale and accounts for the profound differences in the density of functional targets among species.
The fact that the diversity–recombination curve plateaus rapidly in humans is strong evidence that linked selection does not affect the average neutral site in regions of high recombination. Technically, this could also occur if the den-sity of selective targetsnBPdecreases approximately linearly with recombination rate; however, this option does not seem likelya priori.
Although inD. melanogasterthis curve is still concave, it does not appear toflatten completely in high-recombination regions (e.g., Sellaet al.2009), suggesting that linked selec-tion is an important source of stochasticity even in these regions. At face value the concave nature of the curve sug-gests that both genetic drift and linked selection contribute to stochasticity, asNnBPrBPwould lead to an almost linear relationship across the observed range of recombination rates (see Equation 22). However, a model with effectively no genetic drift can produce a concave curve and fit the observed data ifnBPJ2,2is not constant across recombination environments, e.g., if sweeps occur at a moderately higher rate or achieve higher frequency in high-recombination regions. Neither of these two options seems particularly un-likely, suggesting that we still have little unambiguous evi-dence favoring genetic drift as an important source of stochasticity inDrosophila.
The frequency spectrum
The recurrent full-sweep model predicts a strong positive relationship between the reduction in neutral diversity and the skew toward rare alleles (Braverman et al. 1995; Kim
Table 1 Estimates of sweep parameters from the relationship between diversity and recombination
nBPacross a range ofx
u 2NnBPJ2,2 x= 1.0 x= 0.5 x= 0.2 x= 0.05
Human 0.0017 6·10211 3.0·10212 1.2·10211 7.5·10211 1.2·1029
D. mel 0.025 7.3·1029 3.6·10212 1.5·10211 9.1·10211 1.5·1029
2006), a pattern not predicted under models of strong back-ground selection. This relationship has been used to test between full sweeps and background selection models, al-though note that as we discussed inLimiting processes, this relationship is not expected if all coalescence comes from selective sweeps. Under our simple trajectory model, the distortion of the frequency spectrum is primarily determined by the frequencies that sweeps achieve. Therefore, although a lack of a strong skew in the frequency spectrum is consis-tent with a low rate of full sweeps, it cannot be used to rule out a high rate of partial sweeps. A lack of a genomic re-lationship between the frequency spectrum and recombina-tion rate is therefore not grounds for rejecting sweeps as a force in shaping genetic diversity in favor of a model of background selection. Our results suggest that recurrent partial sweeps to low frequency in regions of high recombi-nation in D. melanogaster and in the low-recombination regions in humans may be a major source of stochasticity in allele frequencies.
Correlation between divergence and polymorphism
Attention has recently focused on examining the correlation between neutral diversity and amino acid substitutions (or other putatively functional changes) between recently separated species. If a reasonable fraction of amino acid substitutions are driven by new mutations sweeping to
fixation, then levels of diversity should dip on average around amino acid substitutions. This relationship has been tested for by looking for a positive correlation between di-versity levels and amino acid substitution rates (Andolfatto 2007; Macphersonet al.2007; Caiet al.2009; Haddrillet al.
2011) or for a dip in diversity levels around a large set of aggregated amino acid substitutions (Hernandezet al.2011; Sattathet al.2011). If the density of functional sites is prop-erly controlled for, these types of correlations between amino acid substitutions and neutral diversity are not expected under a (simple) model of background selection. Such correlations have been detected in Drosophila (Mac-phersonet al.2007; Sattathet al.2011) but in humans the dip in diversity around nonsynonymous substitutions seems to result from the dip in diversity levels around genes, an observation that seems inconsistent with a high rate of strong full sweeps (Hernandez et al. 2011). Similarly, it has been observed that the highestFSTsignals between hu-man populations are not associated with strongly reduced haplotypic diversity (Coopet al.2009).
The fact that selected alleles in the partial-sweep co-alescent model do not have to sweep all the way tofixation partially decouples the rate of fixation of adaptive alleles from their effects on patterns of diversity within popula-tions. Therefore, the strength of the positive relationship between substitution rates and diversity depends on the fate of alleles that sweep into the population. For example, this positive relationship may be weak and a poor predictor of the total reduction in diversity, if the majority of adaptive alleles that initially sweep into the population are eventually
lost (e.g., as can be the case for major-effect alleles in poly-genic models of adaptation, see Lande 1983; Chevin and Hospital 2008).
Concluding thoughts
In this article, we have concerned ourselves with patterns of diversity at a single neutral site. However, partial sweeps also have a strong effect on linkage disequilibrium and haplotype diversity, a signature that has been exploited in scans for selection (e.g., Hudson et al. 1994; Sabeti et al.
2002; Voight et al. 2006). One simple case that we can immediately describe is the lowqlimit (Limiting processes). In that limit, the coalescent is equivalent to the standard neutral model and as such the decay of linkage disequilib-rium will be the same as in the standard neutral model with an Ne given by Equation 24. A natural way to extend this exploration would be the genealogical framework developed by McVean (2007) that has recently been extended to a mul-tiple-mergers coalescent by Eldon and Wakeley (2008).
We will soon have polymorphism data across a broad range of taxa that will differ dramatically in selection regimes, recombination rates, genome size, and population size, allowing a much fuller picture of how these various factors interplay to shape genome-wide levels of polymor-phism. The results presented here, however, suggest that we will continue to struggle to distinguish between modes of selection, as relaxing the assumptions of various models can generate a broad range of overlapping predictions.
Despite that, our results suggest a promising way for-ward, since a broad range of sweep models can be captured by simple parameterizations of multiple-merger coalescence processes. Importantly, this would allow parameter infer-ence under a general model of linked selection, rather than focusing on a limited number of specific models. For example, we could estimate the rate that selection forces different numbers of lineages to coalesce [parameterized by
nf(q)] as a function of recombination rates and the density of selective targets. As the multiple-mergers coalescent model is easily simulated under, it may be readily incorpo-rated into many of our existing genealogical inference frameworks. It is likely that parameters of such models could be estimated very precisely from genome-wide data, allowing us to concentrate on what these high-level summa-ries of polymorphism tell us about linked selection across genomic environments and species. Such inferences may be important if we wish to move beyond documenting the pres-ence of linked selection toward describing the genealogical process in species where selection is a major source of stochasticity.
Acknowledgments